Research methods

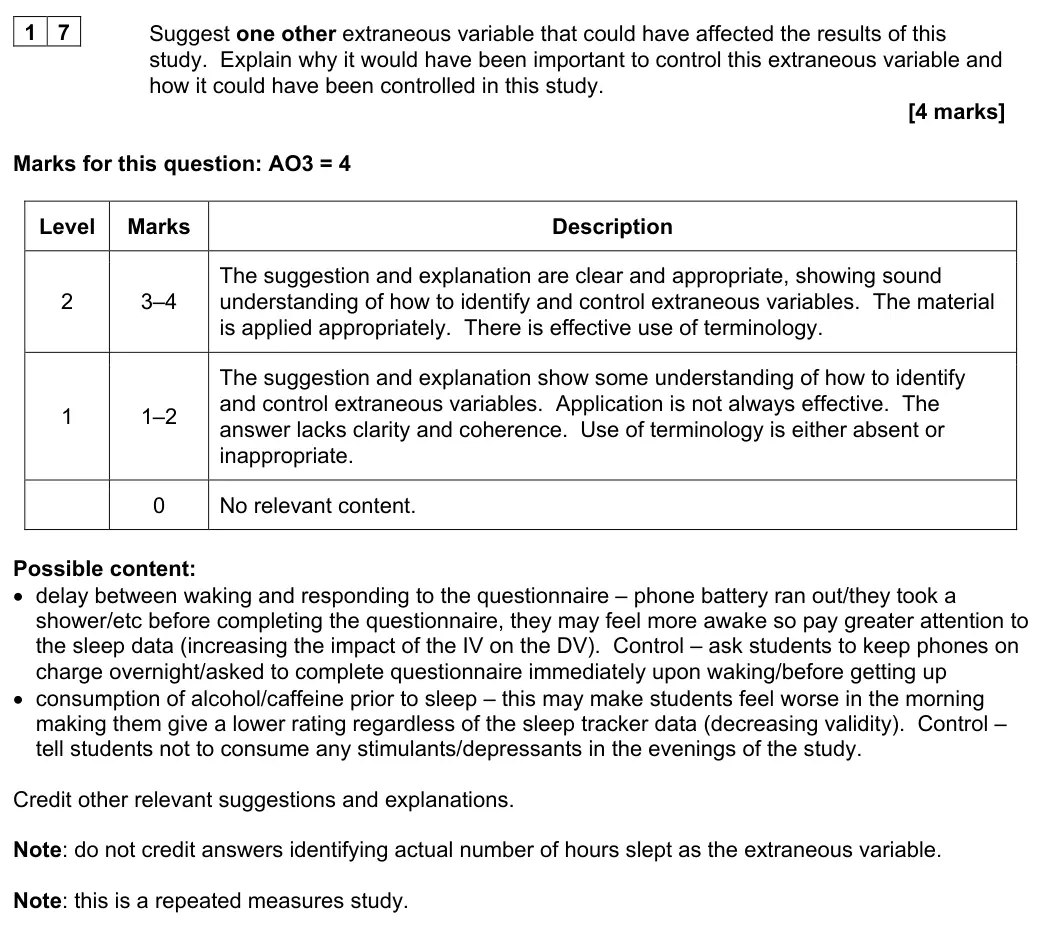
Every research-methods question since 2016: design, sampling, ethics, data and inferential testing, mostly from Paper 2 Section C. 387 questions on current content.

Other types: Application questions (using the stem) · 8- and 16-mark essays · Multiple-choice questions · Short evaluation questions (2–4 marks) · Calculations and maths skills · Outline questions (3–4 marks)

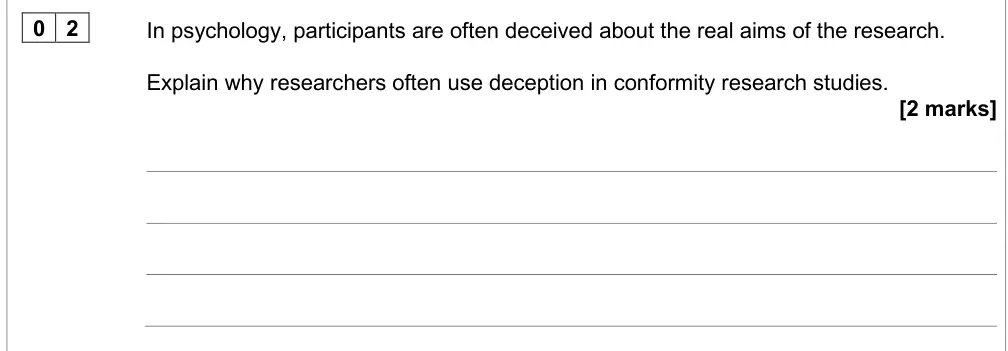
June 2025 · AS Paper 1 · Q2 2 marks AO3=2 Research methods Easy scientific processes
0 2
In psychology, participants are often deceived about the real aims of the research.
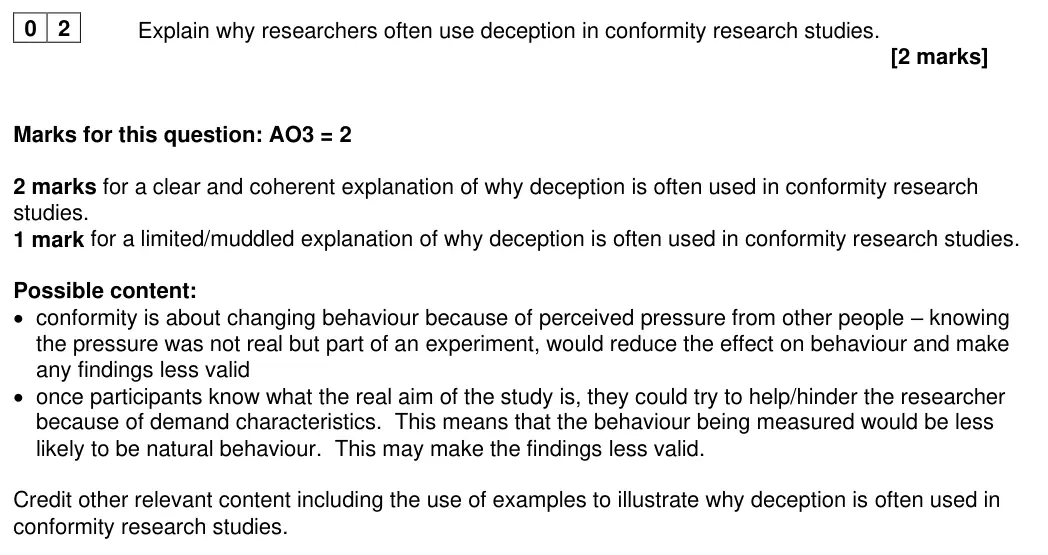
Explain why researchers often use deception in conformity research studies.
[2 marks]
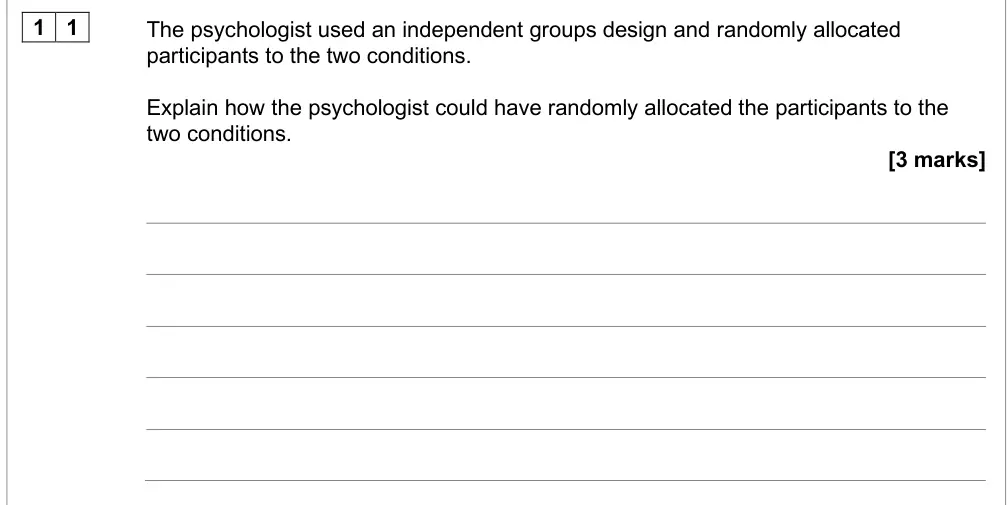
June 2025 · AS Paper 1 · Q11 3 marks AO2=3 Research methods Medium scientific processes
1 1
The psychologist used an independent groups design and randomly allocated
participants to the two conditions.
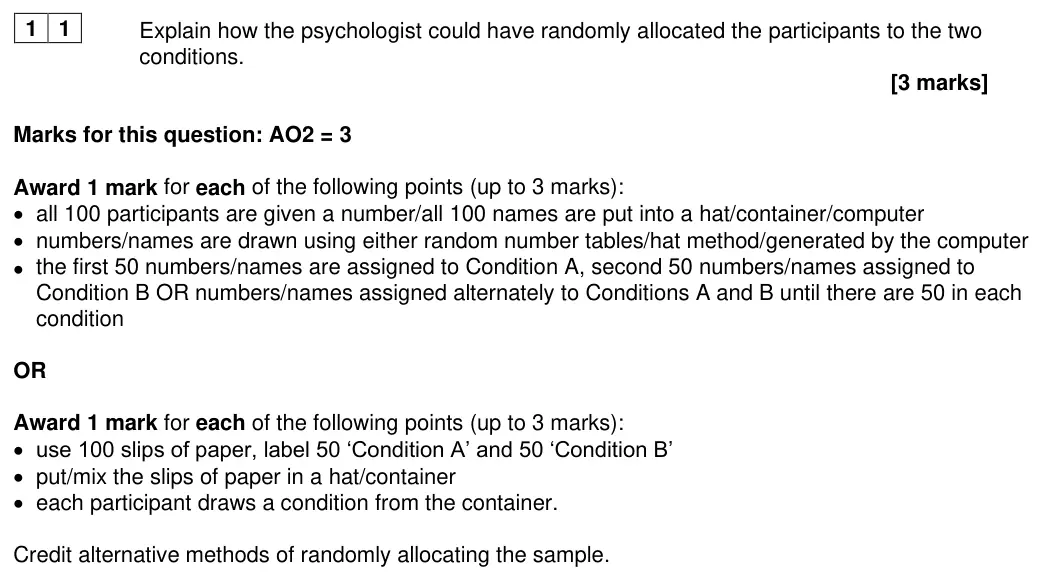
Explain how the psychologist could have randomly allocated the participants to the
two conditions.
[3 marks]
June 2025 · AS Paper 1 · Q12 4 marks AO3=4 Research methods Medium scientific processes
1 2
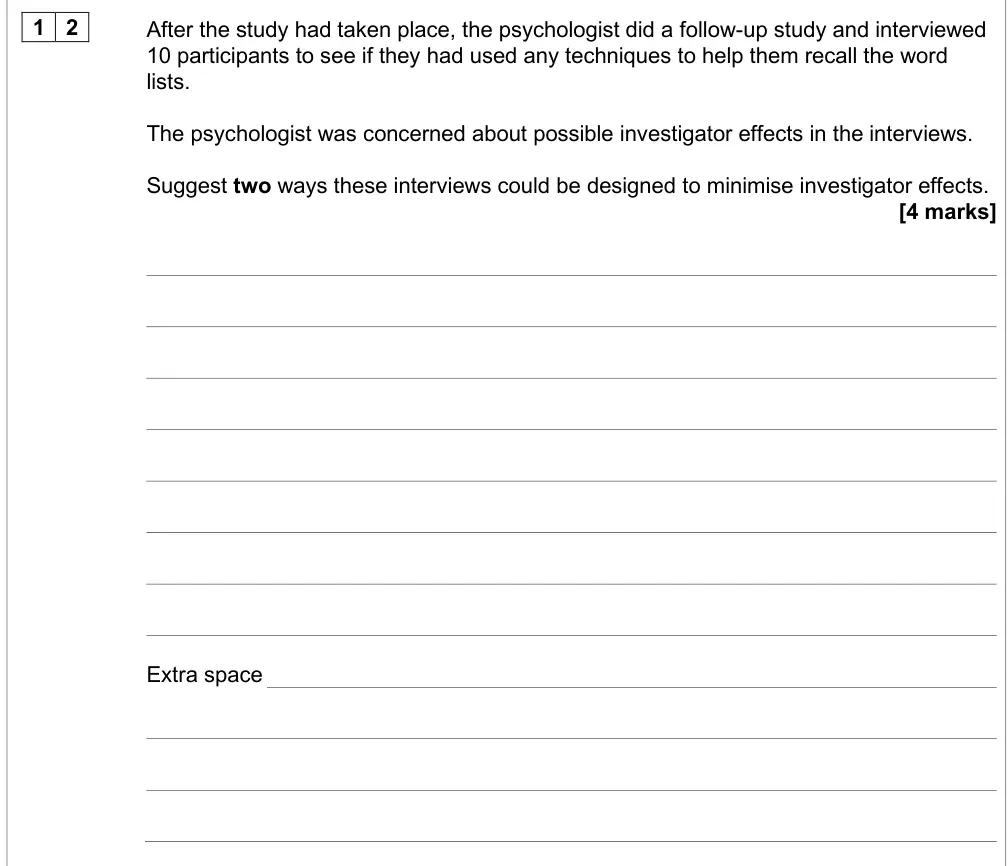
After the study had taken place, the psychologist did a follow-up study and interviewed
10 participants to see if they had used any techniques to help them recall the word
lists.
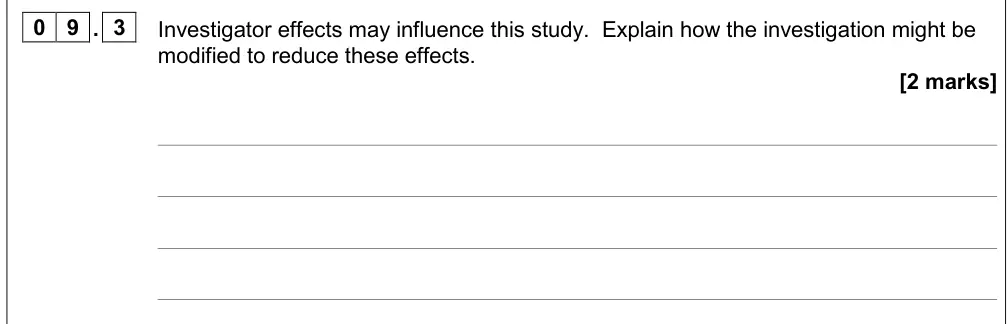
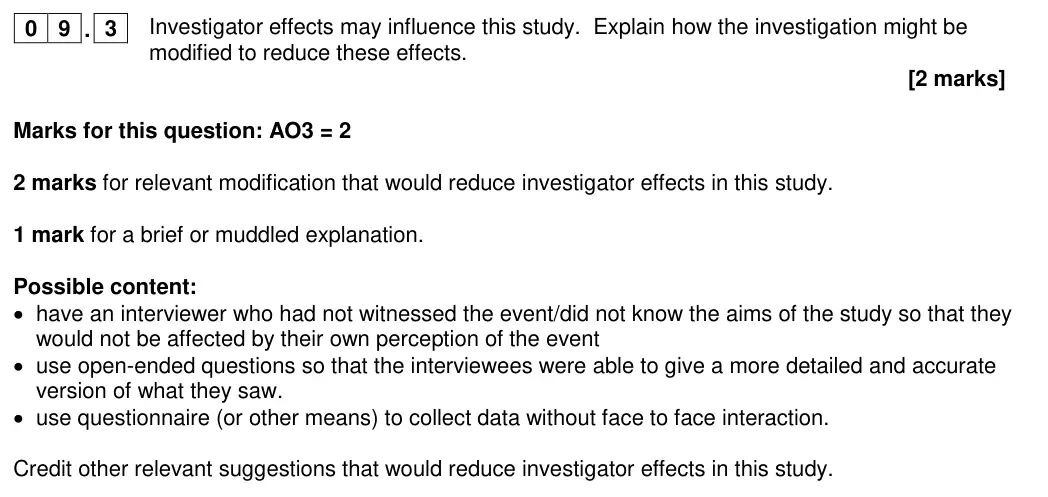
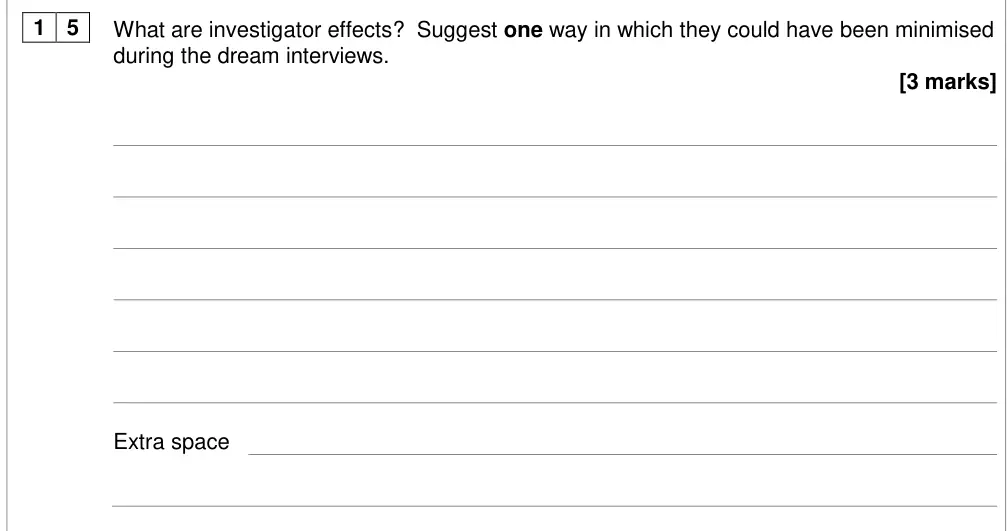
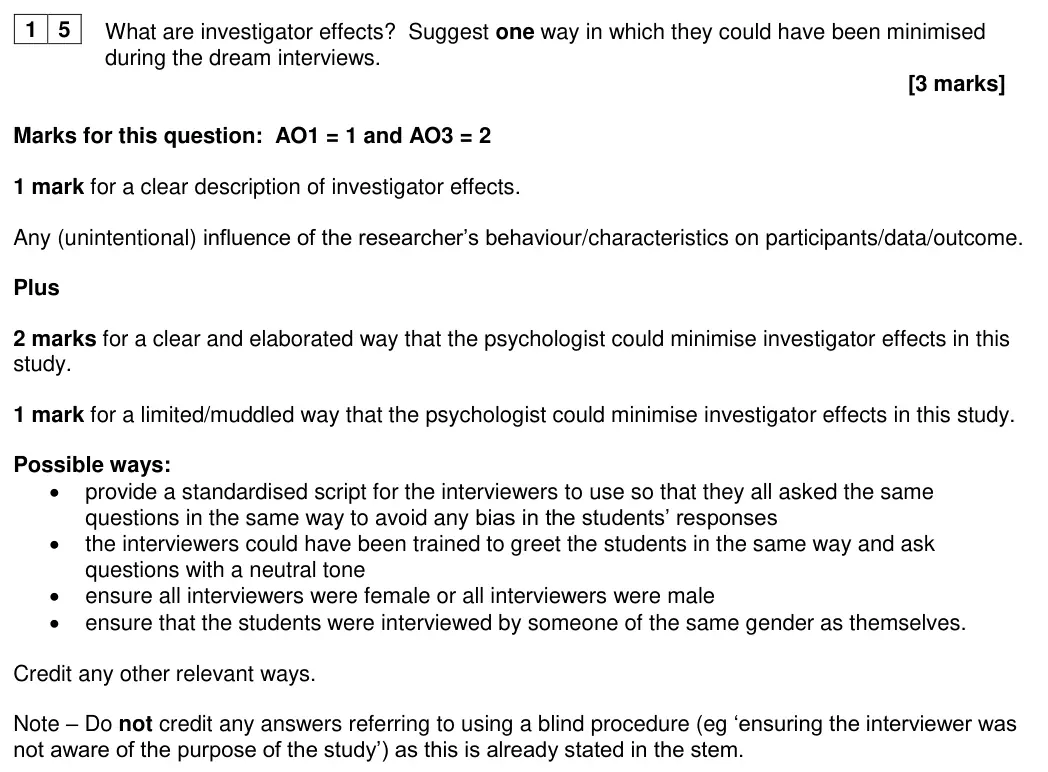
The psychologist was concerned about possible investigator effects in the interviews.
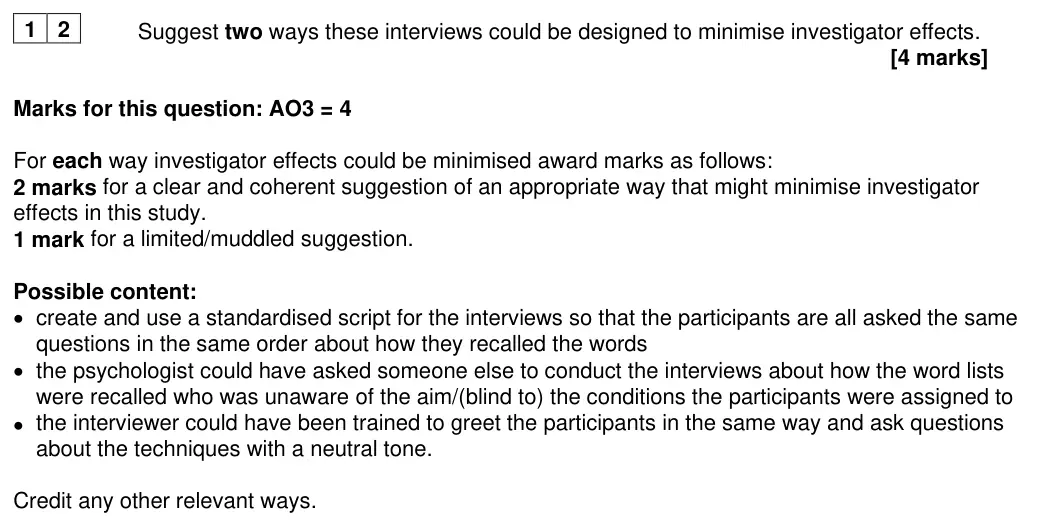
Suggest two ways these interviews could be designed to minimise investigator effects.
[4 marks]
Extra space
June 2025 · AS Paper 1 · Q15.1 2 marks AO2=2 Research methods data handling
1 5
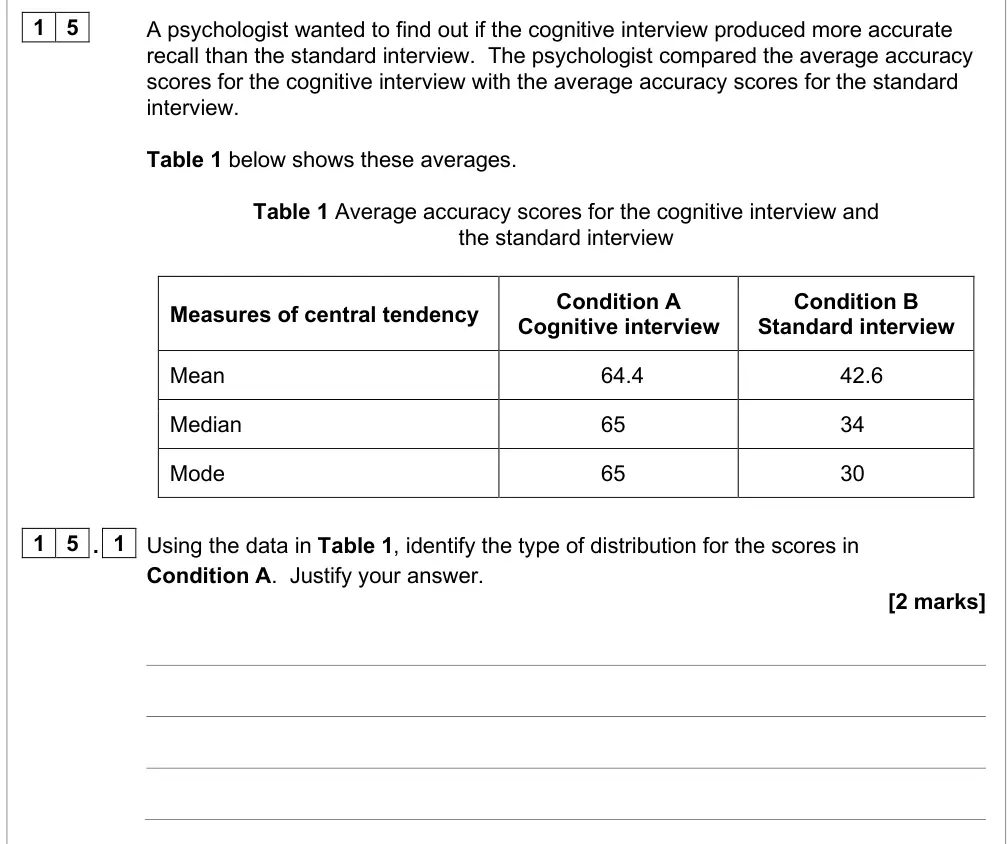
A psychologist wanted to find out if the cognitive interview produced more accurate
recall than the standard interview.  The psychologist compared the average accuracy
scores for the cognitive interview with the average accuracy scores for the standard
interview.
Table 1 below shows these averages.
Table 1 Average accuracy scores for the cognitive interview and
the standard interview
Measures of central tendency
Condition A
Condition B
Cognitive interview
Standard interview
Mean
64.4
42.6
Median
65
34
Mode
65
30
1 5 . 1
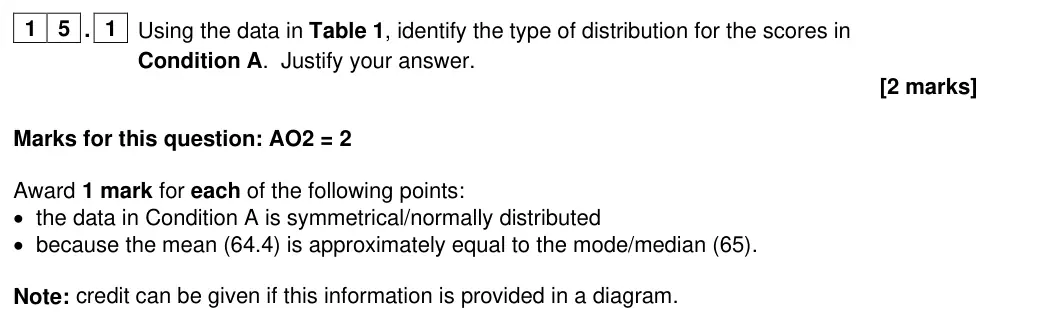
Using the data in Table 1, identify the type of distribution for the scores in
Condition A.  Justify your answer.
[2 marks]
June 2025 · AS Paper 1 · Q15.2 2 marks AO2=2 Research methods data handling
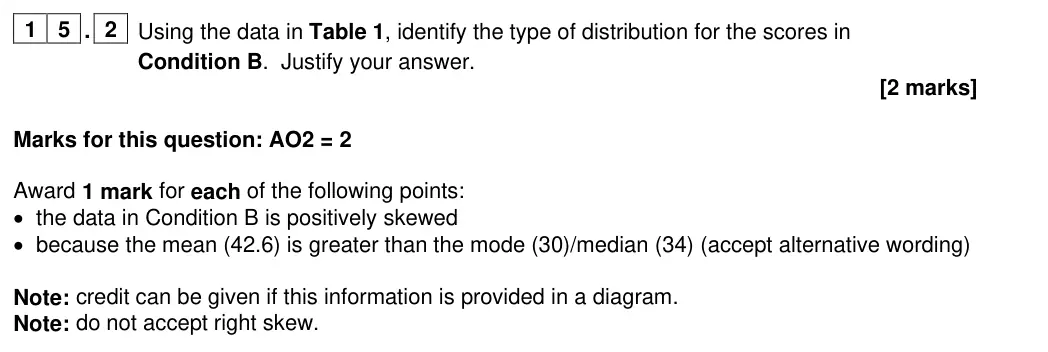
1 5 . 2
Using the data in Table 1, identify the type of distribution for the scores in
Condition B.  Justify your answer.
[2 marks]
Only one answer for each multiple-choice question is allowed.
June 2025 · AS Paper 1 · Q17 2 marks AO2=2 Research methods data handlingattachment
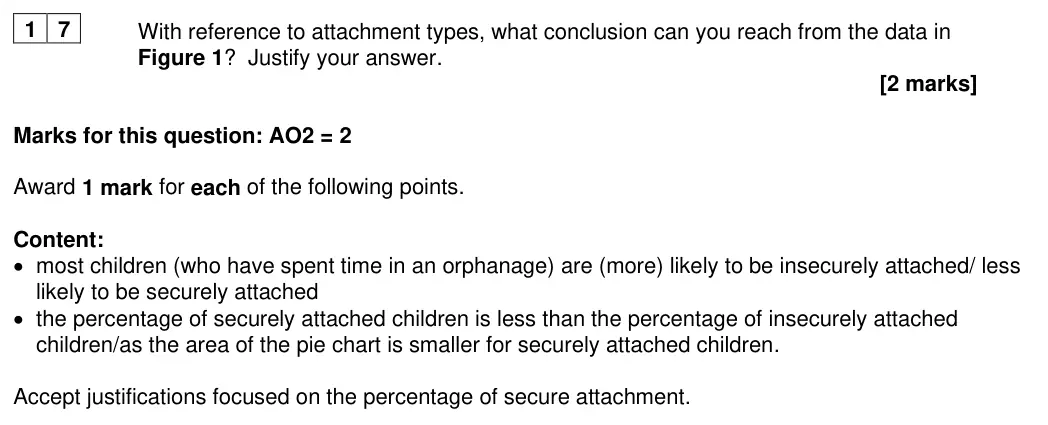
1 7
With reference to attachment types, what conclusion can you reach from the data in
Figure 1?  Justify your answer.
[2 marks]
June 2025 · Paper 1 · Q9 6 marks AO2=6 Research methods Medium inferential testingdata handlingscientific processes
0 9
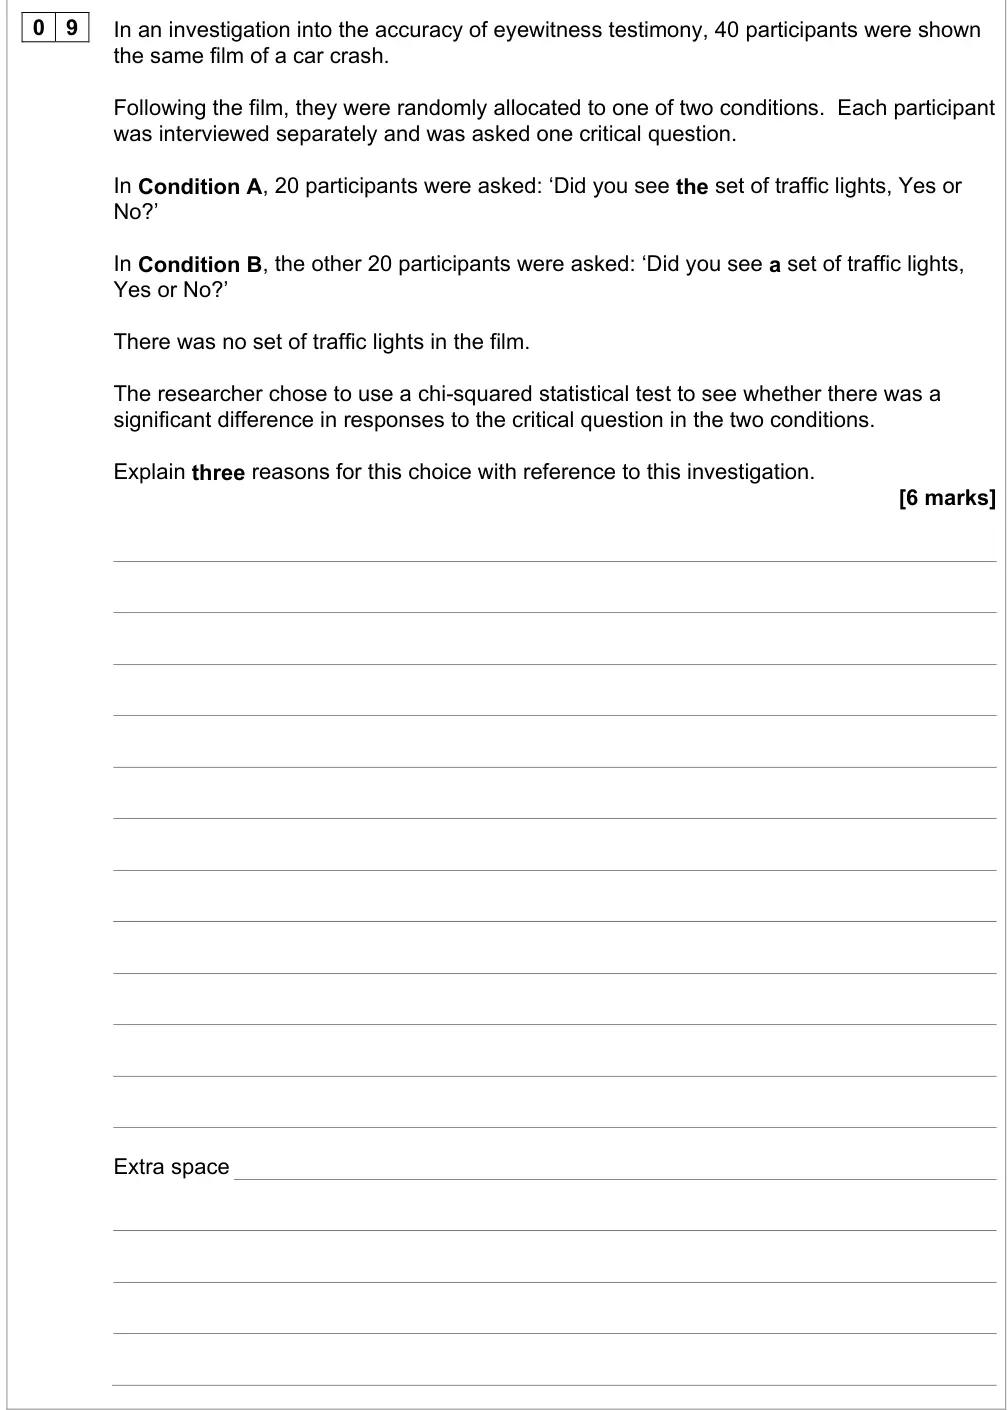
In an investigation into the accuracy of eyewitness testimony, 40 participants were shown
the same film of a car crash.
Following the film, they were randomly allocated to one of two conditions.  Each participant
was interviewed separately and was asked one critical question.
In Condition A, 20 participants were asked: ‘Did you see the set of traffic lights, Yes or
No?’
In Condition B, the other 20 participants were asked: ‘Did you see a set of traffic lights,
Yes or No?’
There was no set of traffic lights in the film.
The researcher chose to use a chi-squared statistical test to see whether there was a
significant difference in responses to the critical question in the two conditions.
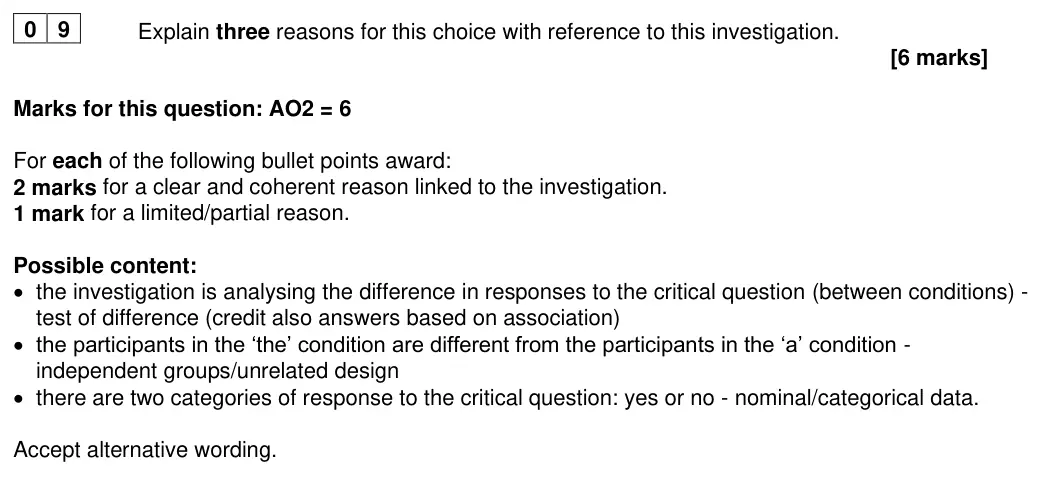
Explain three reasons for this choice with reference to this investigation.
[6 marks]
Extra space
June 2025 · Paper 1 · Q13 2 marks AO2=2 Research methods scientific processes
1 3
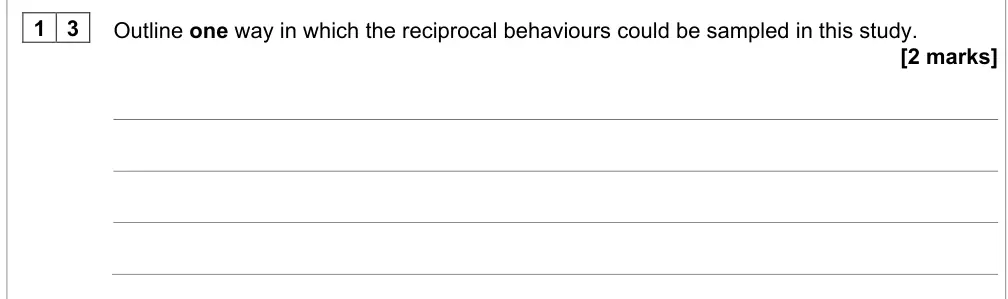
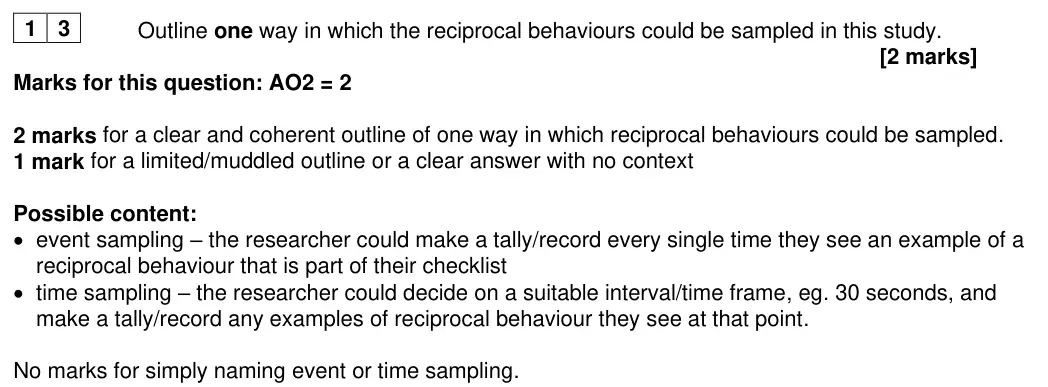
Outline one way in which the reciprocal behaviours could be sampled in this study.
[2 marks]
June 2025 · Paper 1 · Q14 2 marks AO2=2 Research methods scientific processesdata handling
1 4
The two researchers compared their data to assess inter-observer reliability.  This
produced a correlation coefficient of +0.26
Briefly explain what a correlation coefficient of +0.26 means in terms of the reliability of the
two researchers’ observations.
[2 marks]
June 2025 · Paper 1 · Q15 2 marks AO3=2 Research methods Medium scientific processes
1 5
Outline one way in which the reliability of the two researchers could be improved.
[2 marks]
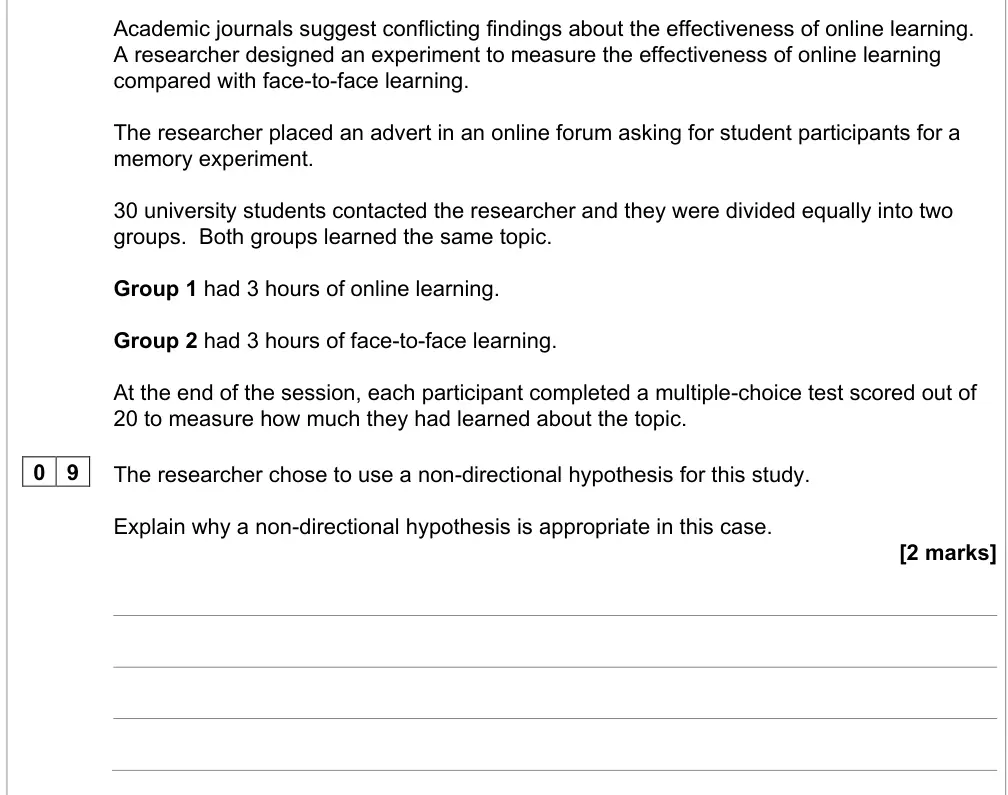
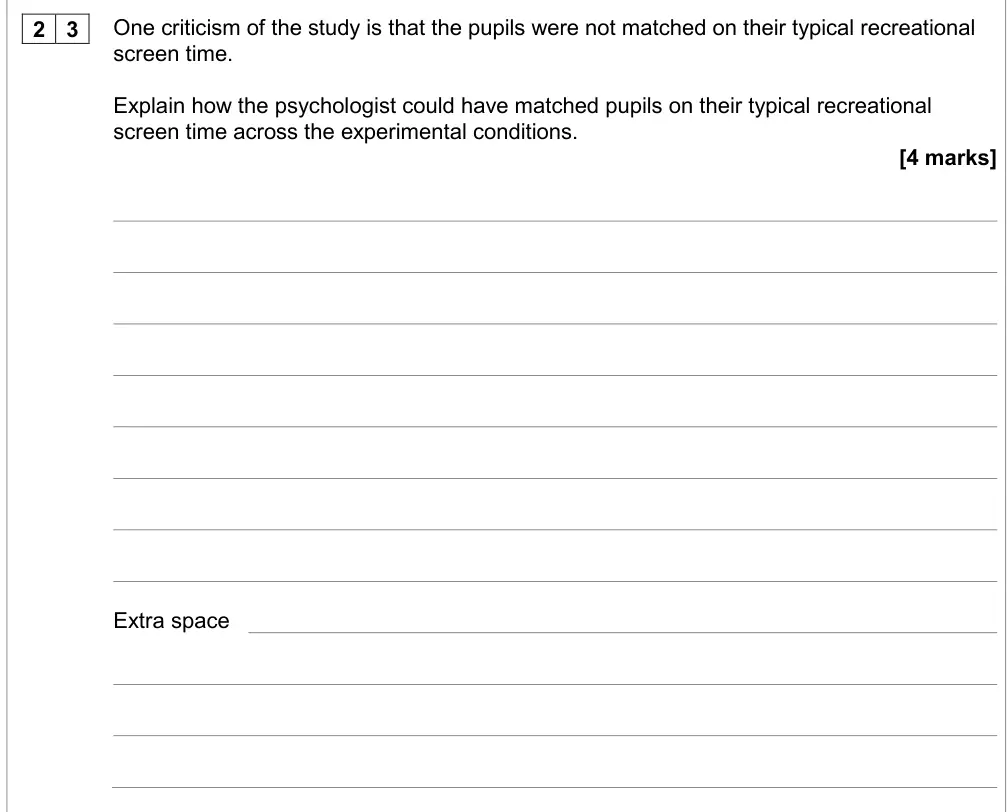
June 2025 · Paper 2 · Q9 2 marks AO2=2 Research methods scientific processes
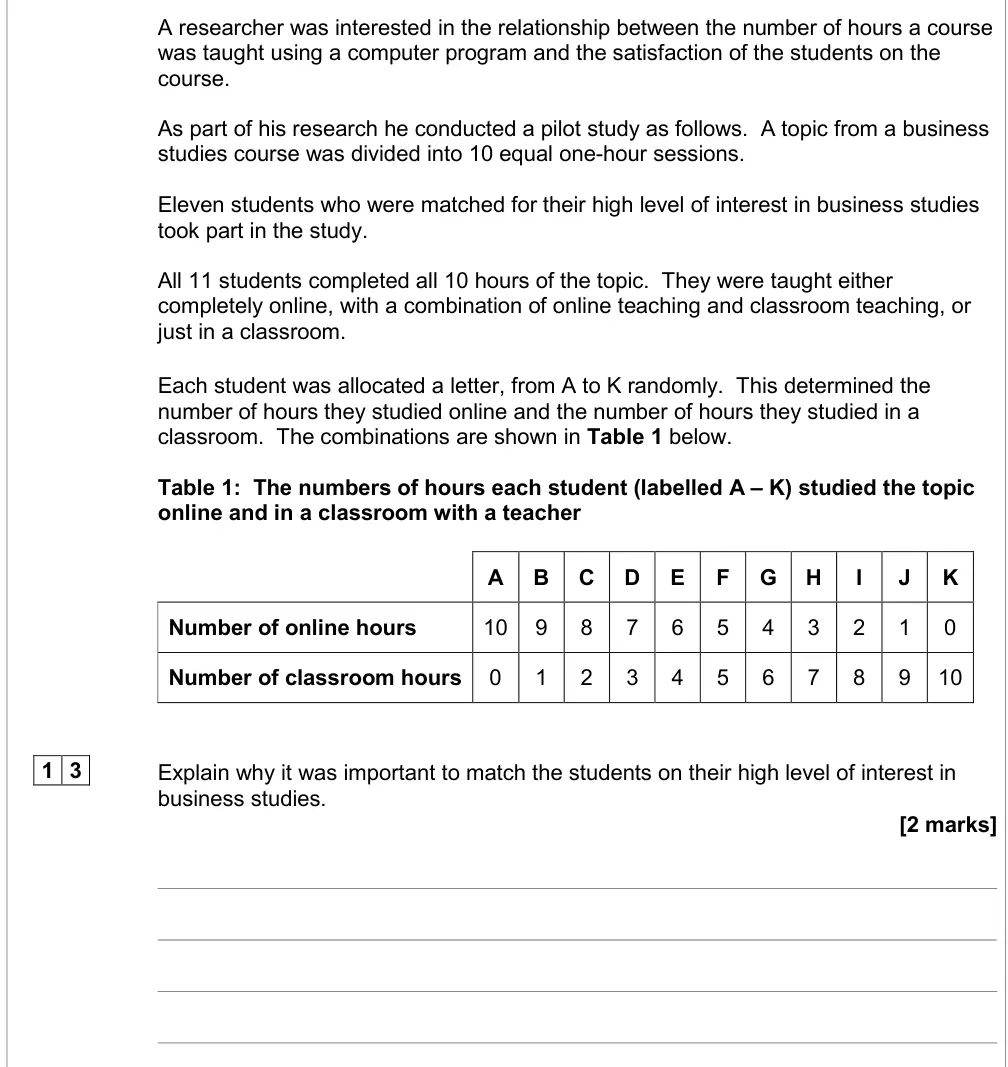
Academic journals suggest conflicting findings about the effectiveness of online learning.
A researcher designed an experiment to measure the effectiveness of online learning
compared with face-to-face learning.
The researcher placed an advert in an online forum asking for student participants for a
memory experiment.
30 university students contacted the researcher and they were divided equally into two
groups.  Both groups learned the same topic.
Group 1 had 3 hours of online learning.
Group 2 had 3 hours of face-to-face learning.
At the end of the session, each participant completed a multiple-choice test scored out of
20 to measure how much they had learned about the topic.
0 9
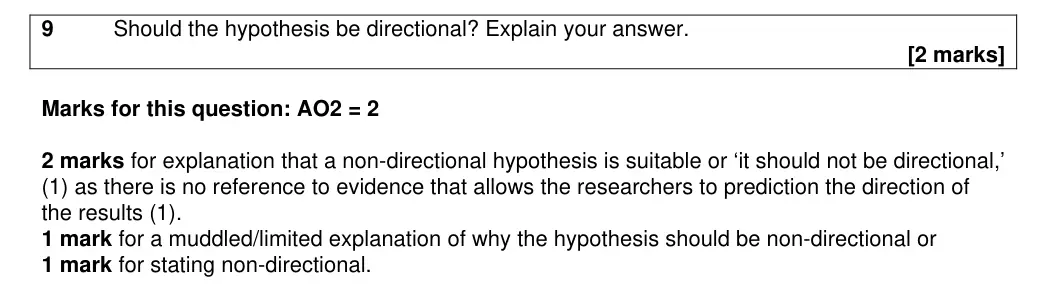
The researcher chose to use a non-directional hypothesis for this study.
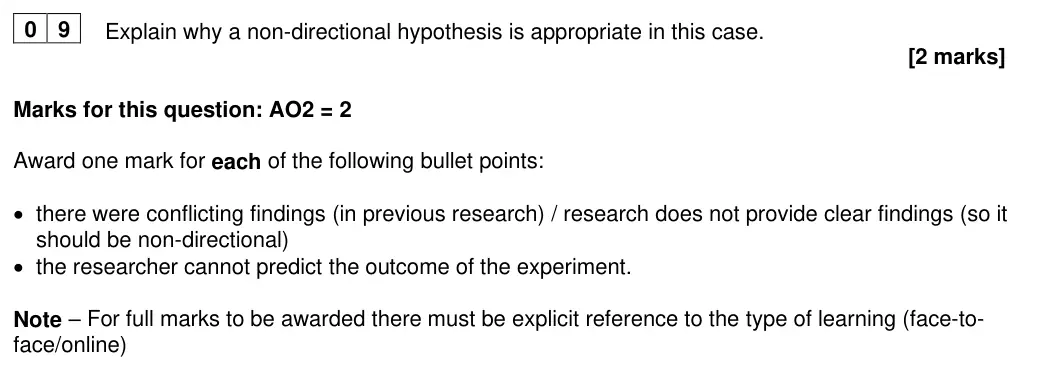
Explain why a non-directional hypothesis is appropriate in this case.
[2 marks]
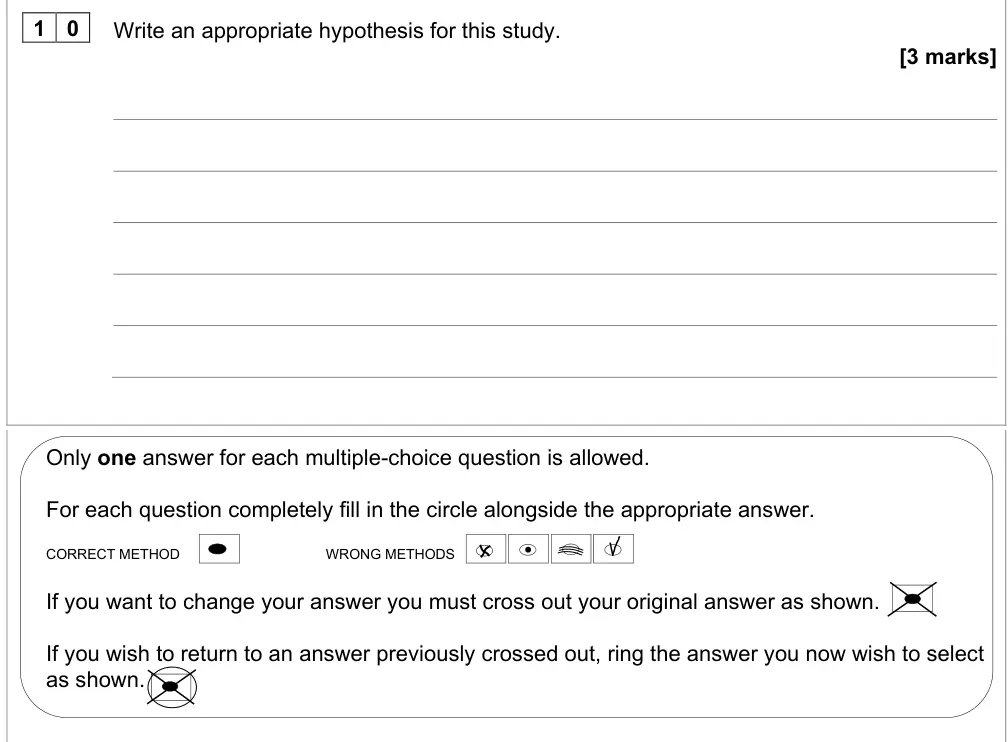
June 2025 · Paper 2 · Q10 3 marks AO2=3 Research methods scientific processes
1 0
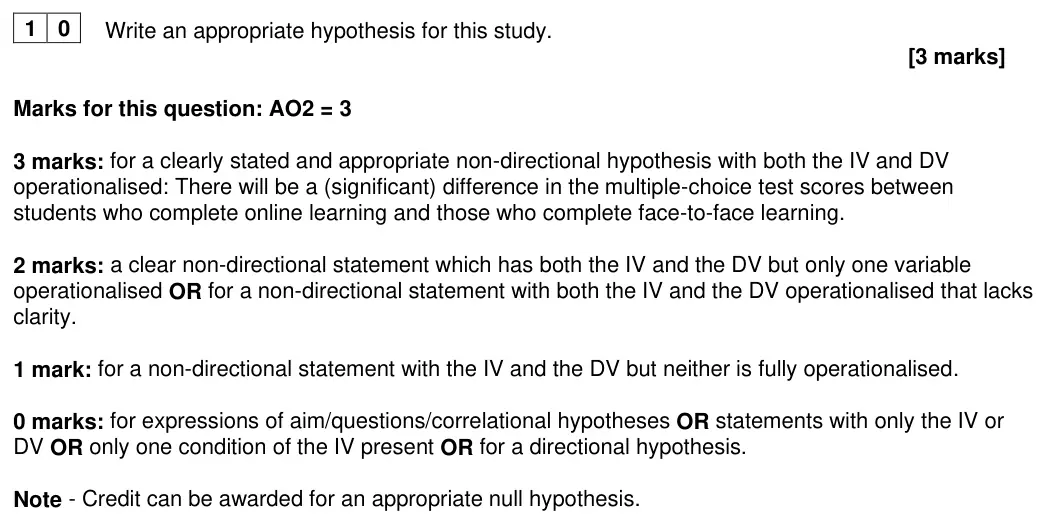
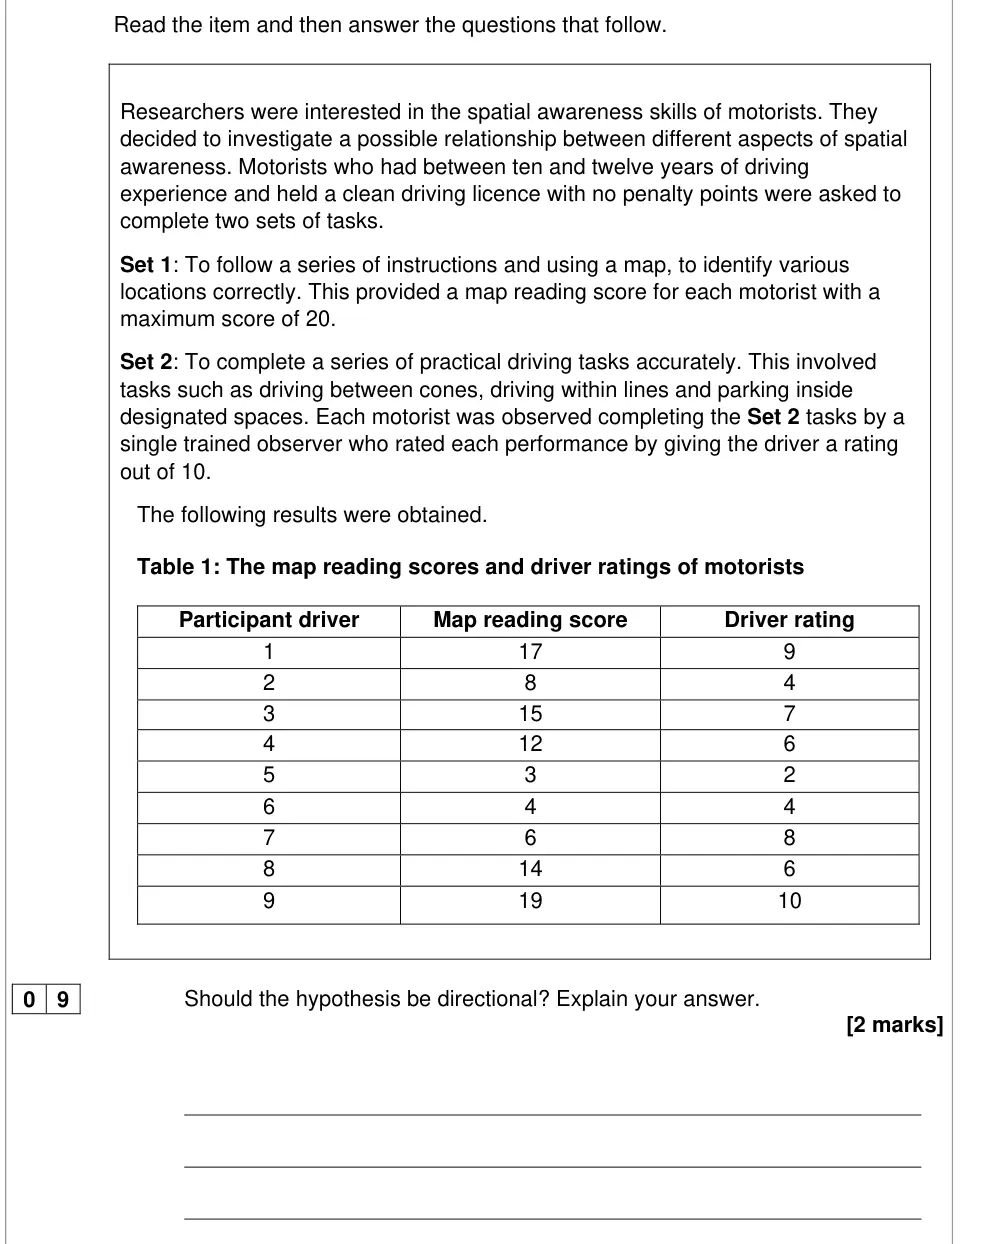
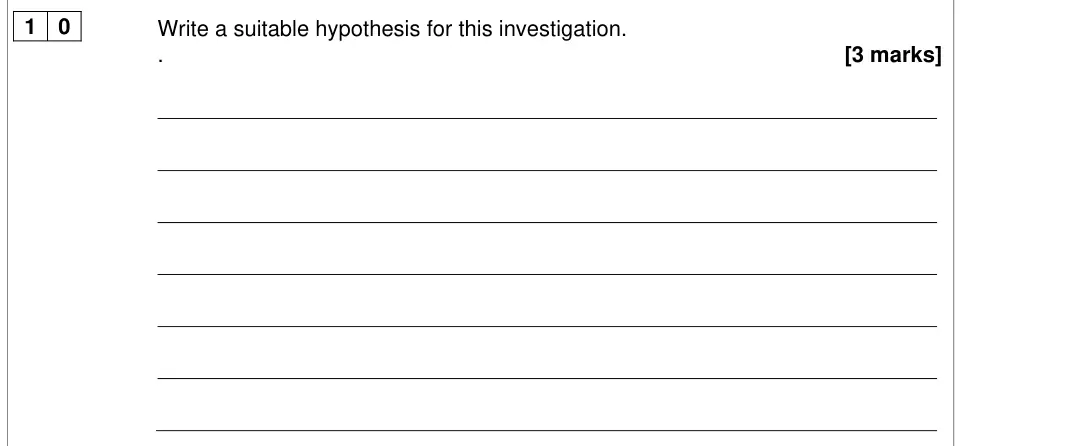
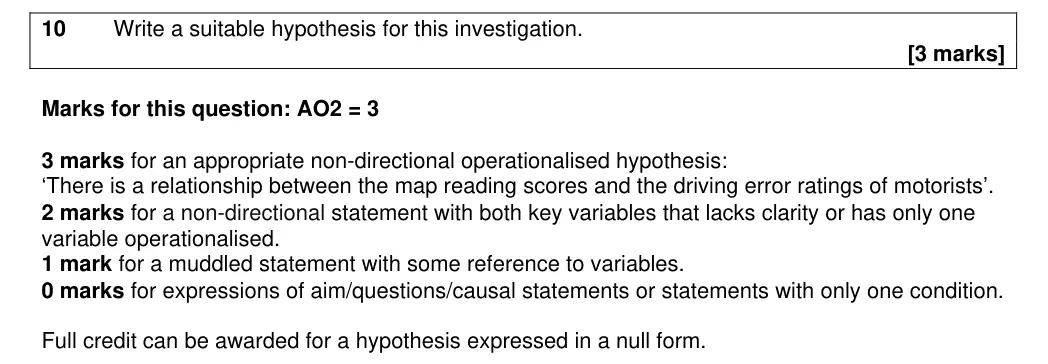
Write an appropriate hypothesis for this study.
[3 marks]
Only one answer for each multiple-choice question is allowed.
June 2025 · Paper 2 · Q12 4 marks AO2=4 Research methods scientific processes
1 2
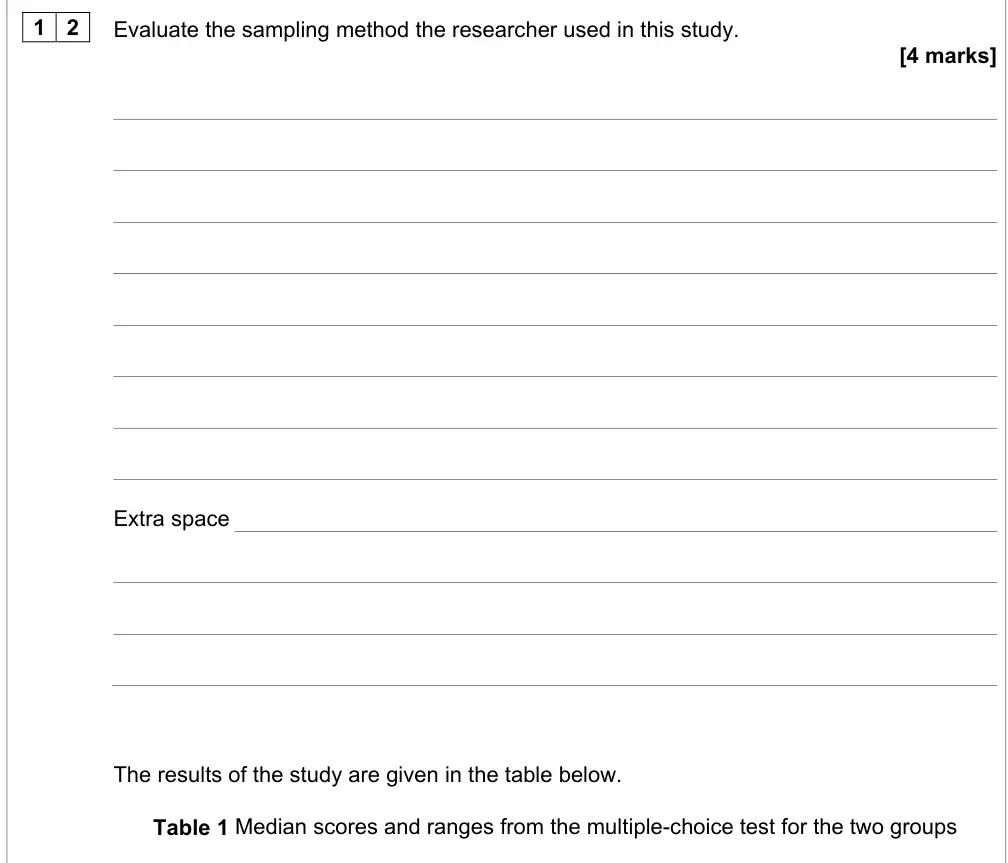
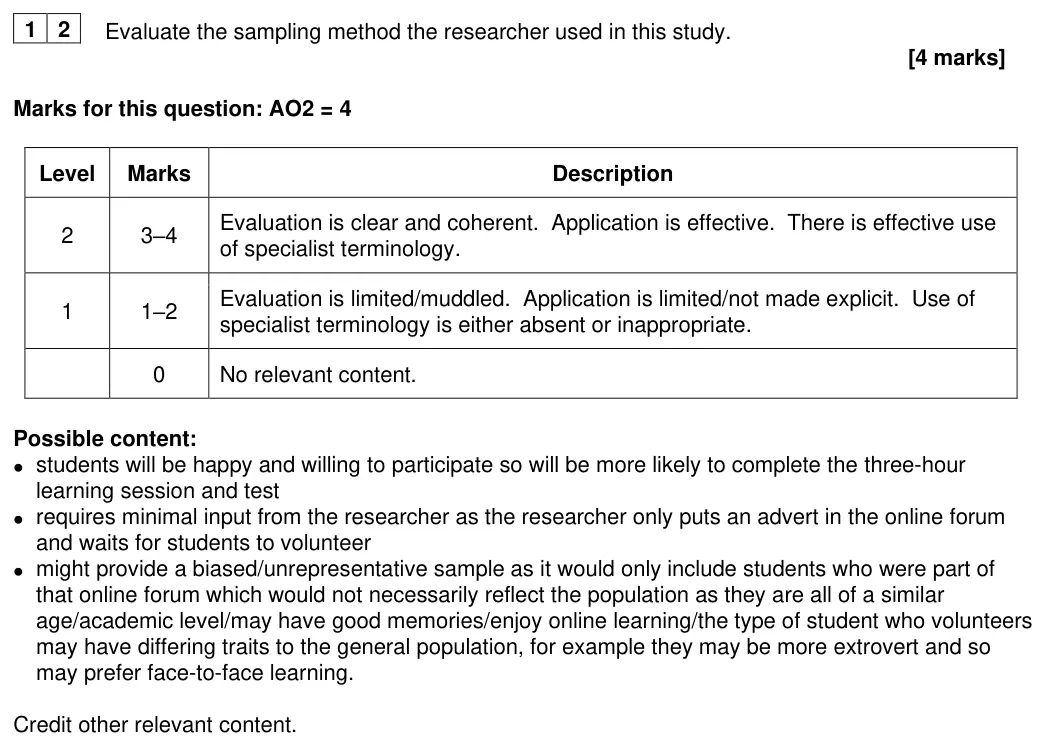
Evaluate the sampling method the researcher used in this study.
[4 marks]
Extra space
The results of the study are given in the table below.
Table 1 Median scores and ranges from the multiple-choice test for the two groups
June 2025 · Paper 2 · Q13 4 marks AO2=4 Research methods data handling
Group 1
Group 2
(online)
(face-to-face)
Median
18
2
Range
5
10
1 3
What do the median and range values in Table 1 suggest?  Justify your answer.
[4 marks]
Extra space
June 2025 · Paper 2 · Q14 2 marks AO2=2 Research methods data handling
1 4
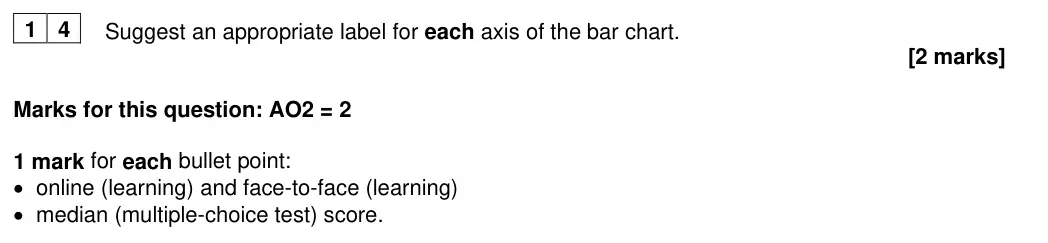
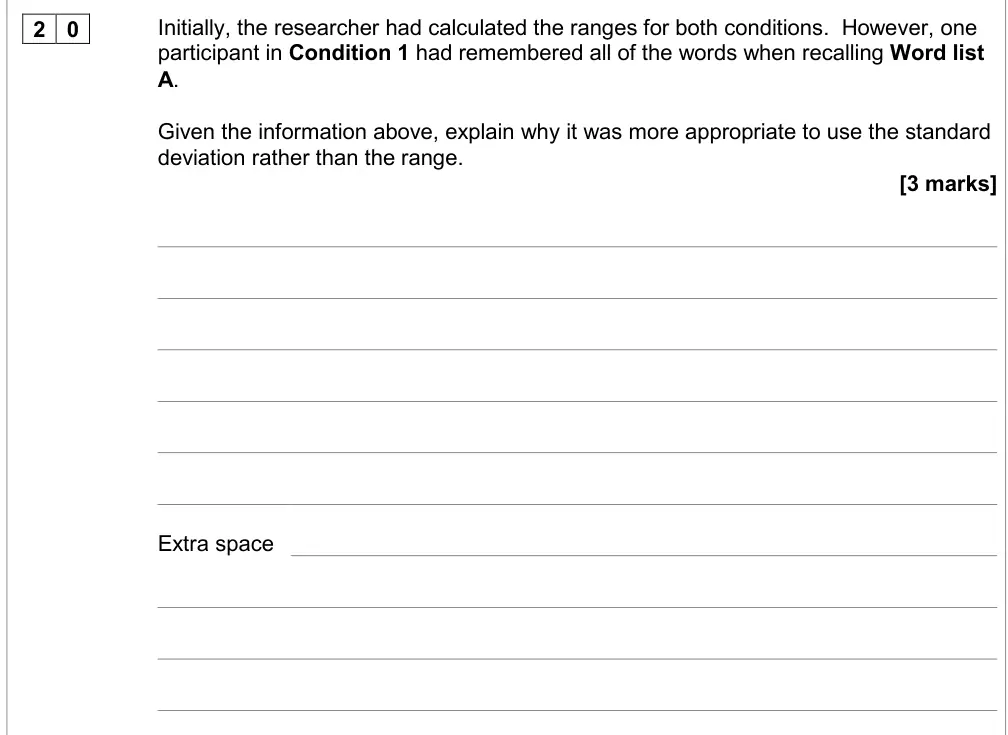
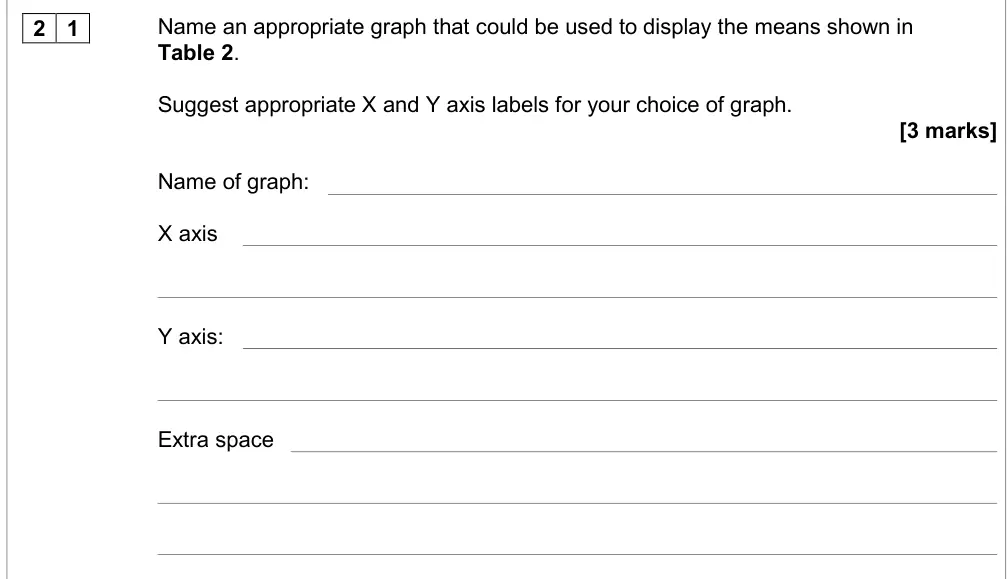
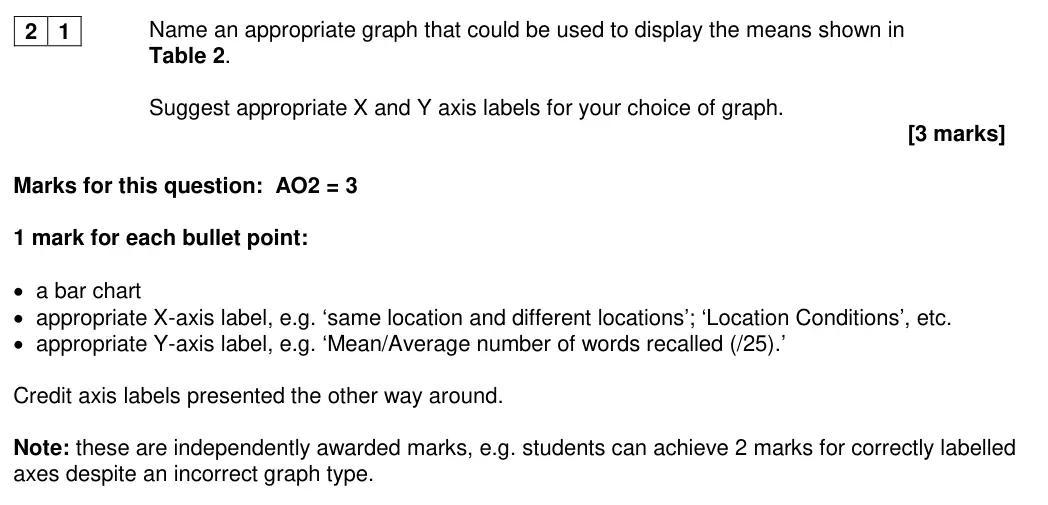
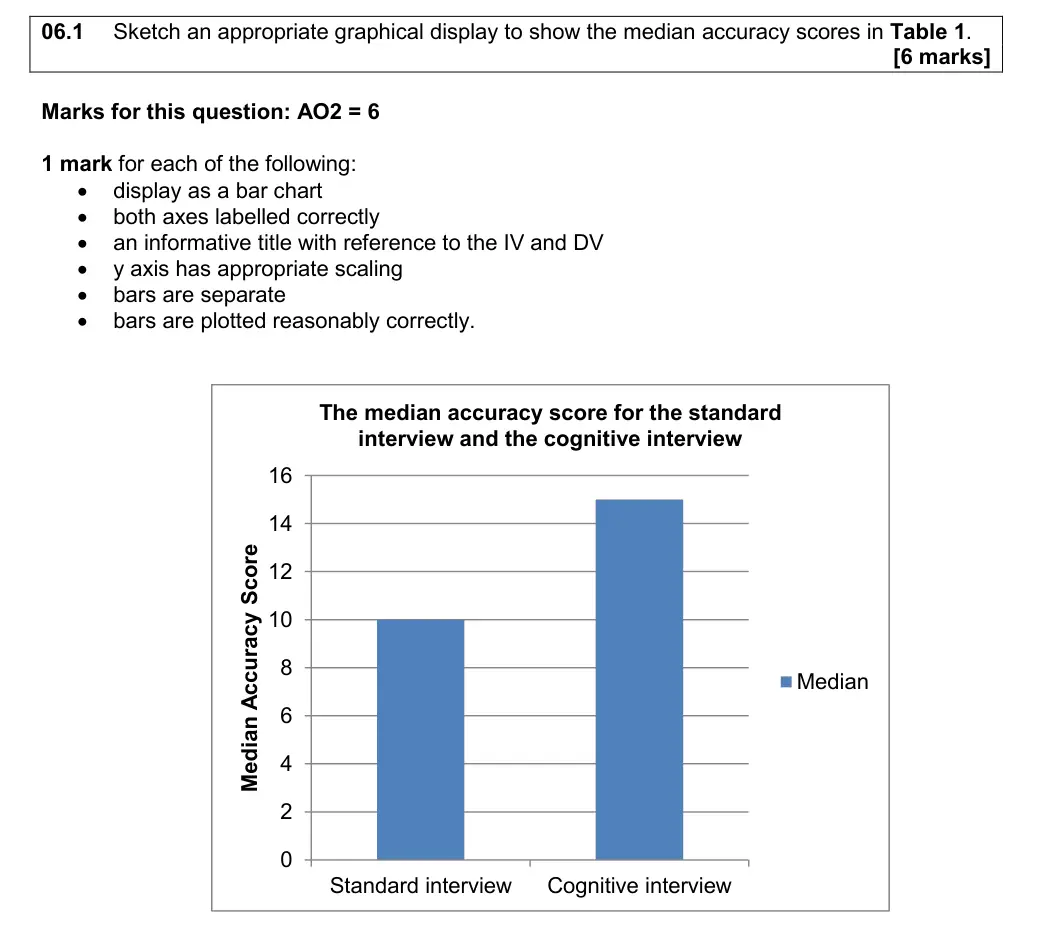
A bar chart could be used to display the measures of central tendency shown in Table 1.
Suggest an appropriate label for each axis of the bar chart.
[2 marks]
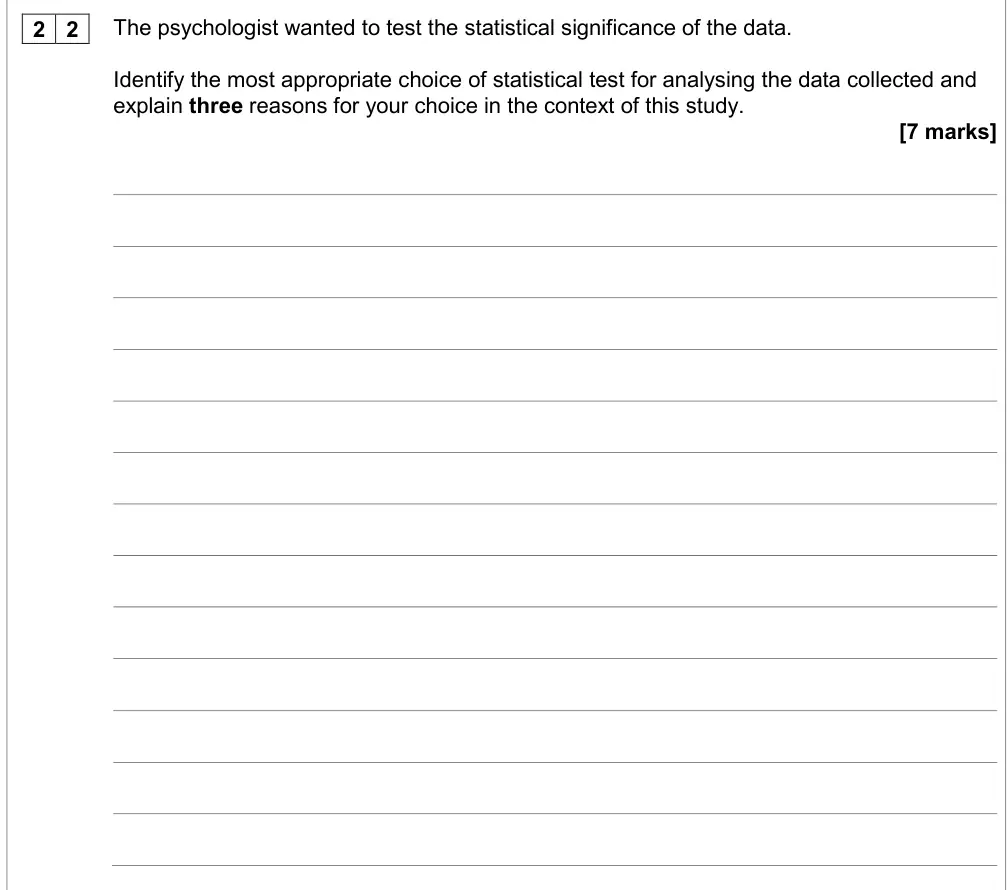
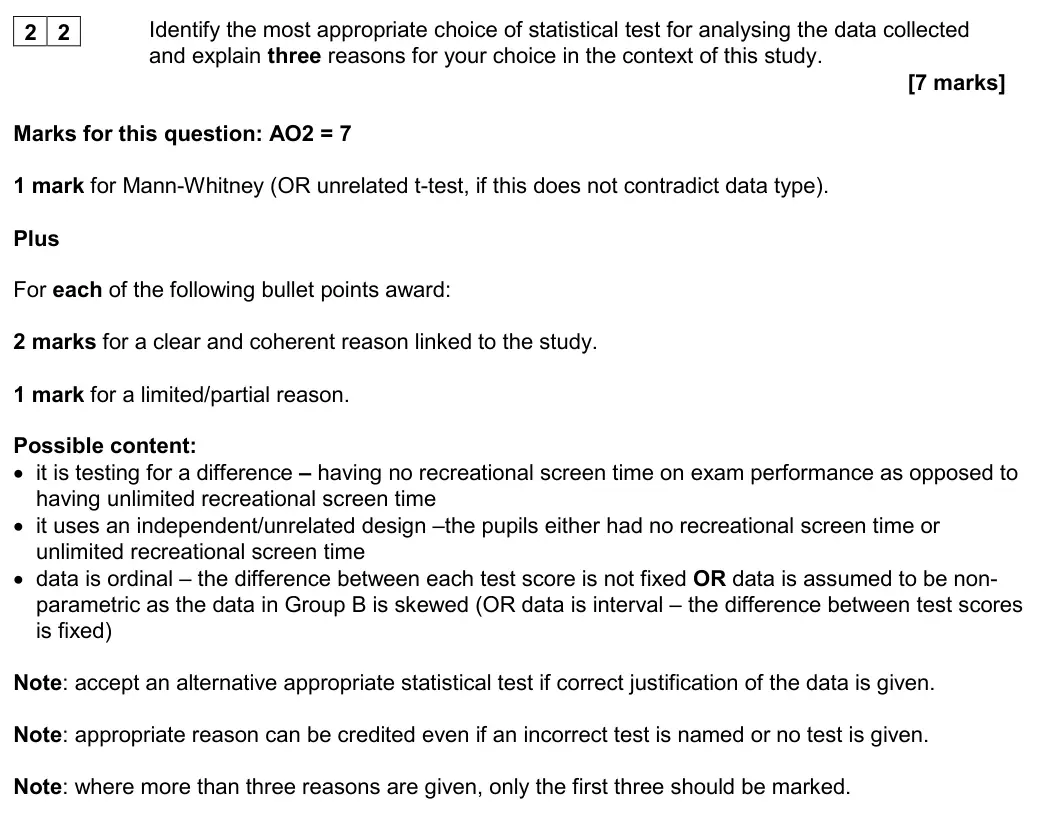
June 2025 · Paper 2 · Q15 7 marks AO2=7 Research methods inferential testingdata handling
1 5
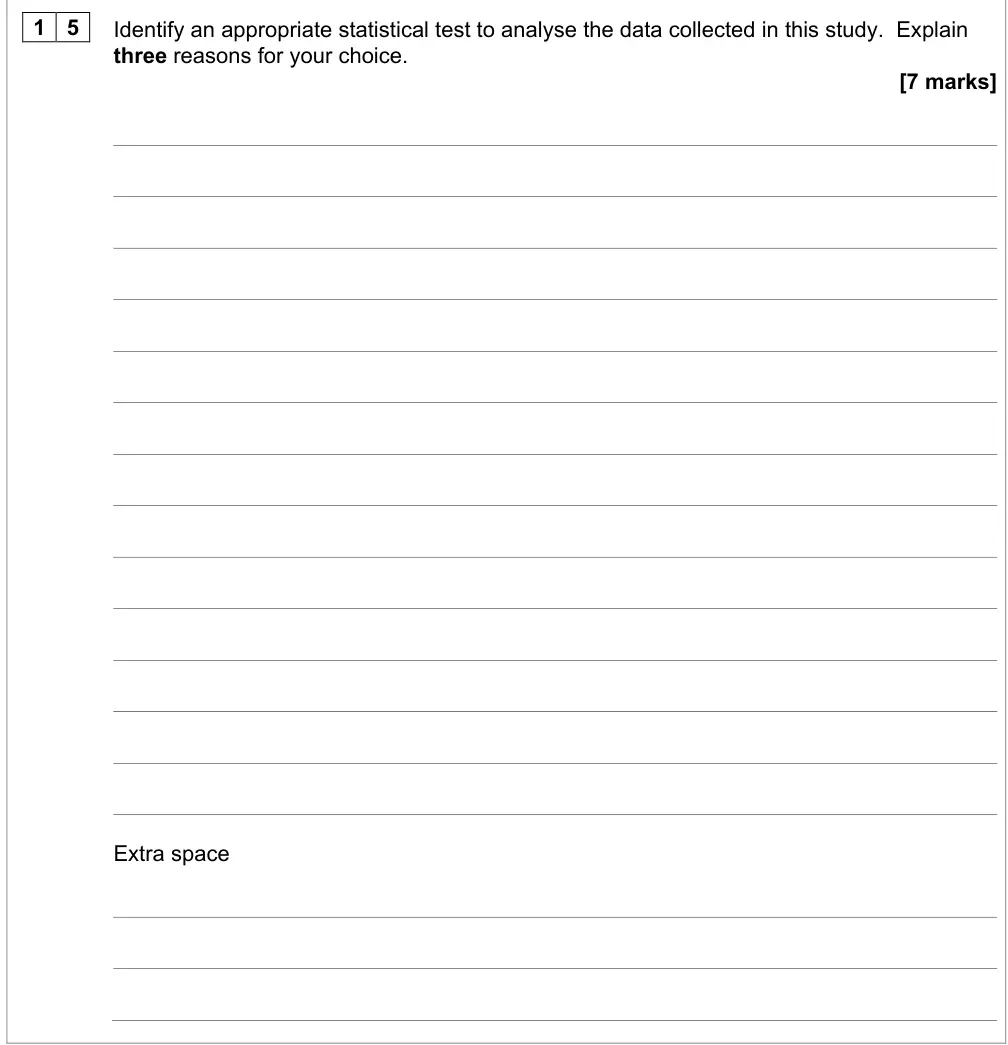
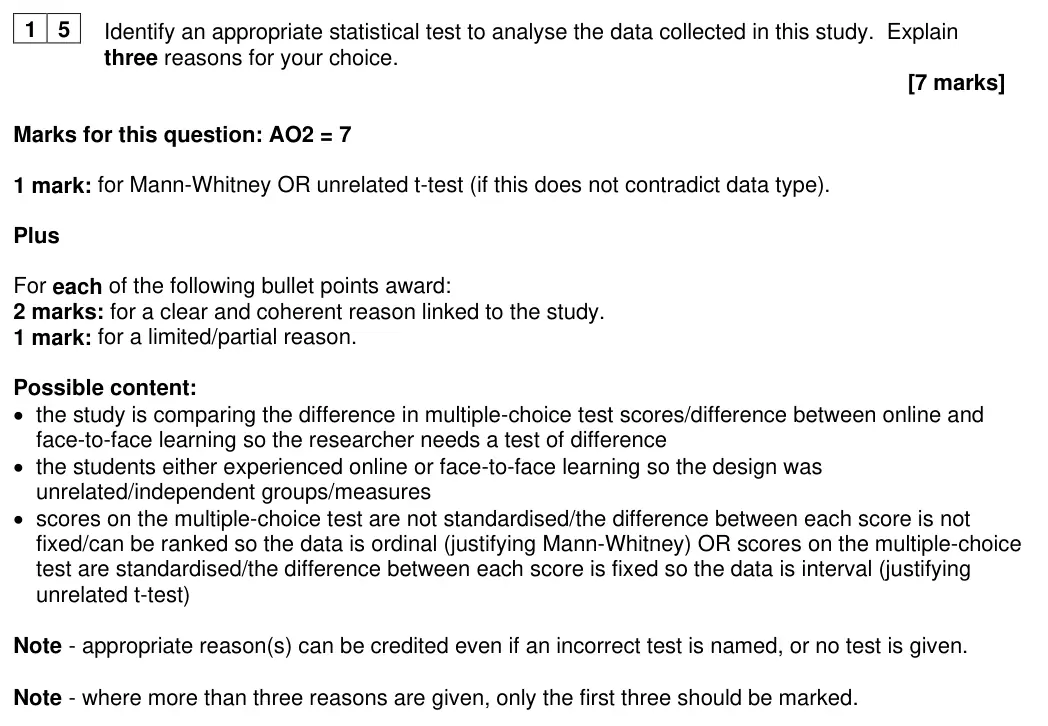
Identify an appropriate statistical test to analyse the data collected in this study.  Explain
three reasons for your choice.
[7 marks]
Extra space
June 2025 · Paper 2 · Q16 3 marks AO2=3 Research methods inferential testing
1 6
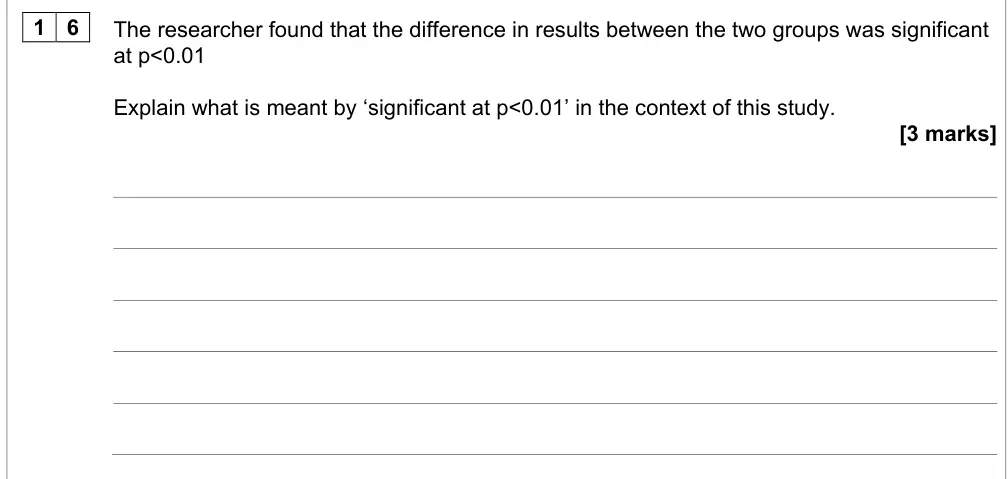
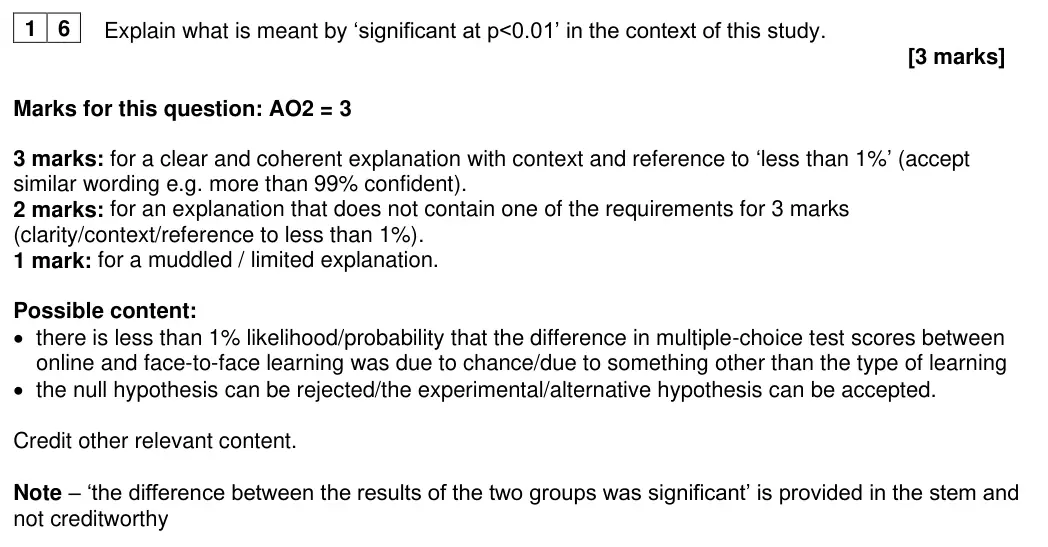
The researcher found that the difference in results between the two groups was significant
at p<0.01
Explain what is meant by ‘significant at p<0.01’ in the context of this study.
[3 marks]
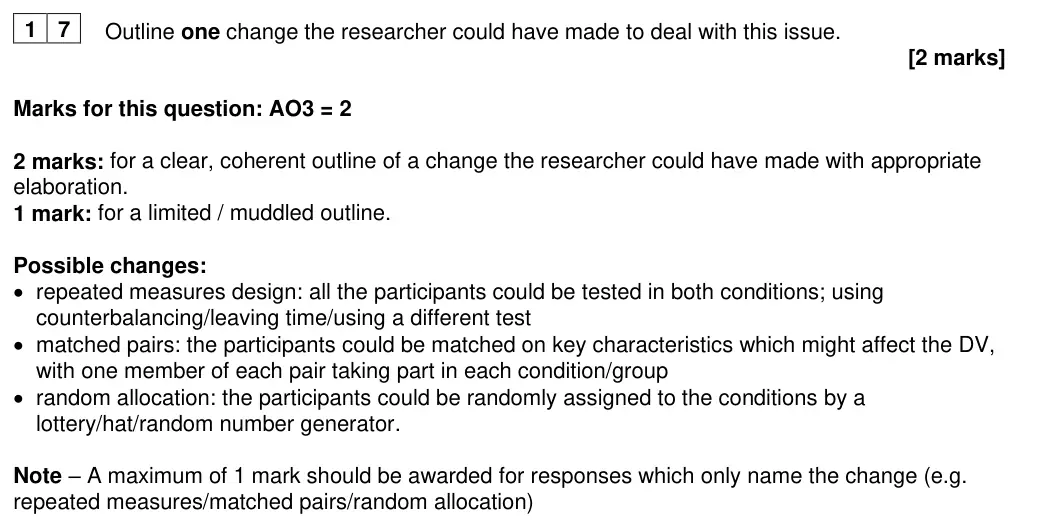
June 2025 · Paper 2 · Q17 2 marks AO3=2 Research methods Easy scientific processes
1 7
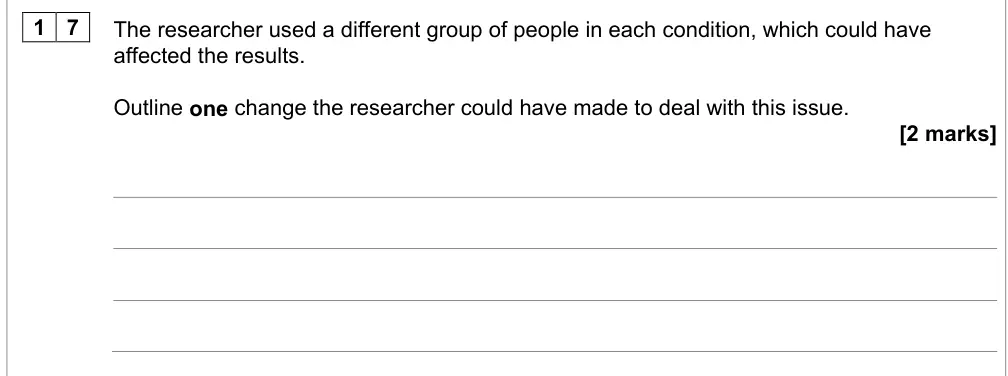
The researcher used a different group of people in each condition, which could have
affected the results.
Outline one change the researcher could have made to deal with this issue.
[2 marks]
June 2025 · Paper 2 · Q18 4 marks AO2=4 Research methods scientific processes
1 8
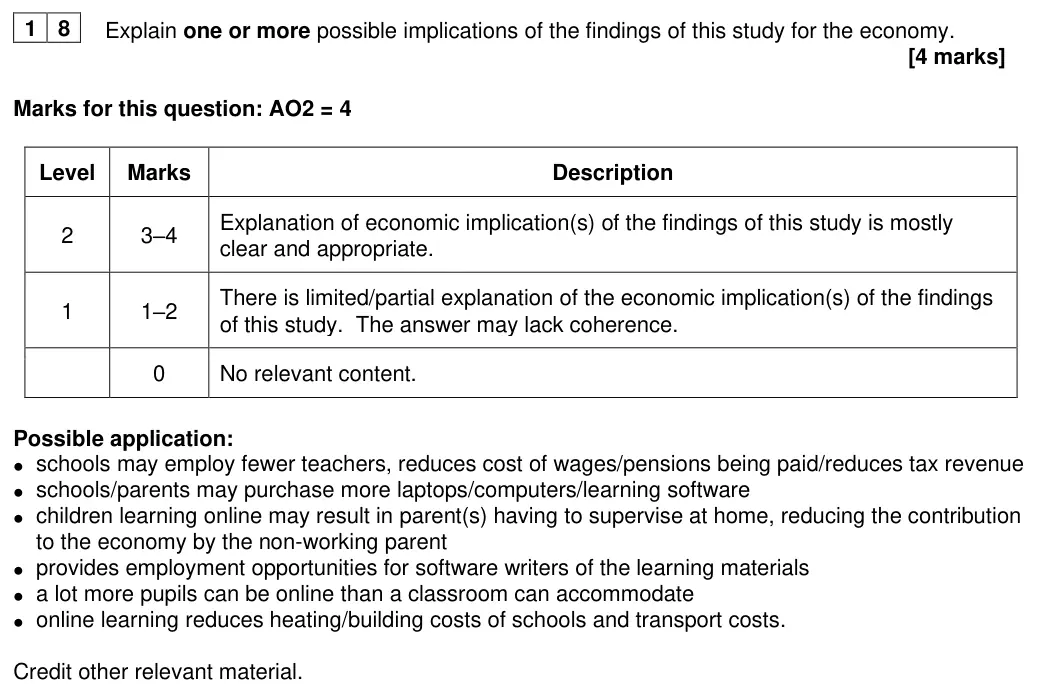
Explain one or more possible implications of the findings of this study for the economy.
[4 marks]
Extra space
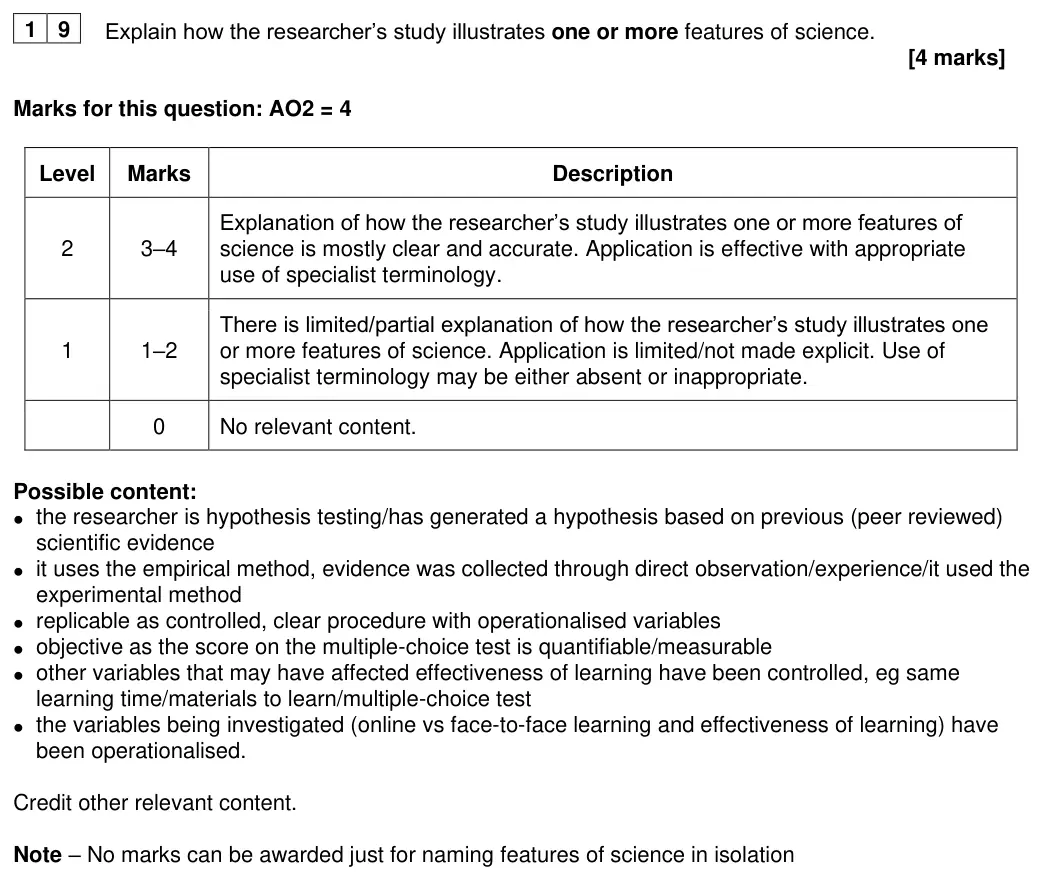
June 2025 · Paper 2 · Q19 4 marks AO2=4 Research methods scientific processes
1 9
Explain how the researcher’s study illustrates one or more features of science.
[4 marks]
Extra space
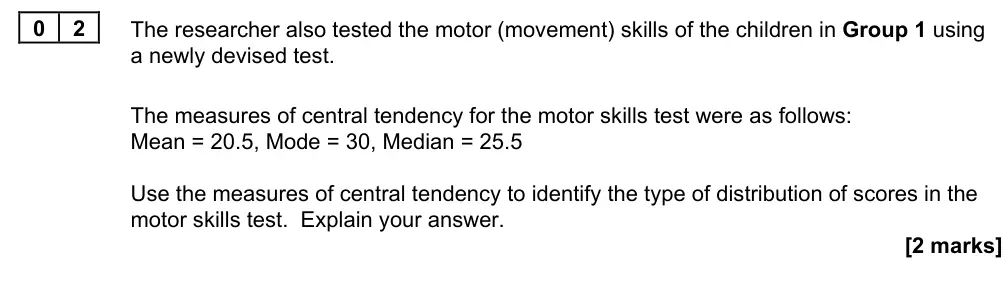
June 2025 · Paper 3 · Q2 2 marks AO2=2 Research methods data handling
0 2
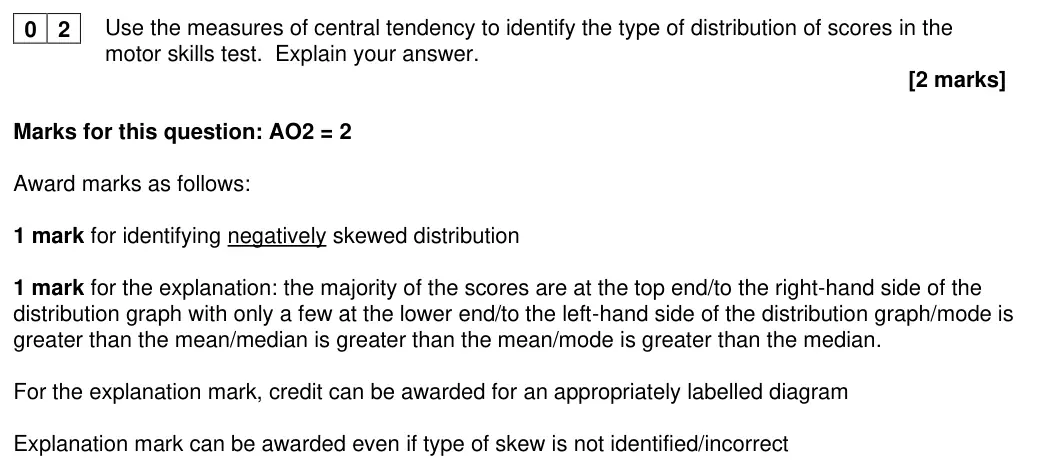
The researcher also tested the motor (movement) skills of the children in Group 1 using
a newly devised test.
The measures of central tendency for the motor skills test were as follows:
Mean = 20.5, Mode = 30, Median = 25.5
Use the measures of central tendency to identify the type of distribution of scores in the
motor skills test.  Explain your answer.
[2 marks]
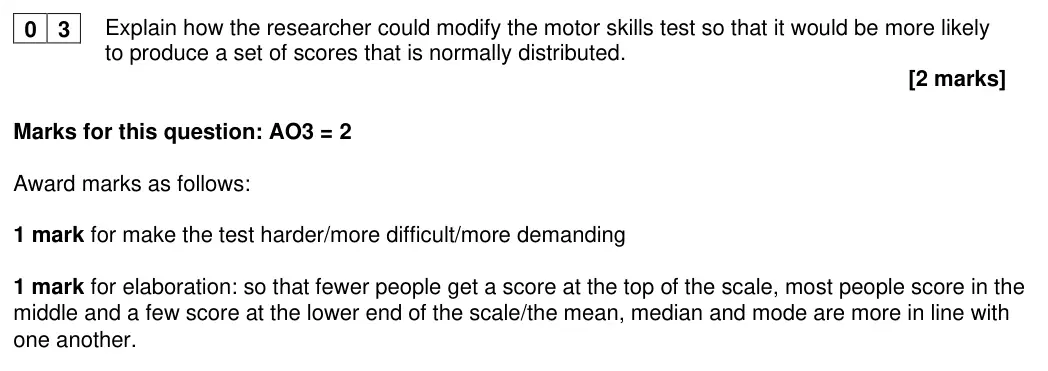
June 2025 · Paper 3 · Q3 2 marks AO3=2 Research methods data handling
0 3
Explain how the researcher could modify the motor skills test so that it would be more
likely to produce a set of scores that is normally distributed.
[2 marks]
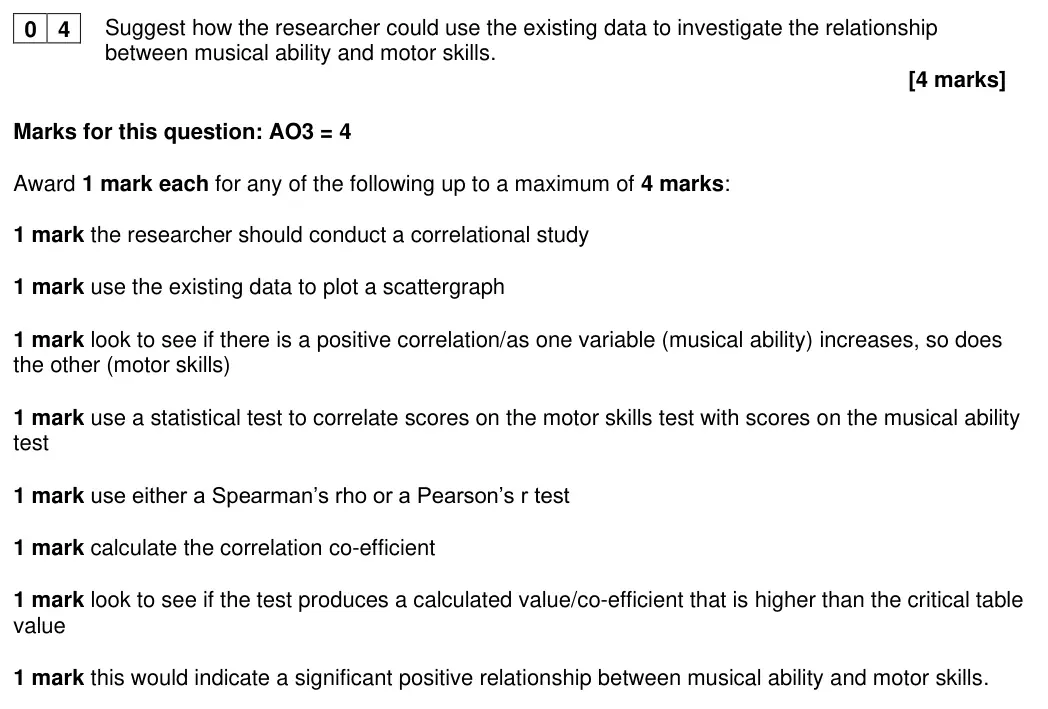
June 2025 · Paper 3 · Q4 4 marks AO3=4 Research methods research methodsdata handlinginferential testing
0 4
The researcher noticed that a lot of the children who did well on the musical ability test
also seemed to do well on the motor skills test.
Suggest how the researcher could use the existing data to investigate the relationship
between musical ability and motor skills.
[4 marks]
June 2024 · AS Paper 1 · Q4 2 marks AO3=2 Research methods scientific processes
0 4
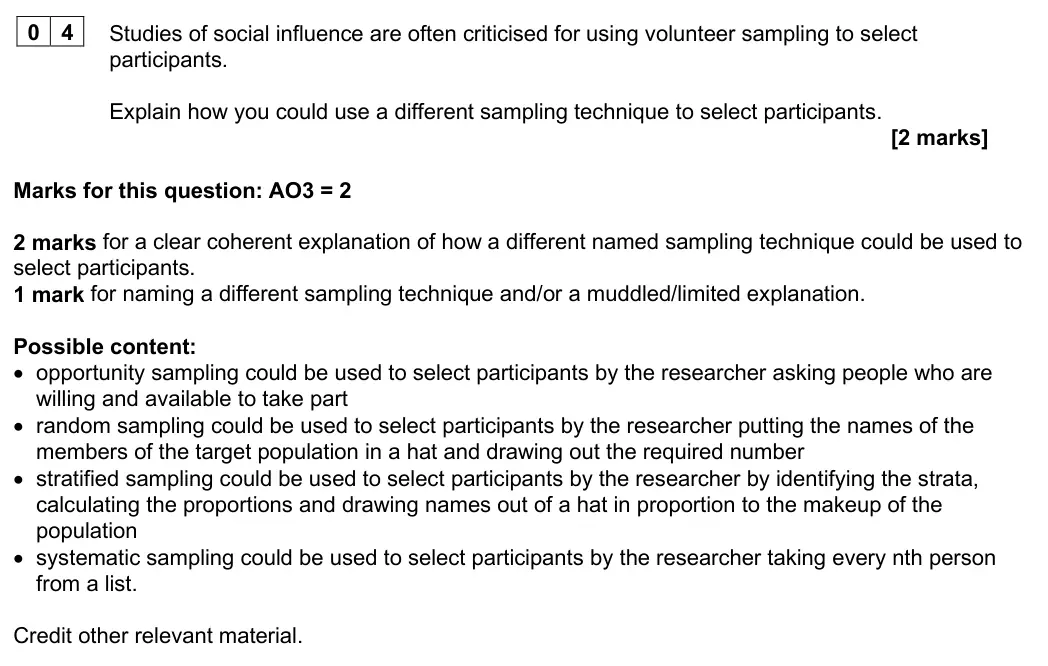
Studies of social influence are often criticised for using volunteer sampling to select
participants.
Explain how you could use a different sampling technique to select participants.
[2 marks]
June 2024 · AS Paper 1 · Q9 2 marks AO2=2 Research methods Medium memorydata handling
0 9
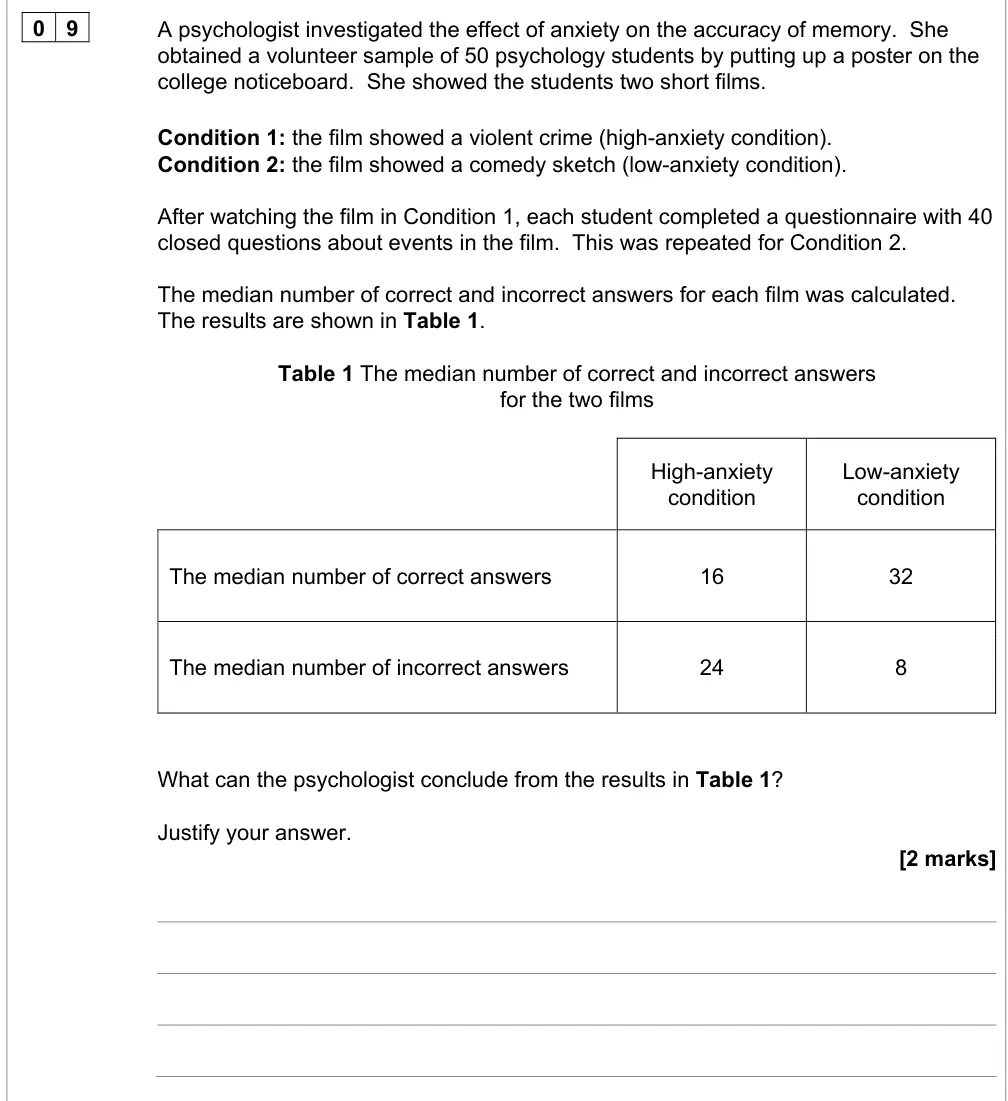
A psychologist investigated the effect of anxiety on the accuracy of memory.  She
obtained a volunteer sample of 50 psychology students by putting up a poster on the
college noticeboard.  She showed the students two short films.
Condition 1: the film showed a violent crime (high-anxiety condition).
Condition 2: the film showed a comedy sketch (low-anxiety condition).
After watching the film in Condition 1, each student completed a questionnaire with 40
closed questions about events in the film.  This was repeated for Condition 2.
The median number of correct and incorrect answers for each film was calculated.
The results are shown in Table 1.
Table 1 The median number of correct and incorrect answers
for the two films
High-anxiety
Low-anxiety
condition
condition
The median number of correct answers
16
32
The median number of incorrect answers
24
8
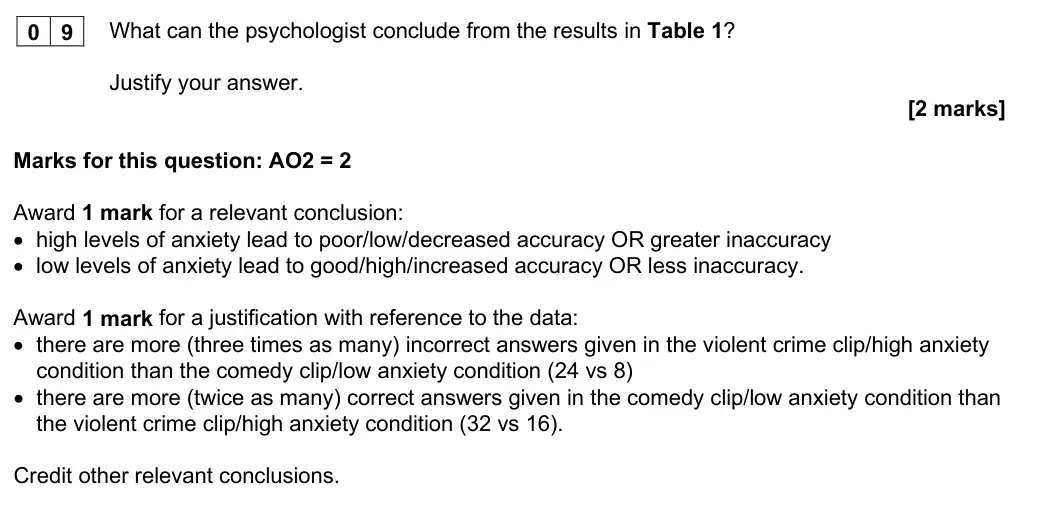
What can the psychologist conclude from the results in Table 1?
Justify your answer.
[2 marks]
June 2024 · AS Paper 1 · Q10 4 marks AO2=4 Research methods Medium scientific processes
1 0
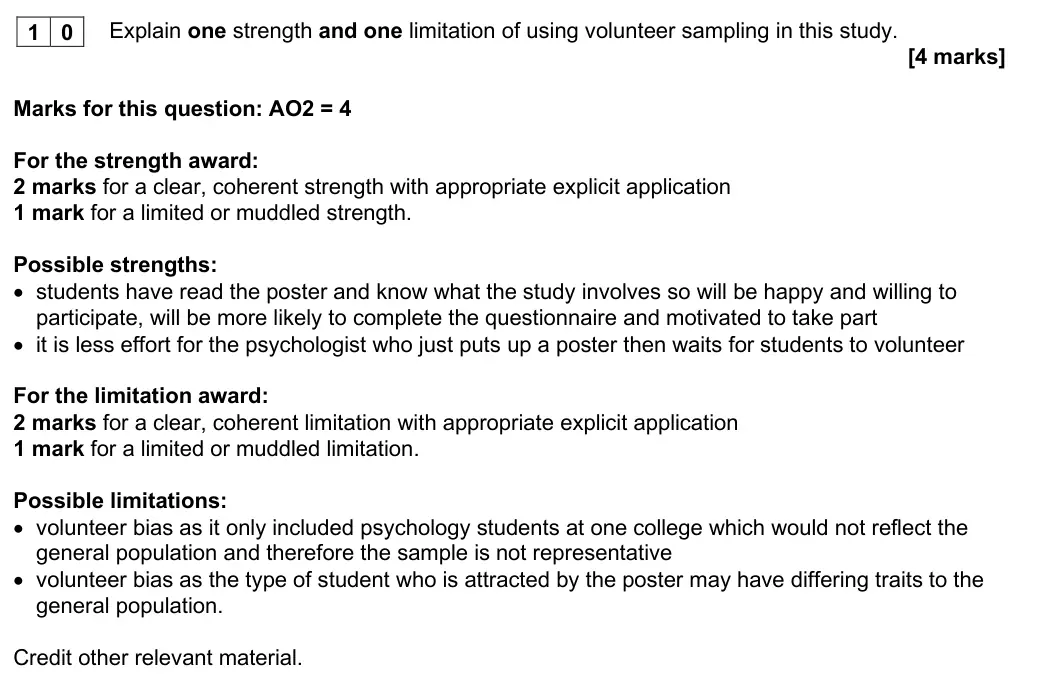
Explain one strength and one limitation of using volunteer sampling in this study.
[4 marks]
June 2024 · AS Paper 1 · Q11 2 marks AO2=2 Research methods Medium scientific processesdata handling
1 1
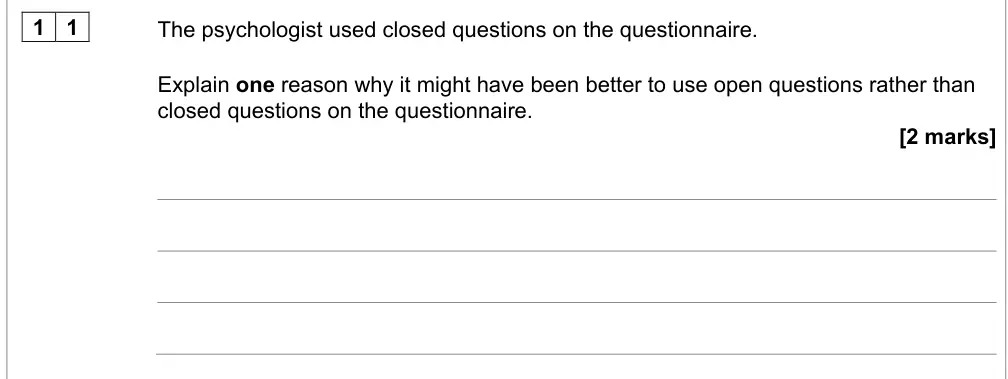
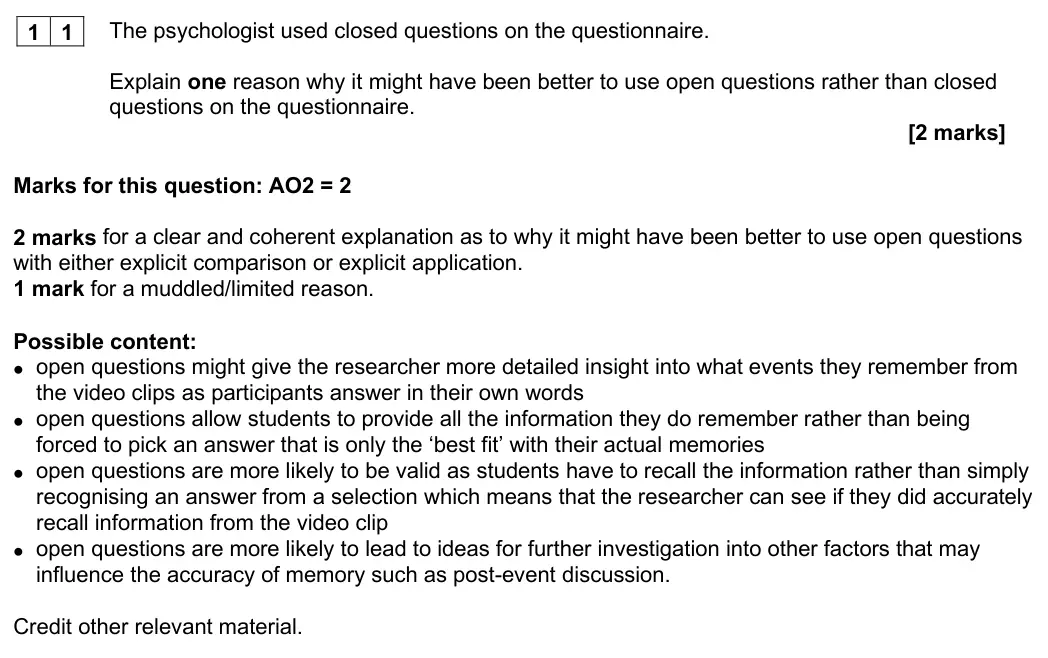
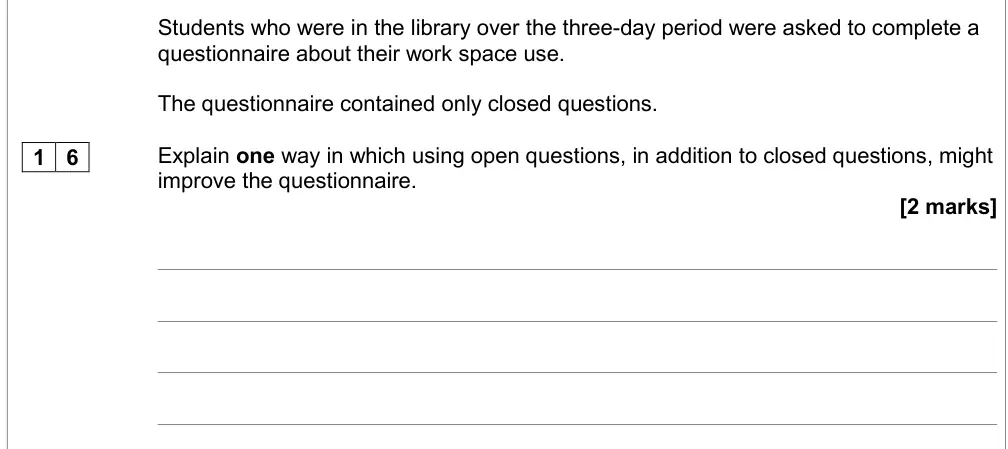
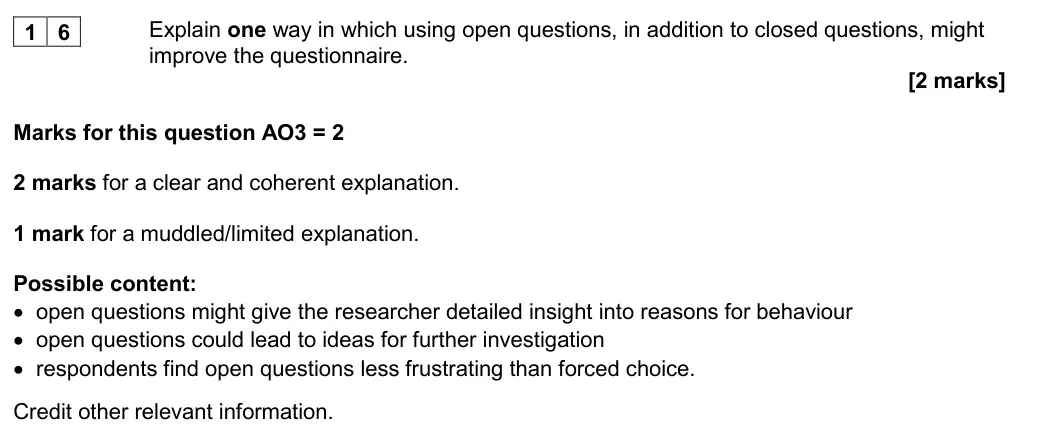
The psychologist used closed questions on the questionnaire.
Explain one reason why it might have been better to use open questions rather than
closed questions on the questionnaire.
[2 marks]
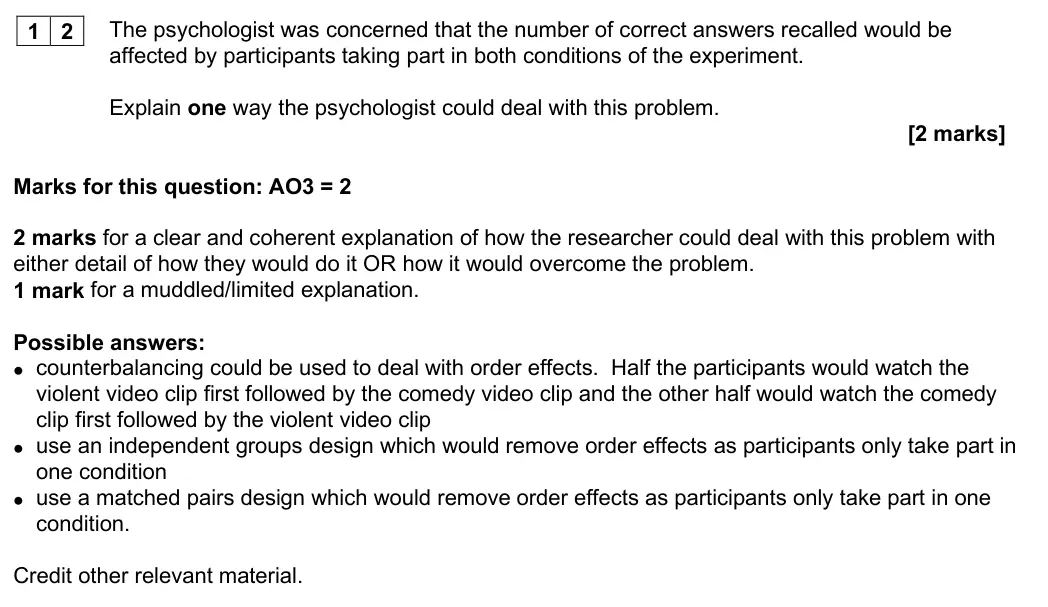
June 2024 · AS Paper 1 · Q12 2 marks AO3=2 Research methods Easy scientific processes
1 2
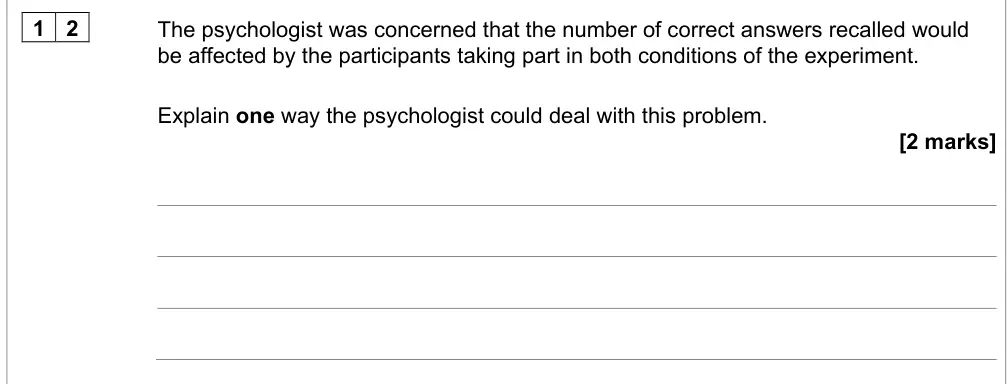
The psychologist was concerned that the number of correct answers recalled would
be affected by the participants taking part in both conditions of the experiment.
Explain one way the psychologist could deal with this problem.
[2 marks]
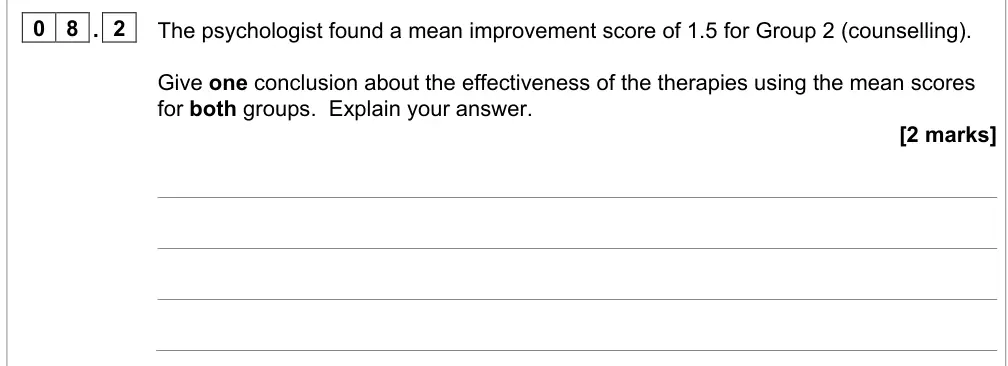
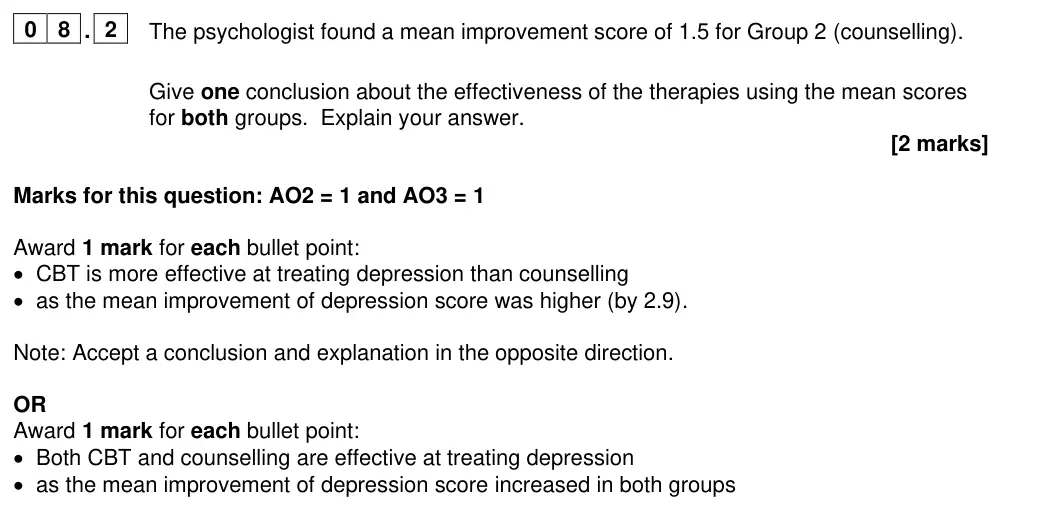
June 2024 · AS Paper 2 · Q8.2 2 marks AO2=1, AO3=1 Research methods Easy data handling
0 8 . 2
The psychologist found a mean improvement score of 1.5 for Group 2 (counselling).
Give one conclusion about the effectiveness of the therapies using the mean scores
for both groups.  Explain your answer.
[2 marks]
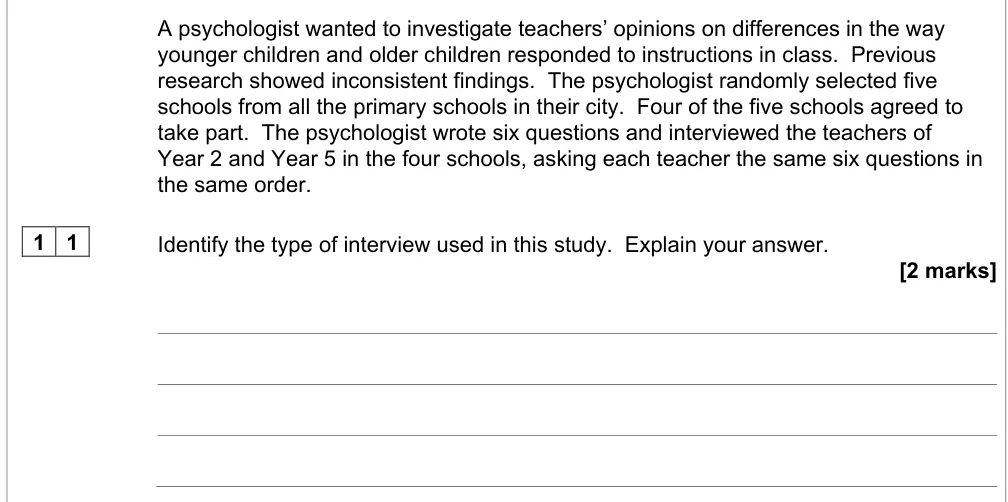
June 2024 · AS Paper 2 · Q11 2 marks AO2=2 Research methods research methods
A psychologist wanted to investigate teachers’ opinions on differences in the way
younger children and older children responded to instructions in class.  Previous
research showed inconsistent findings.  The psychologist randomly selected five
schools from all the primary schools in their city.  Four of the five schools agreed to
take part.  The psychologist wrote six questions and interviewed the teachers of
Year 2 and Year 5 in the four schools, asking each teacher the same six questions in
the same order.
1 1
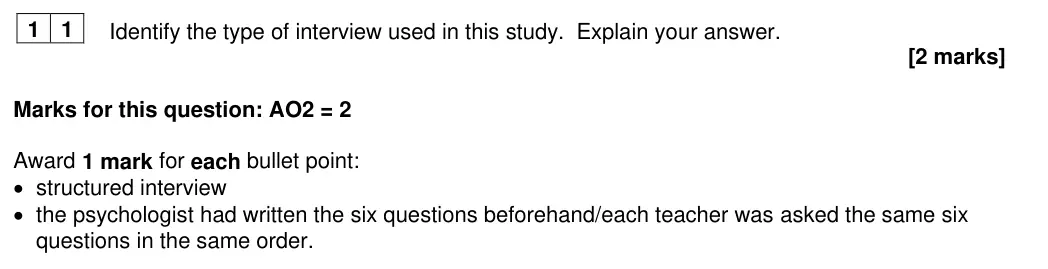
Identify the type of interview used in this study.  Explain your answer.
[2 marks]
June 2024 · AS Paper 2 · Q12 3 marks AO2=3 Research methods Medium scientific processes
1 2
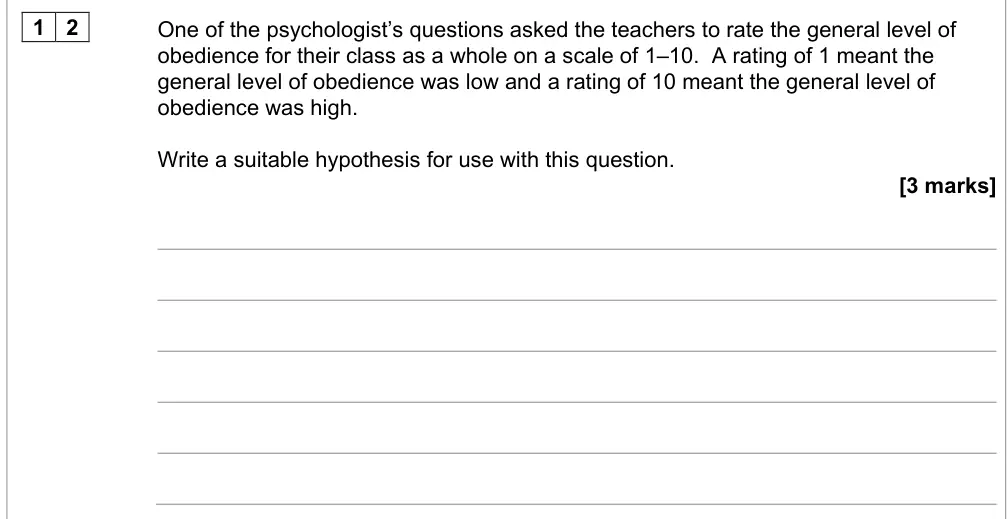
One of the psychologist’s questions asked the teachers to rate the general level of
obedience for their class as a whole on a scale of 1–10.  A rating of 1 meant the
general level of obedience was low and a rating of 10 meant the general level of
obedience was high.
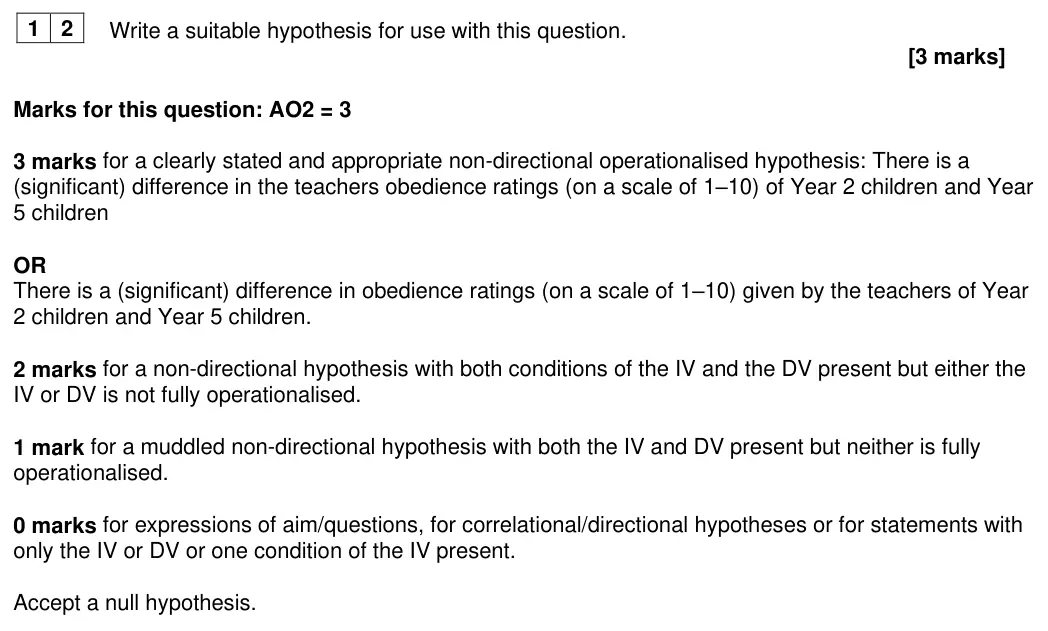
Write a suitable hypothesis for use with this question.
[3 marks]
June 2024 · AS Paper 2 · Q13 1 mark AO2=1 Research methods scientific processes
1 3
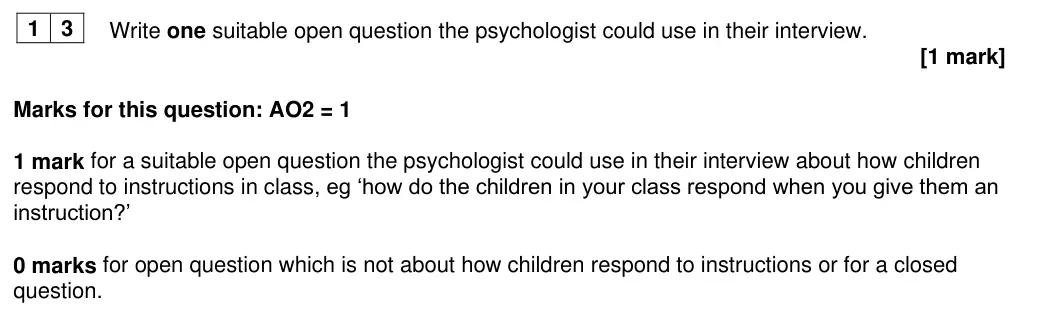
Write one suitable open question the psychologist could use in their interview.
[1 mark]
June 2024 · AS Paper 2 · Q14 2 marks AO2=2 Research methods Hard scientific processes
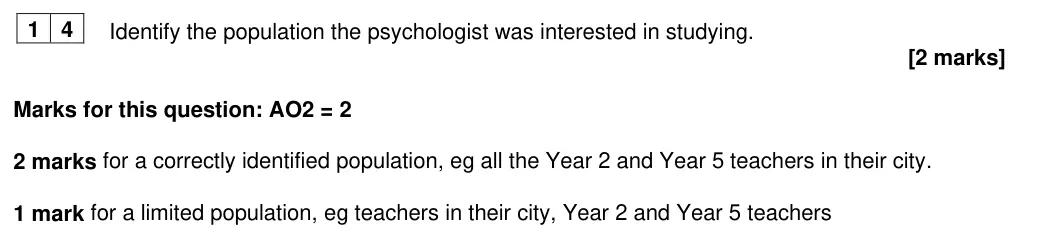
1 4
Identify the population the psychologist was interested in studying.
[2 marks]
June 2024 · AS Paper 2 · Q15 1 mark AO2=1 Research methods scientific processes
1 5
Identify the sample used by the psychologist in the study.
[1 mark]
June 2024 · AS Paper 2 · Q16 2 marks AO2=2 Research methods scientific processes
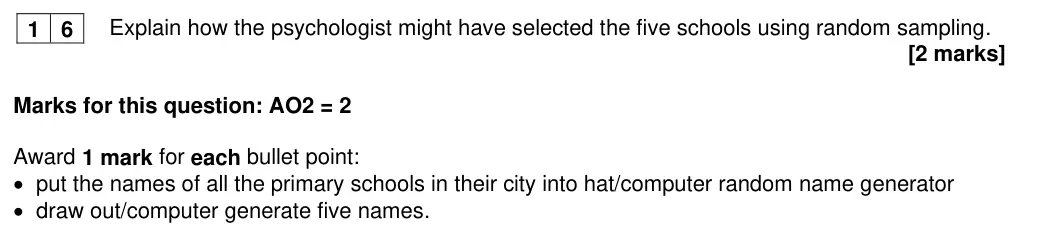
1 6
Explain how the psychologist might have selected the five schools using random
sampling.
[2 marks]
June 2024 · AS Paper 2 · Q17 3 marks AO2=3 Research methods scientific processes
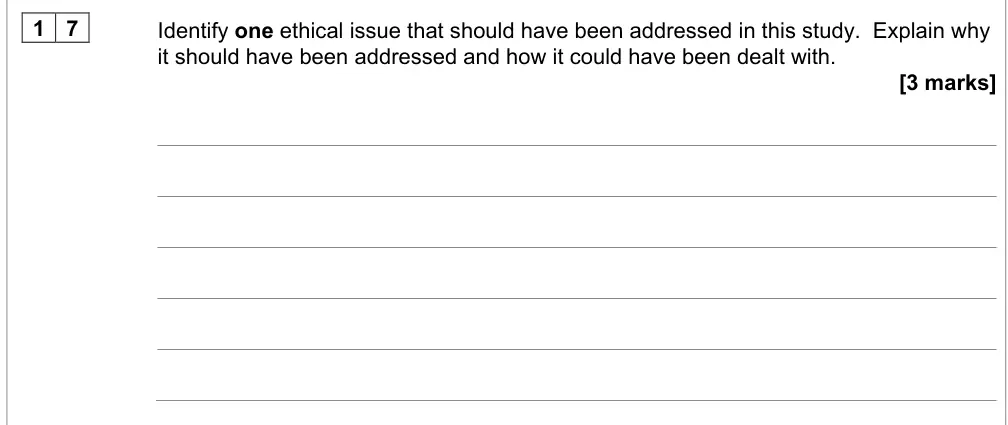
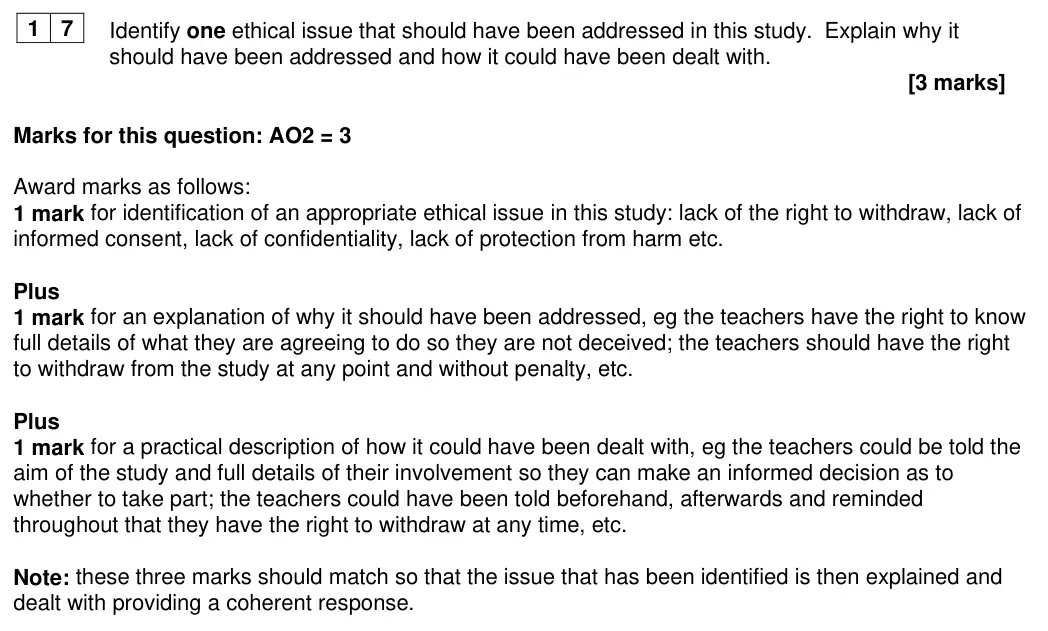
1 7
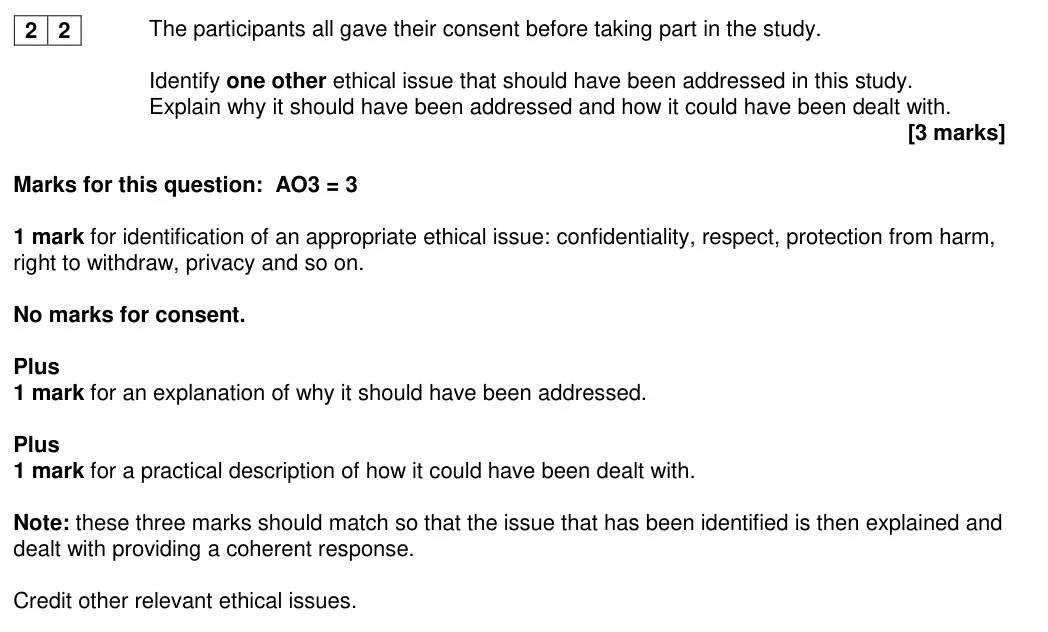
Identify one ethical issue that should have been addressed in this study.  Explain why
it should have been addressed and how it could have been dealt with.
[3 marks]
June 2024 · AS Paper 2 · Q18.2 2 marks AO2=2 Research methods data handling
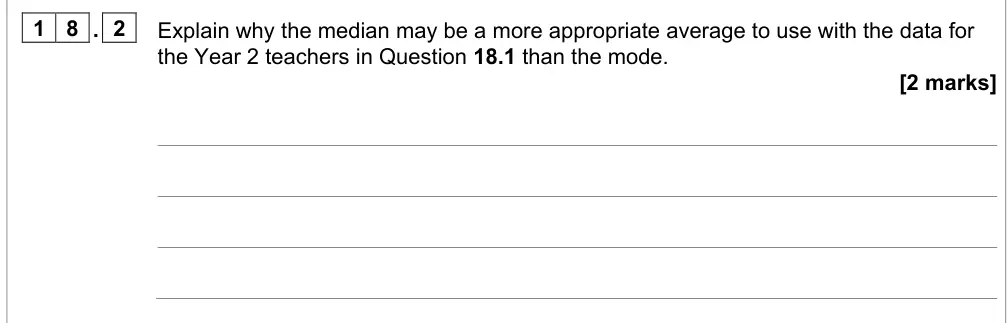
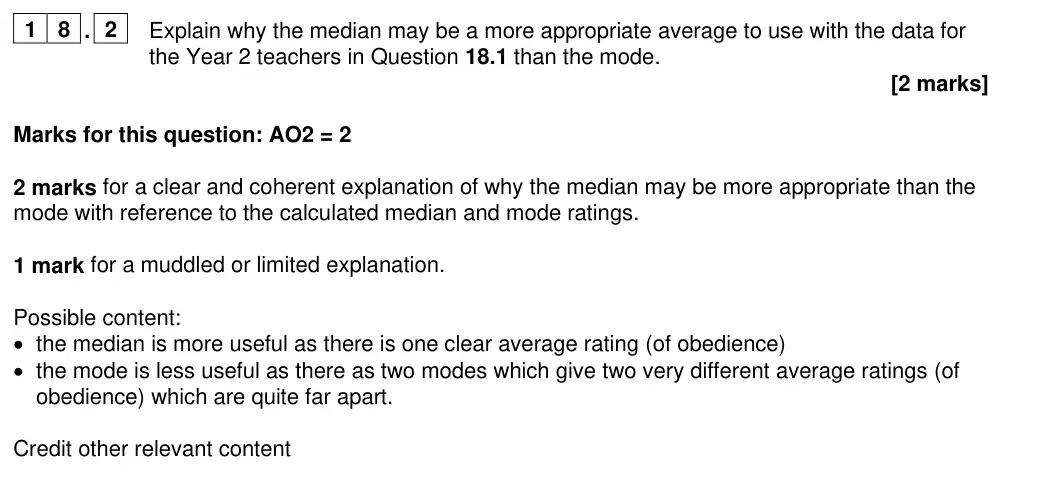
1 8 . 2
Explain why the median may be a more appropriate average to use with the data for
the Year 2 teachers in Question 18.1 than the mode.
[2 marks]
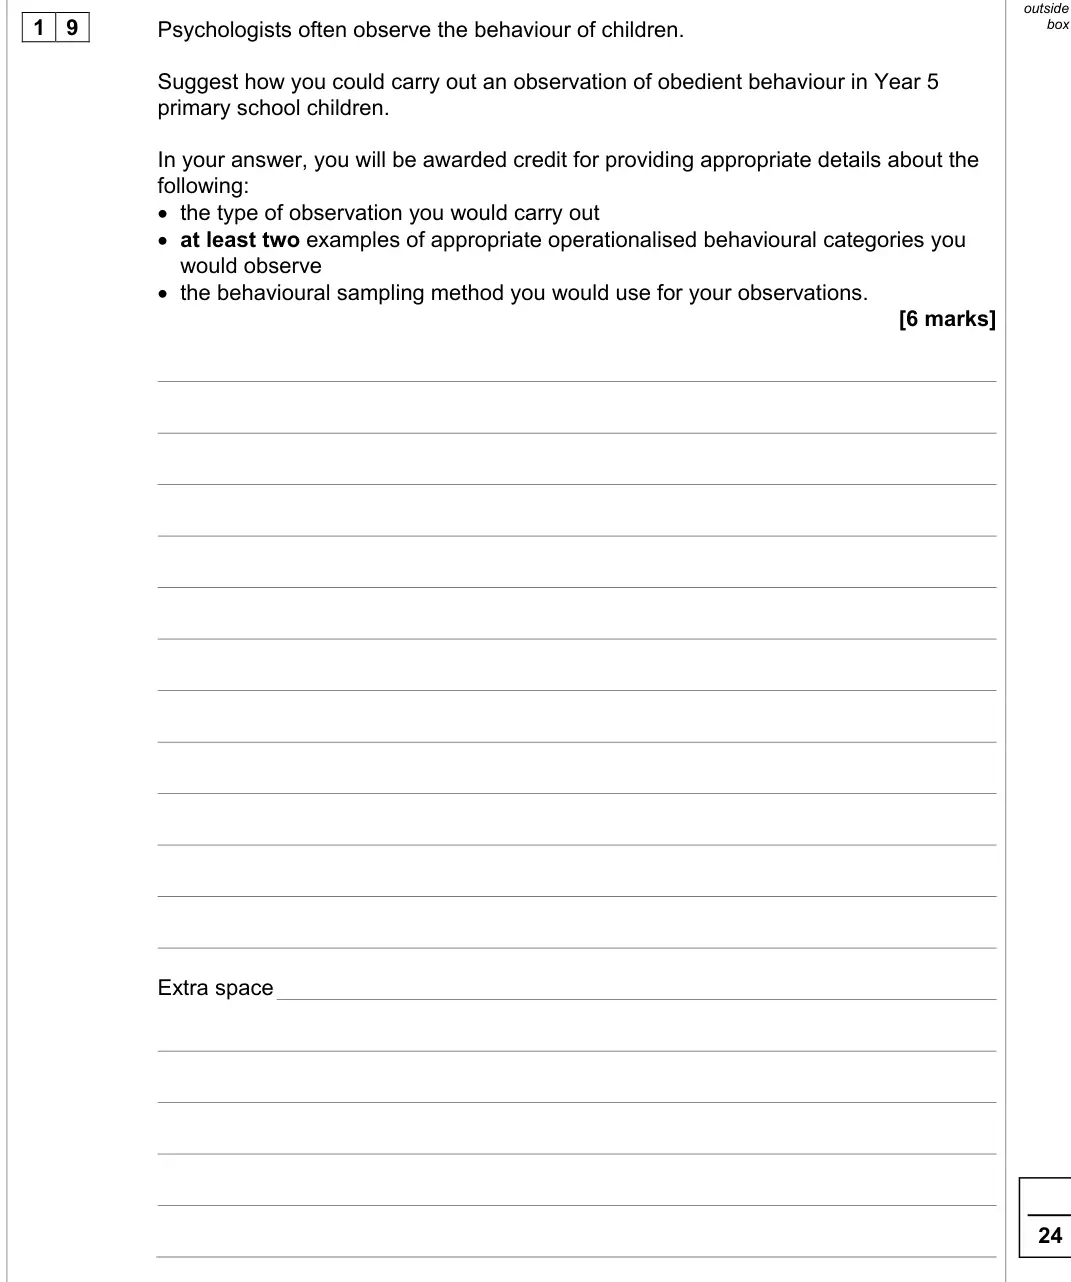
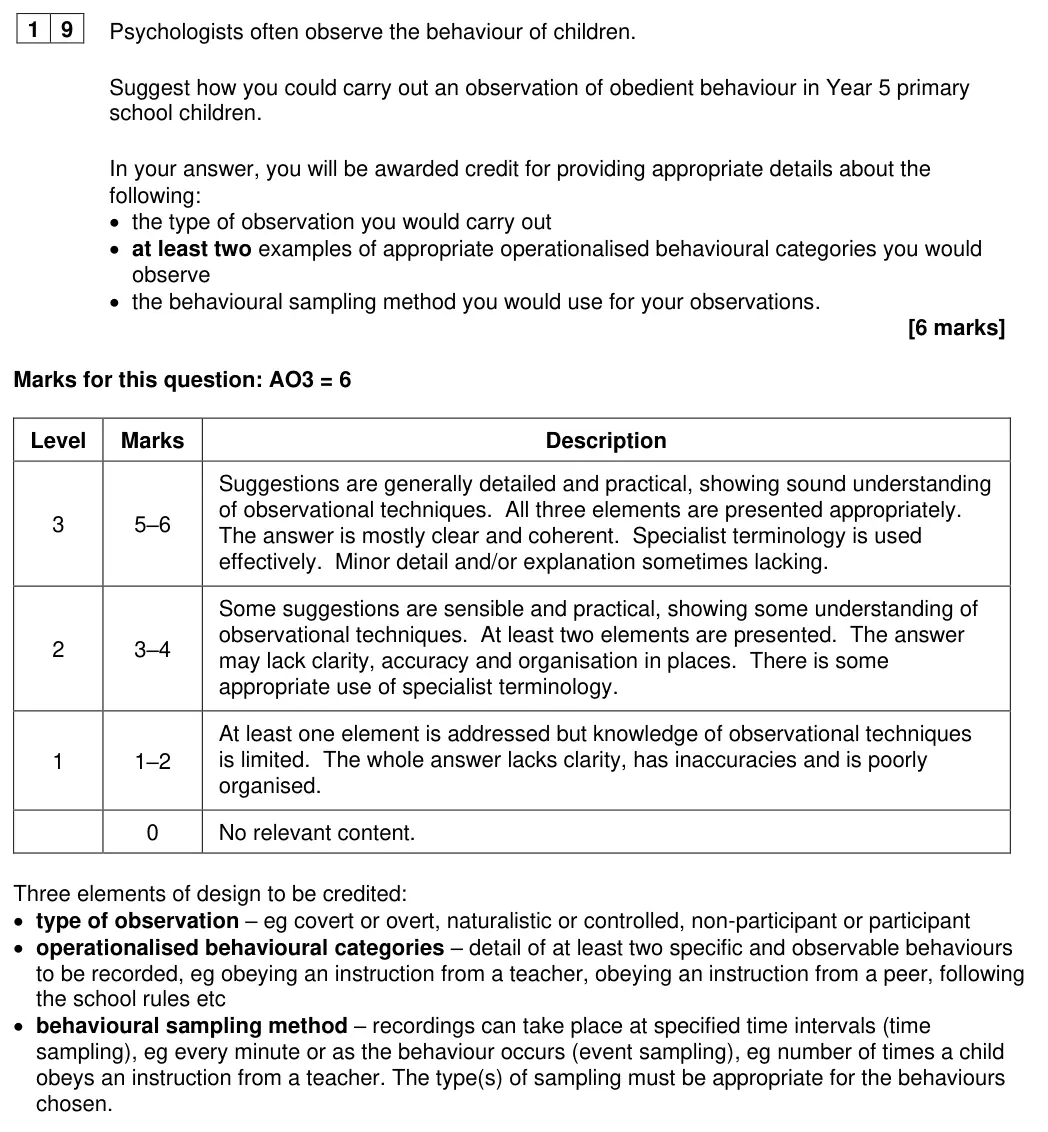
June 2024 · AS Paper 2 · Q19 6 marks AO3=6 Research methods Medium research methodsscientific processes
1 9
Psychologists often observe the behaviour of children.
Suggest how you could carry out an observation of obedient behaviour in Year 5
primary school children.
In your answer, you will be awarded credit for providing appropriate details about the
following:
• the type of observation you would carry out
• at least two examples of appropriate operationalised behavioural categories you
would observe
• the behavioural sampling method you would use for your observations.
[6 marks]
Extra space
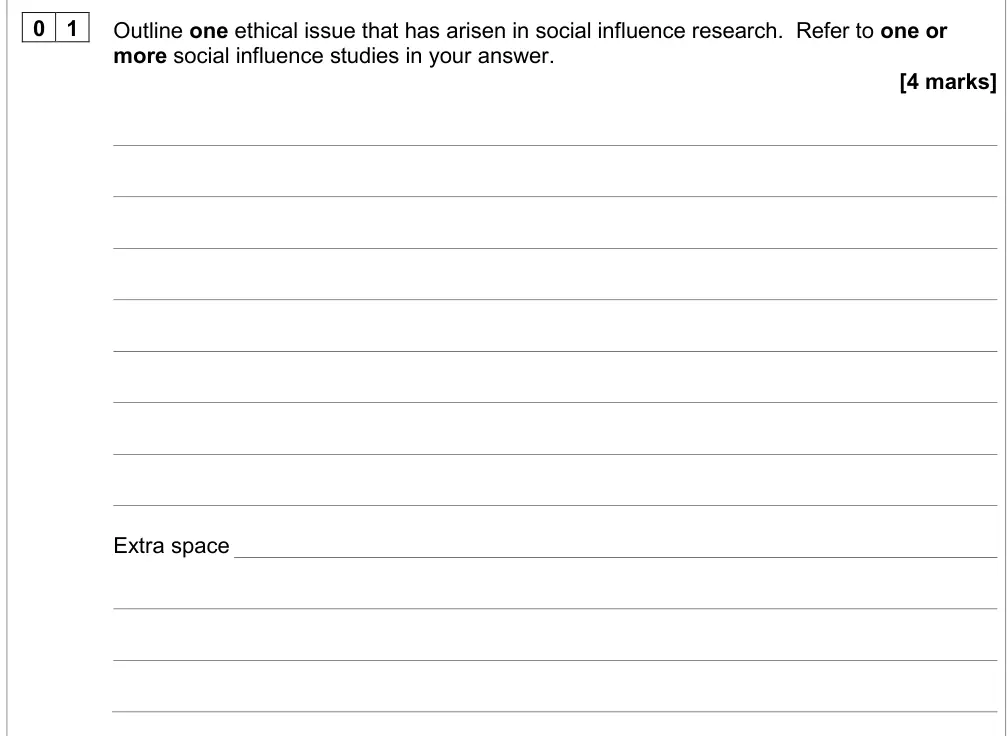
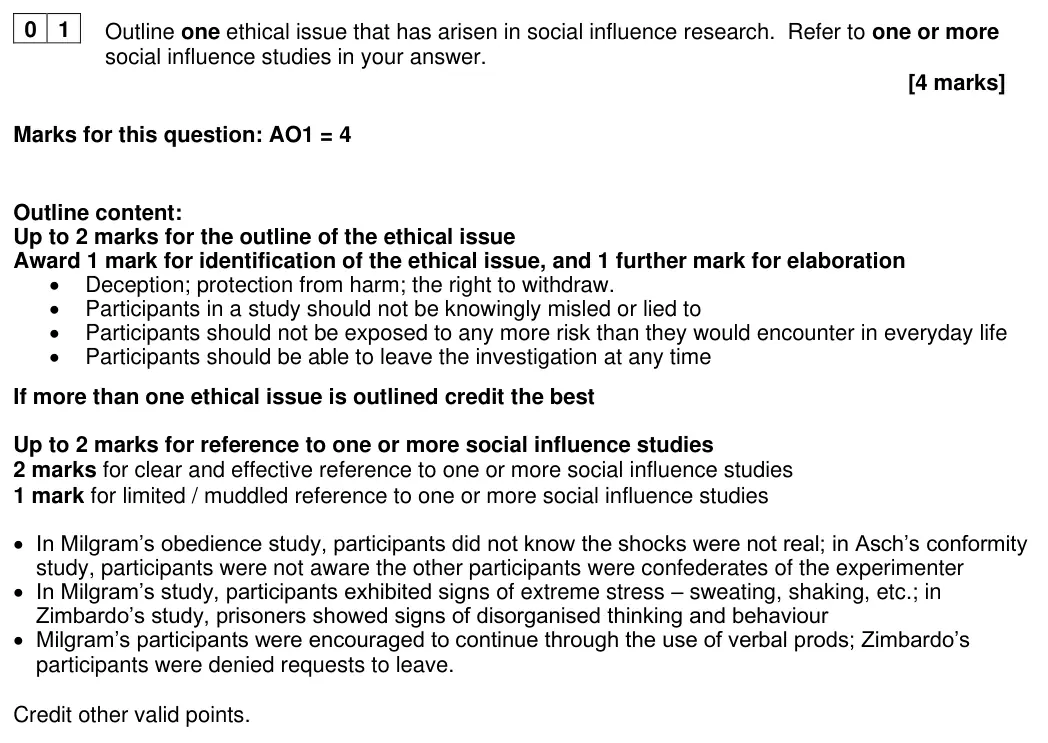
June 2024 · Paper 1 · Q1 4 marks AO1=4 Research methods Easy scientific processes
0 1
Outline one ethical issue that has arisen in social influence research.  Refer to one or
more social influence studies in your answer.
[4 marks]
Extra space
June 2024 · Paper 1 · Q5 3 marks AO3=3 Research methods inferential testing
0 5
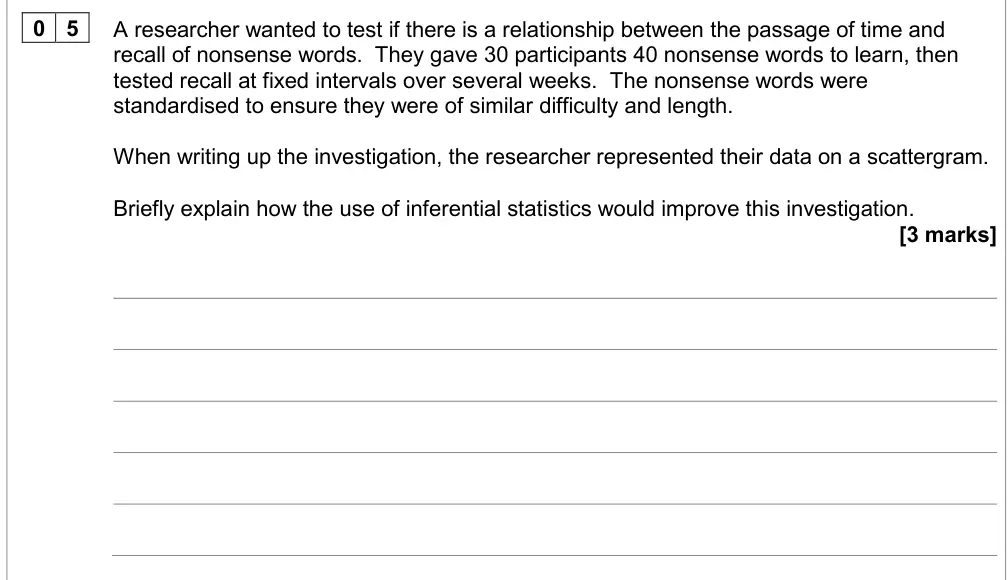
A researcher wanted to test if there is a relationship between the passage of time and
recall of nonsense words.  They gave 30 participants 40 nonsense words to learn, then
tested recall at fixed intervals over several weeks.  The nonsense words were
standardised to ensure they were of similar difficulty and length.
When writing up the investigation, the researcher represented their data on a scattergram.
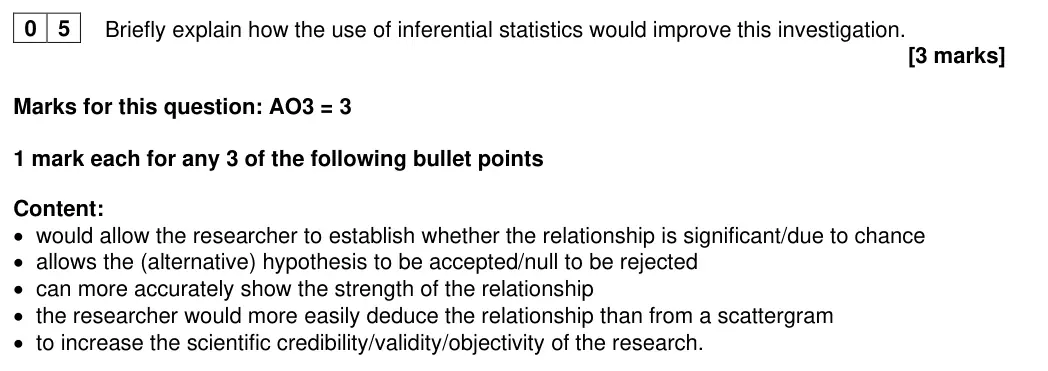
Briefly explain how the use of inferential statistics would improve this investigation.
[3 marks]
June 2024 · Paper 1 · Q6 5 marks AO3=5 Research methods Medium inferential testingdata handling
0 6
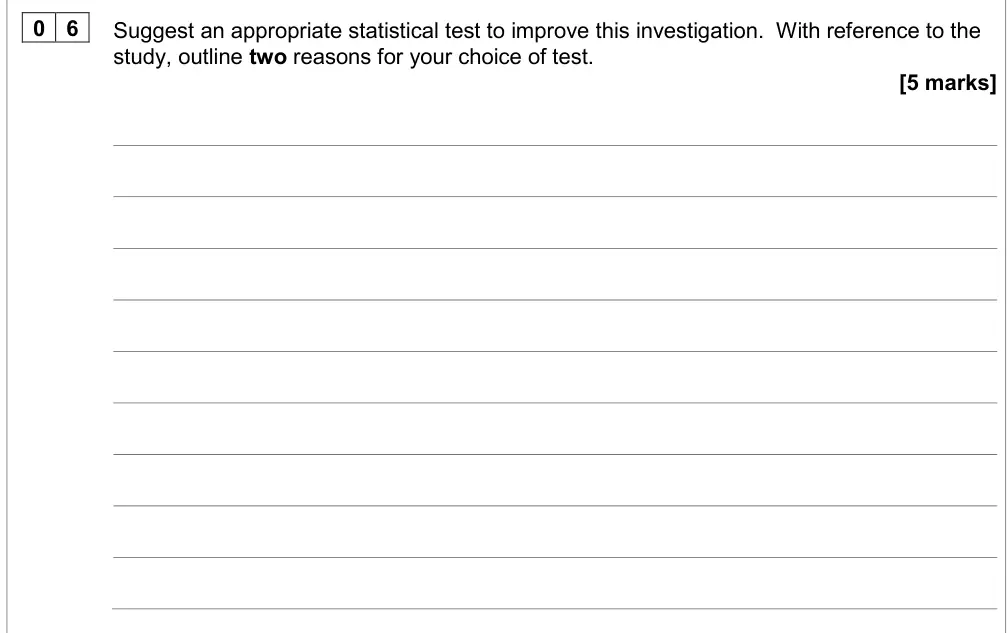
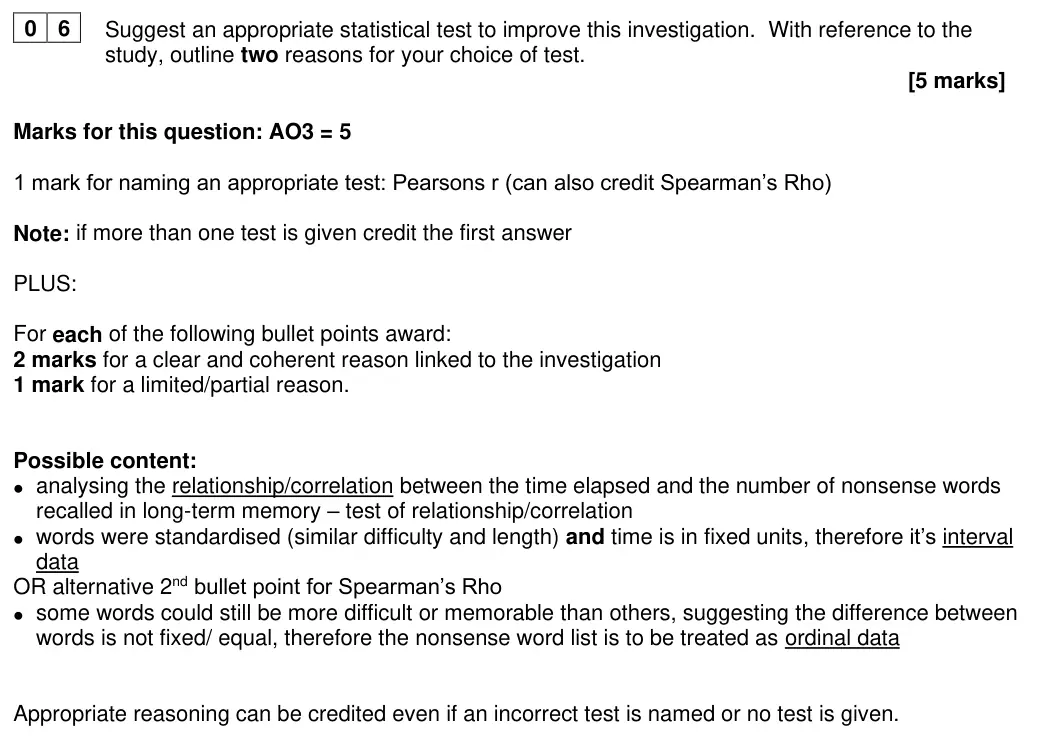
Suggest an appropriate statistical test to improve this investigation.  With reference to the
study, outline two reasons for your choice of test.
[5 marks]
June 2024 · Paper 2 · Q9 2 marks AO2=2 Research methods scientific processes
0 9
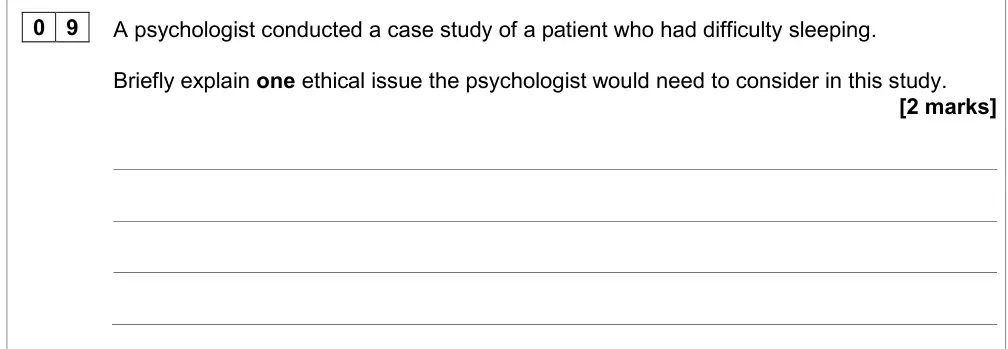
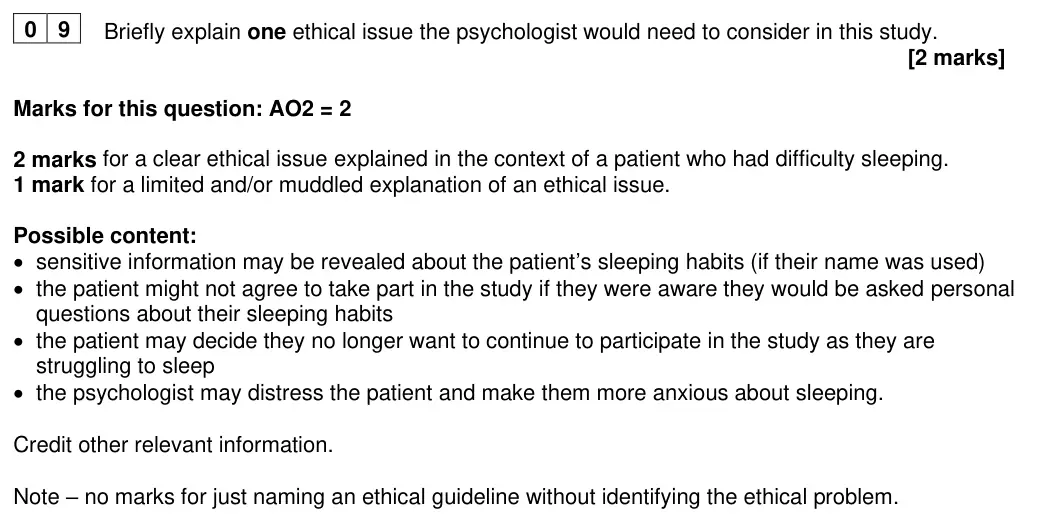
A psychologist conducted a case study of a patient who had difficulty sleeping.
Briefly explain one ethical issue the psychologist would need to consider in this study.
[2 marks]
June 2024 · Paper 2 · Q11 2 marks AO2=2 Research methods data handling
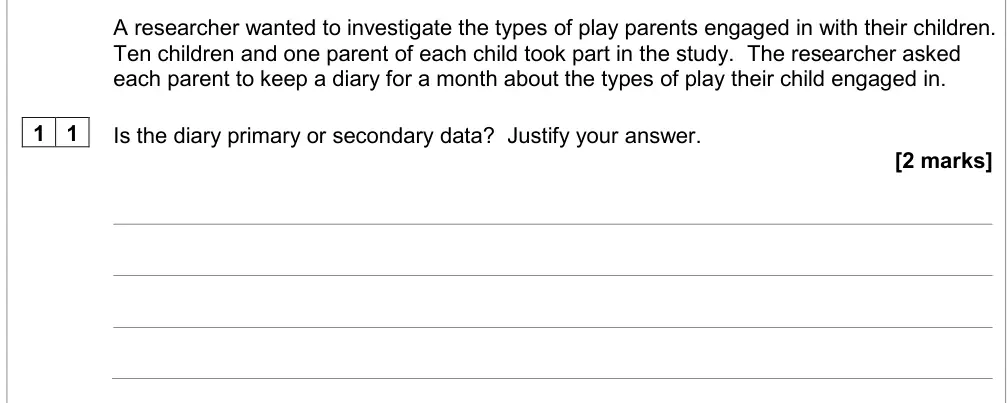
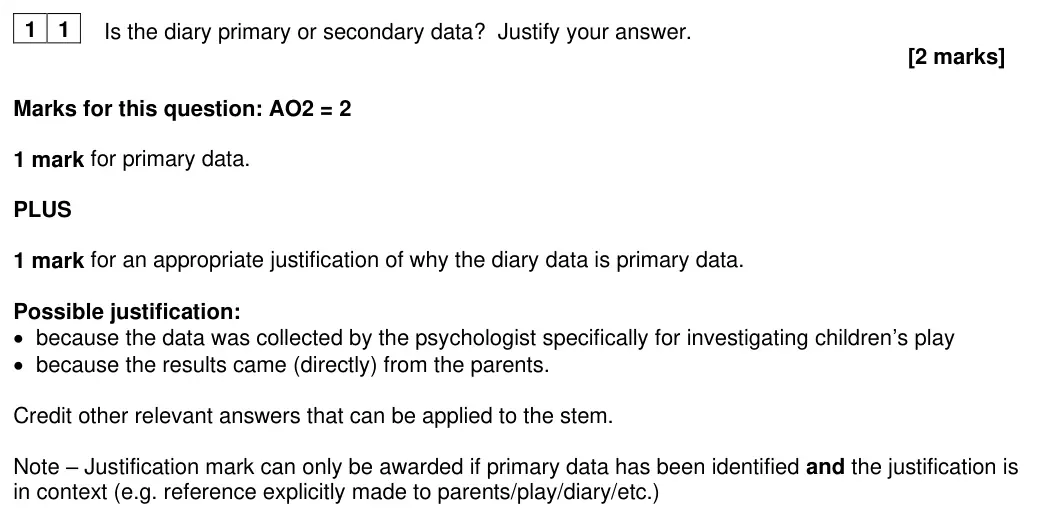
A researcher wanted to investigate the types of play parents engaged in with their children.
Ten children and one parent of each child took part in the study.  The researcher asked
each parent to keep a diary for a month about the types of play their child engaged in.
1 1
Is the diary primary or secondary data?  Justify your answer.
[2 marks]
June 2024 · Paper 2 · Q12 4 marks AO2=4 Research methods research methodsdata handling
1 2
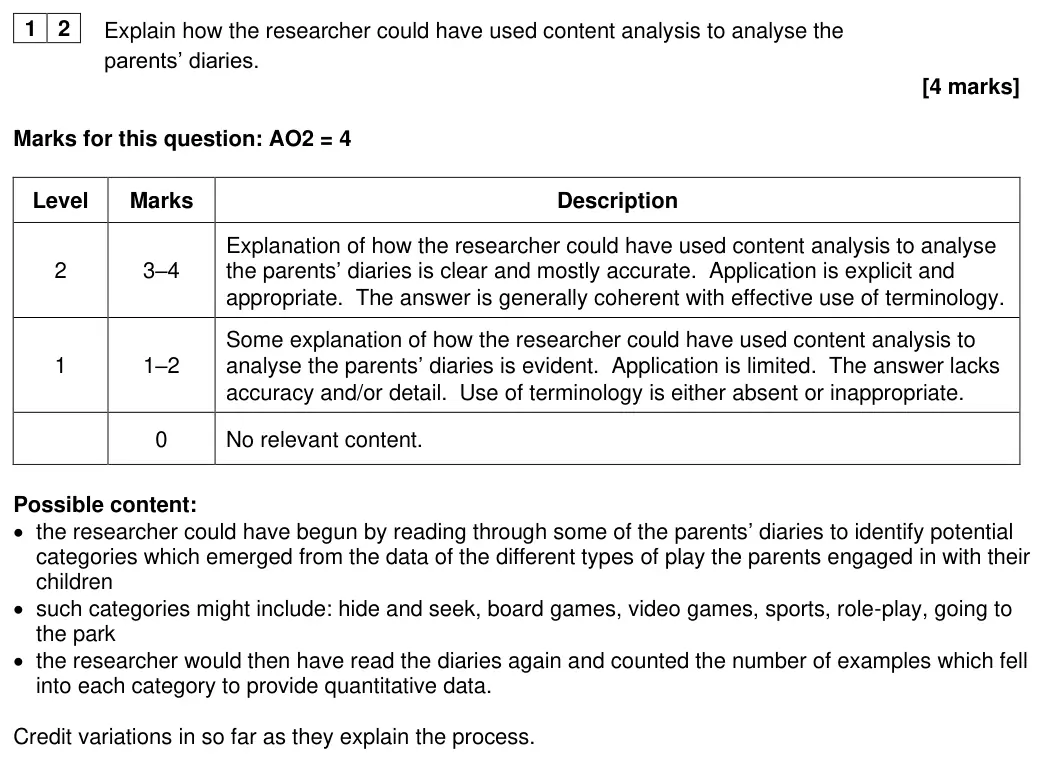
Explain how the researcher could have used content analysis to analyse the
parents’ diaries.
[4 marks]
Extra space
June 2024 · Paper 2 · Q13 4 marks AO2=4 Research methods scientific processesresearch methods
1 3
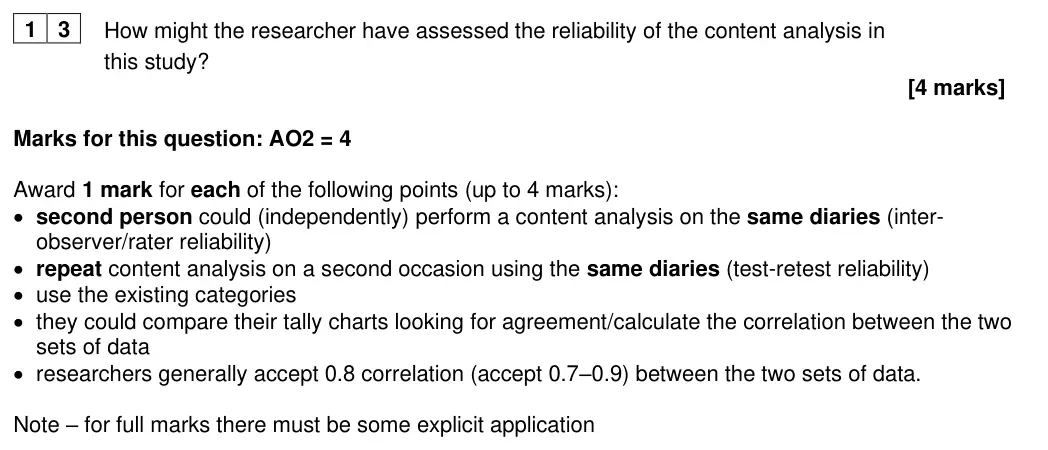
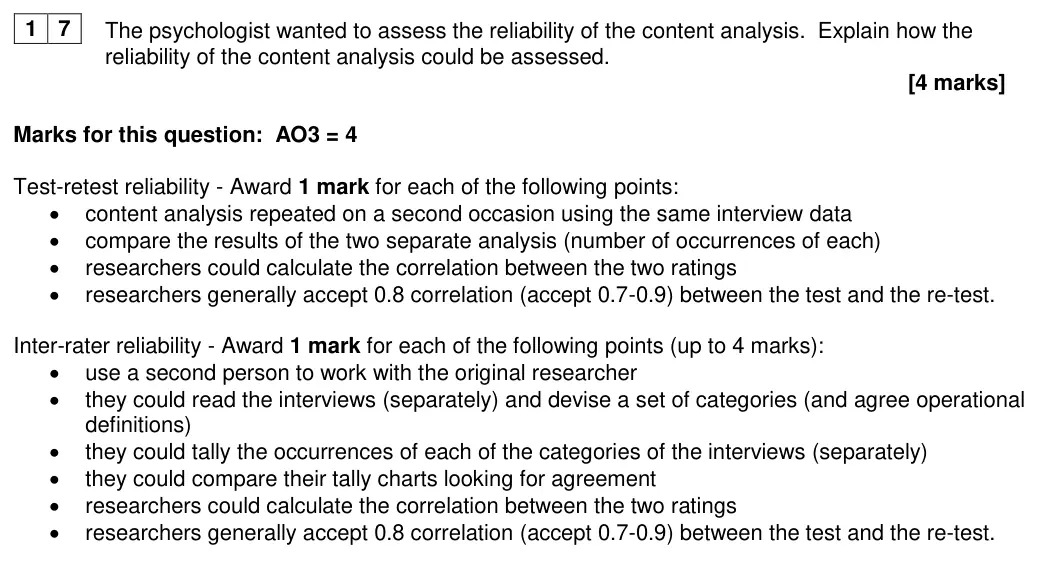
The researcher was concerned about the reliability of the content analysis.
How might the researcher have assessed the reliability of the content analysis in
this study?
[4 marks]
Extra space
June 2024 · Paper 2 · Q14 3 marks AO3=3 Research methods research methods
1 4
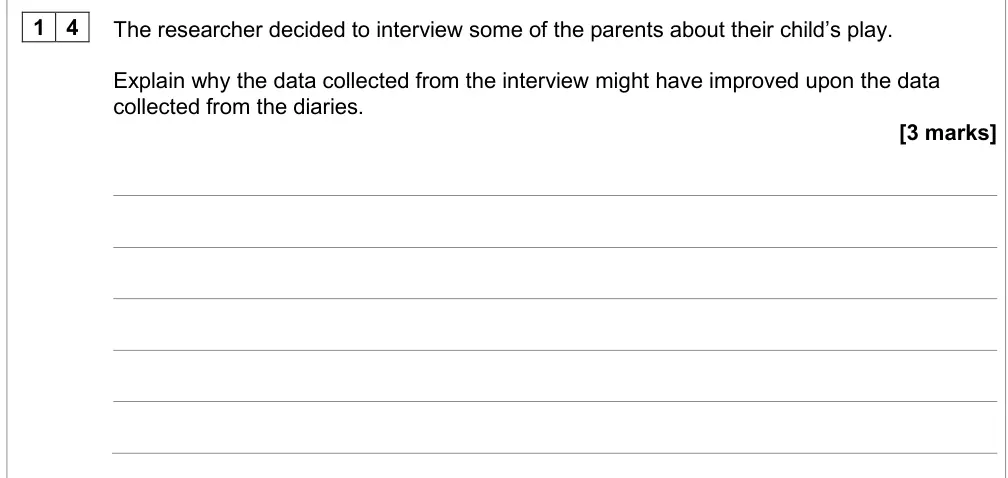
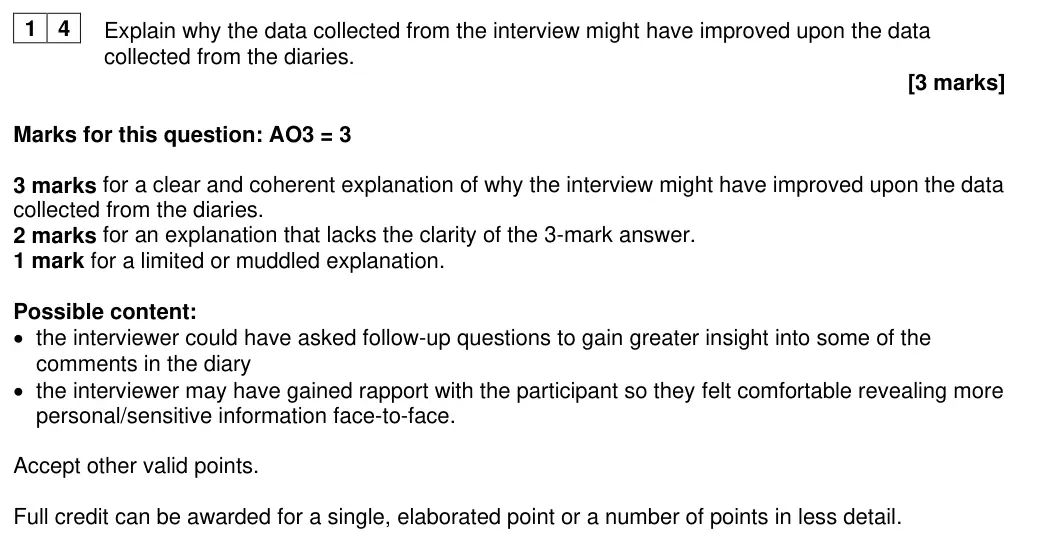
The researcher decided to interview some of the parents about their child’s play.
Explain why the data collected from the interview might have improved upon the data
collected from the diaries.
[3 marks]
June 2024 · Paper 2 · Q15 2 marks AO2=2 Research methods scientific processesdata handling
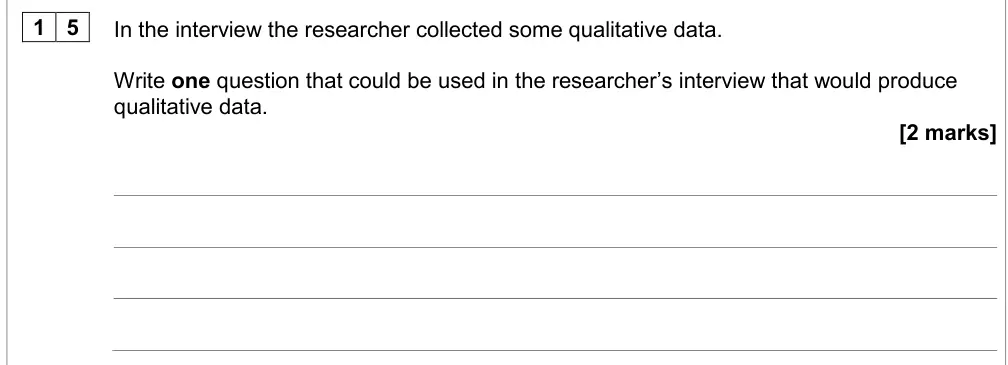
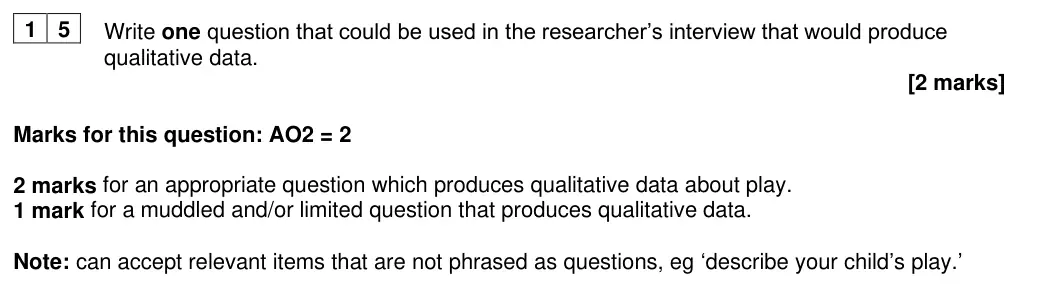
1 5
In the interview the researcher collected some qualitative data.
Write one question that could be used in the researcher’s interview that would produce
qualitative data.
[2 marks]
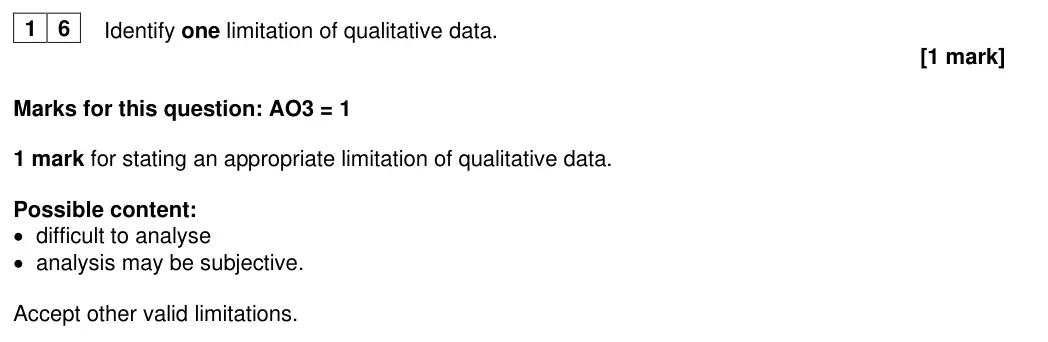
June 2024 · Paper 2 · Q16 1 mark AO3=1 Research methods data handling
1 6
Identify one limitation of qualitative data.
[1 mark]
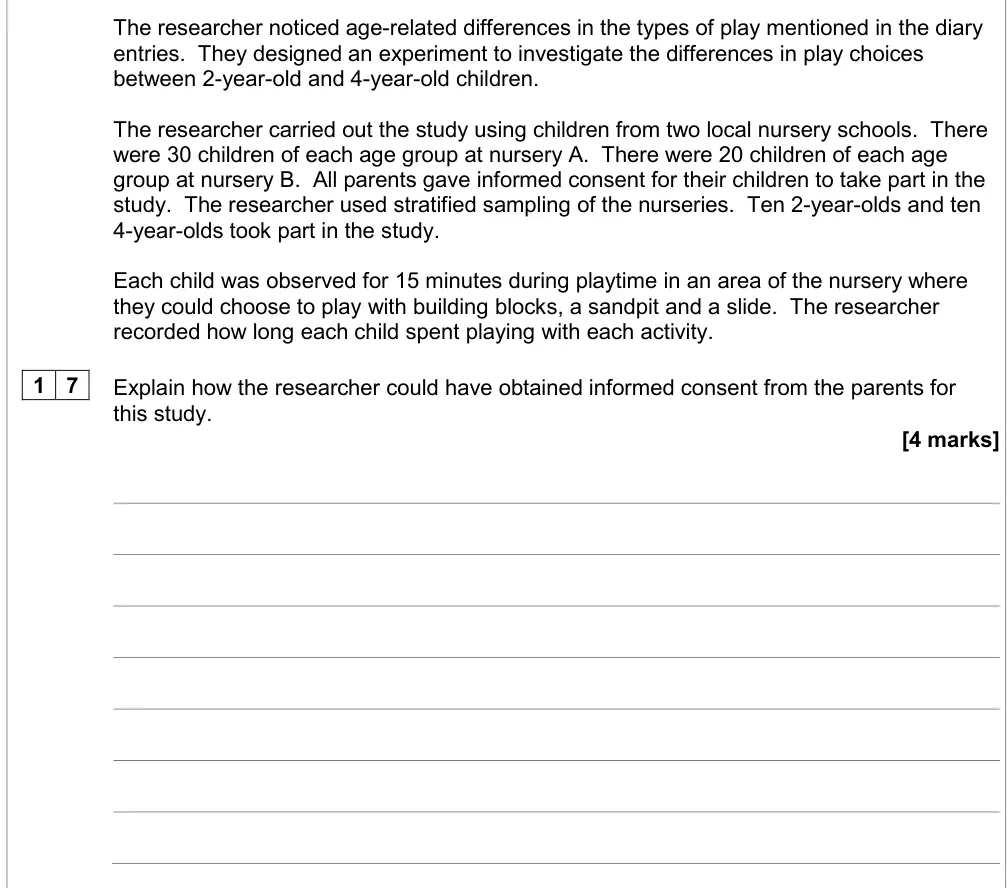
June 2024 · Paper 2 · Q17 4 marks AO2=4 Research methods scientific processes
The researcher noticed age-related differences in the types of play mentioned in the diary
entries.  They designed an experiment to investigate the differences in play choices
between 2-year-old and 4-year-old children.
The researcher carried out the study using children from two local nursery schools.  There
were 30 children of each age group at nursery A.  There were 20 children of each age
group at nursery B.  All parents gave informed consent for their children to take part in the
study.  The researcher used stratified sampling of the nurseries.  Ten 2-year-olds and ten
4-year-olds took part in the study.
Each child was observed for 15 minutes during playtime in an area of the nursery where
they could choose to play with building blocks, a sandpit and a slide.  The researcher
recorded how long each child spent playing with each activity.
1 7
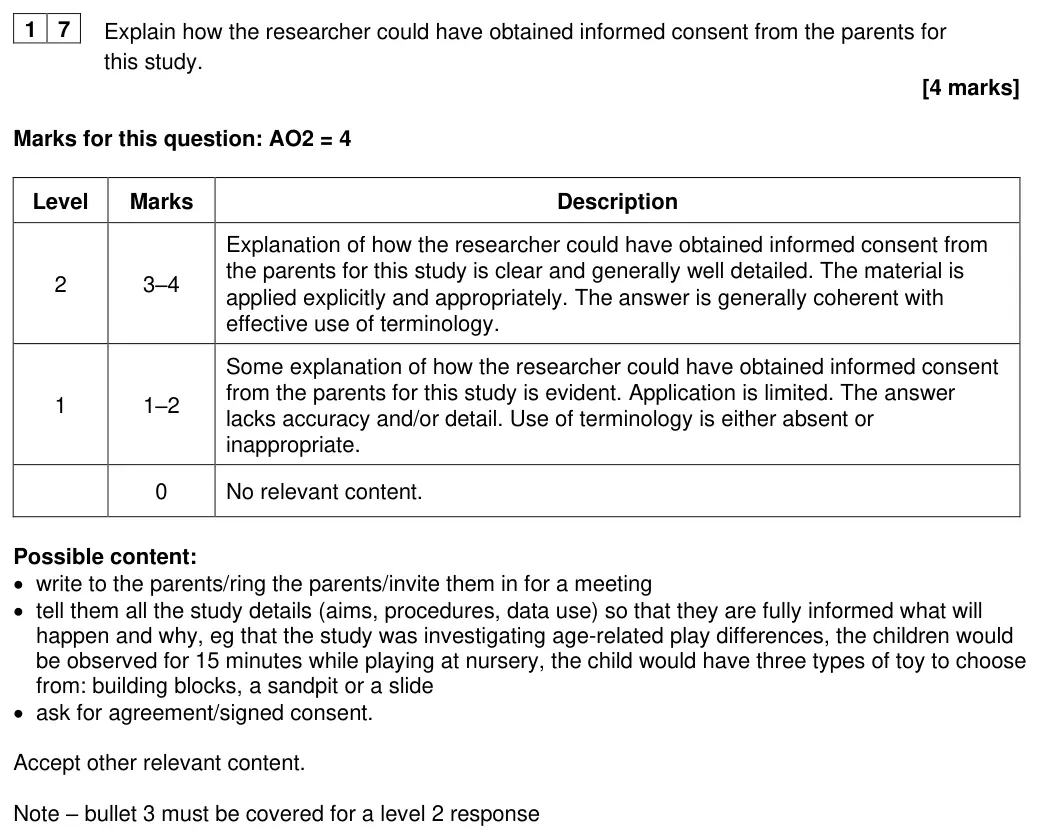
Explain how the researcher could have obtained informed consent from the parents for
this study.
[4 marks]
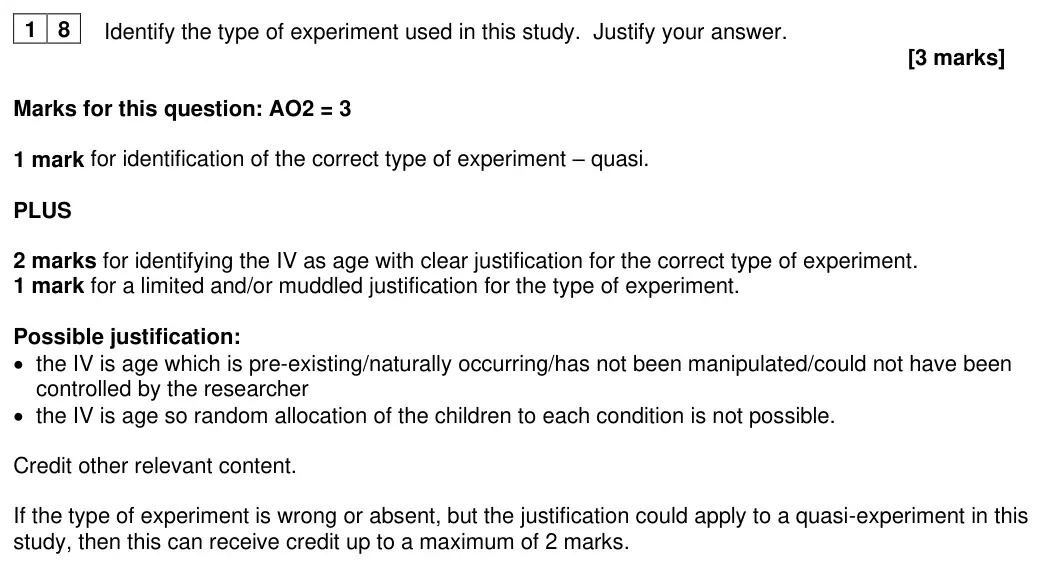
June 2024 · Paper 2 · Q18 3 marks AO2=3 Research methods research methods
1 8
Identify the type of experiment used in this study.  Justify your answer.
[3 marks]
June 2024 · Paper 2 · Q19 4 marks AO3=4 Research methods scientific processes
1 9
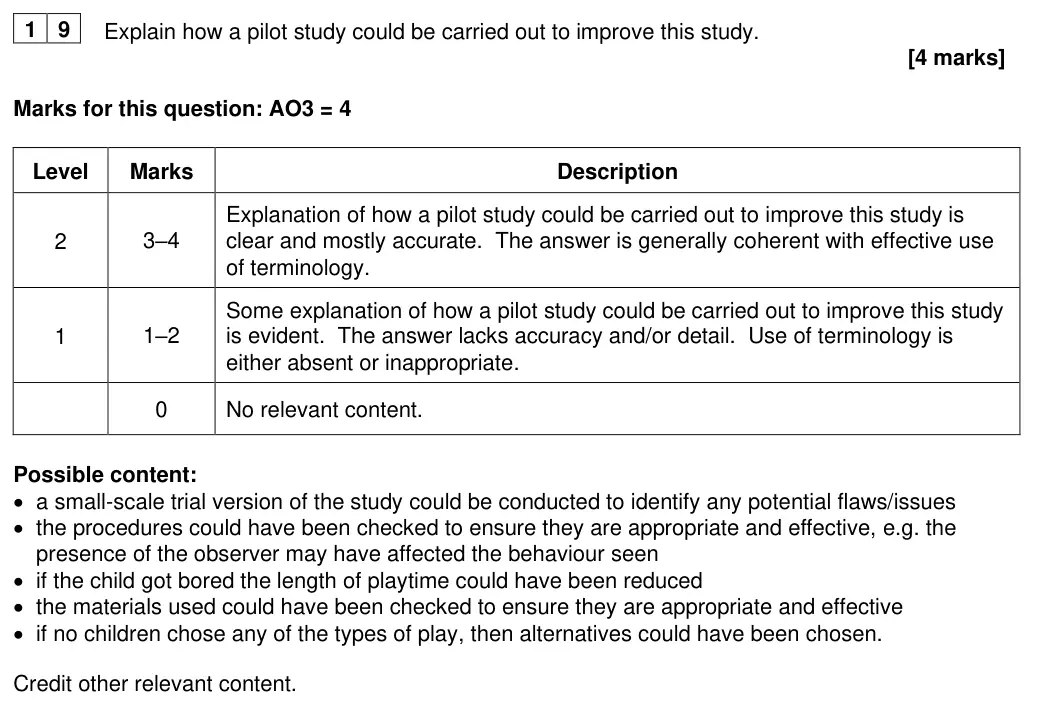
Explain how a pilot study could be carried out to improve this study.
[4 marks]
June 2024 · Paper 2 · Q20 4 marks AO2=4 Research methods scientific processes
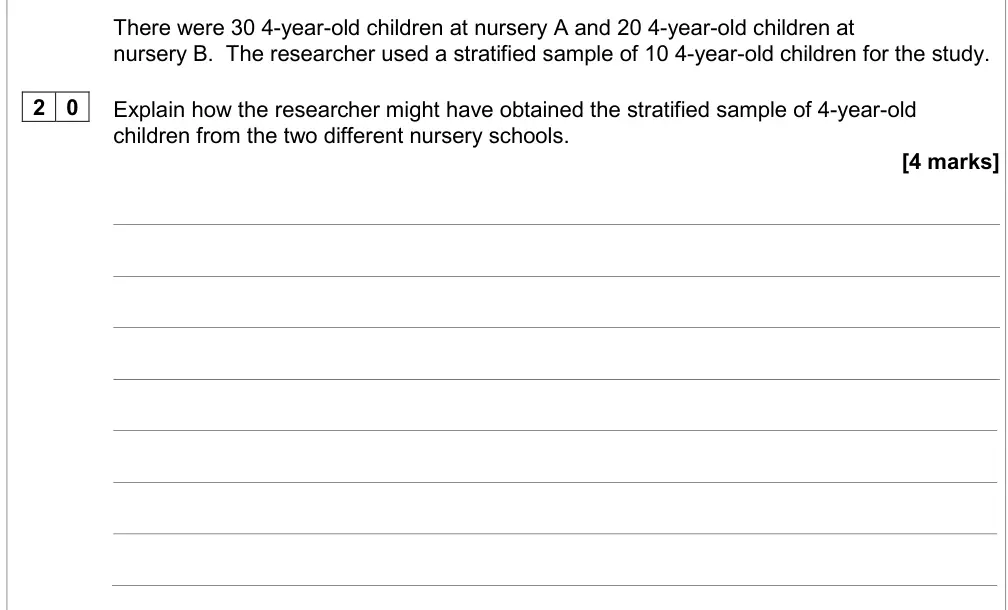
There were 30 4-year-old children at nursery A and 20 4-year-old children at
nursery B.  The researcher used a stratified sample of 10 4-year-old children for the study.
2 0
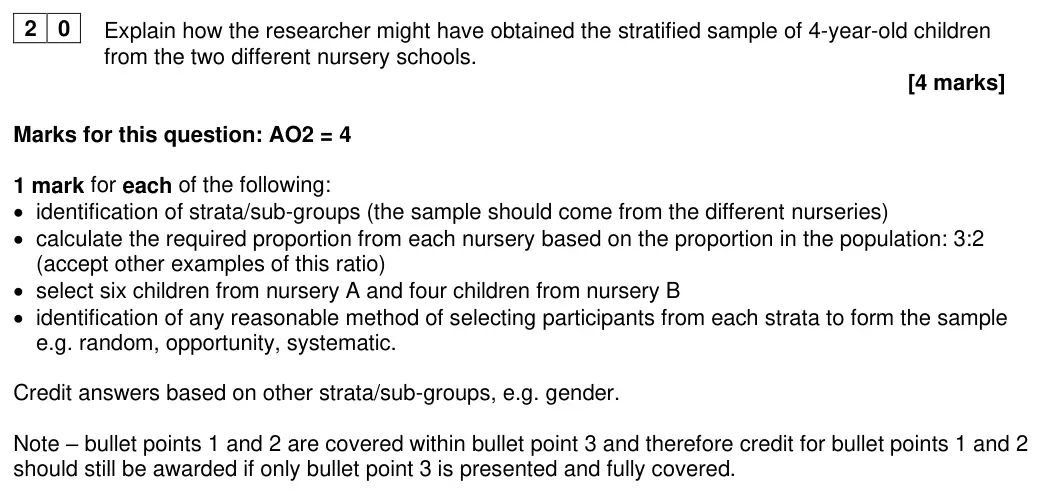
Explain how the researcher might have obtained the stratified sample of 4-year-old
children from the two different nursery schools.
[4 marks]
June 2024 · Paper 2 · Q21 4 marks AO2=4 Research methods data handling
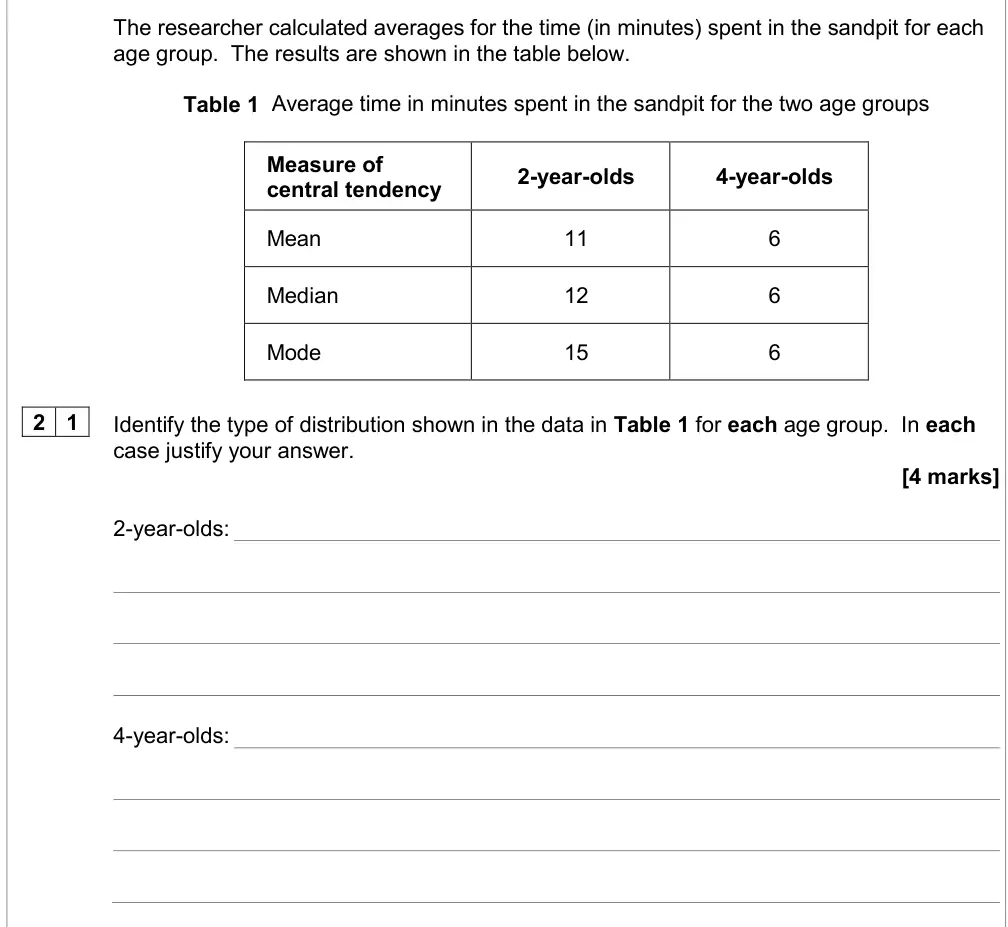
The researcher calculated averages for the time (in minutes) spent in the sandpit for each
age group.  The results are shown in the table below.
Table 1  Average time in minutes spent in the sandpit for the two age groups
Measure of
2-year-olds
4-year-olds
central tendency
Mean
11
6
Median
12
6
Mode
15
6
2 1
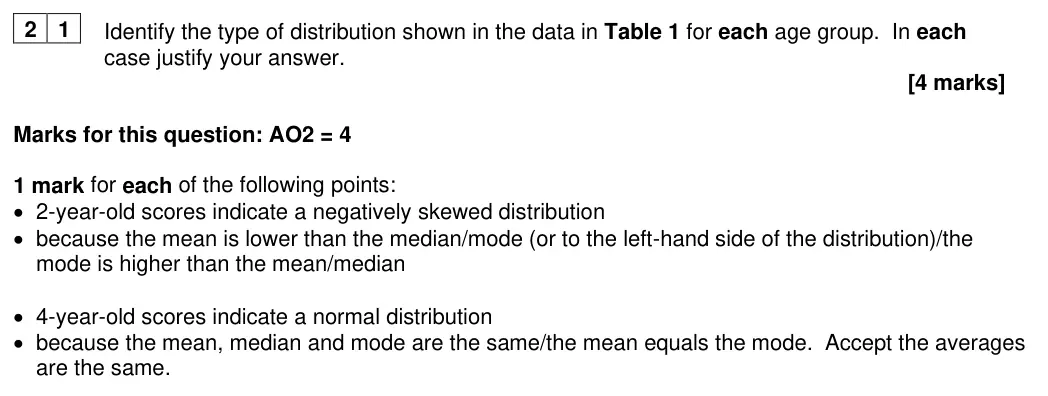
Identify the type of distribution shown in the data in Table 1 for each age group.  In each
case justify your answer.
[4 marks]
2-year-olds:
4-year-olds:
June 2024 · Paper 2 · Q22 2 marks AO2=2 Research methods data handling
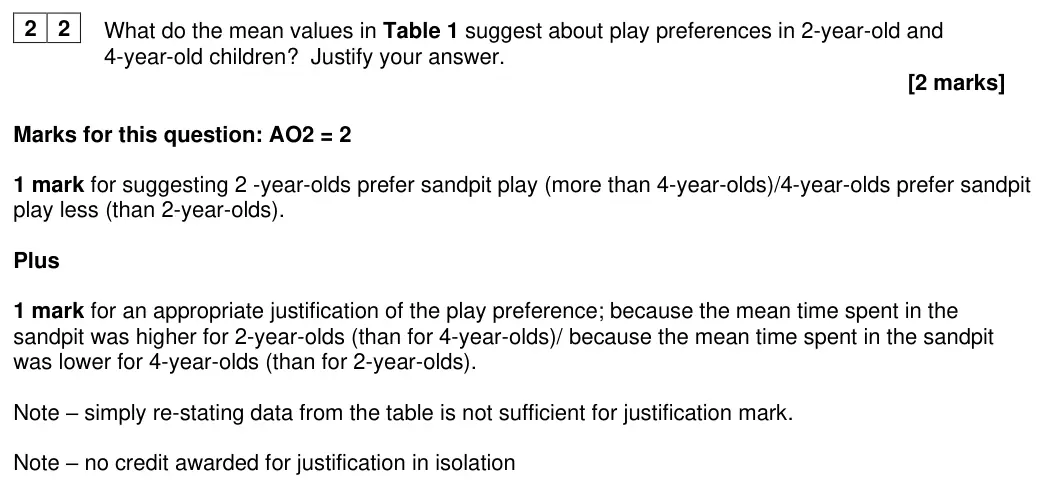
2 2
What do the mean values in Table 1 suggest about play preferences in 2-year-old and
4-year-old children?  Justify your answer.
[2 marks]
June 2024 · Paper 2 · Q23 6 marks AO2=6 Research methods inferential testingdata handling
2 3
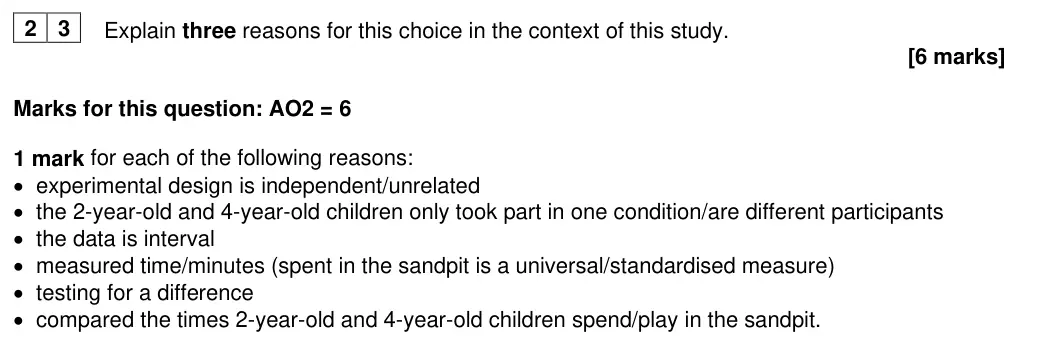
The researcher decided to use an unrelated t-test to analyse the raw data from the study
on sandpit play.
Explain three reasons for this choice in the context of this study.
[6 marks]
Extra space
June 2024 · Paper 2 · Q24 2 marks AO2=2 Research methods inferential testing
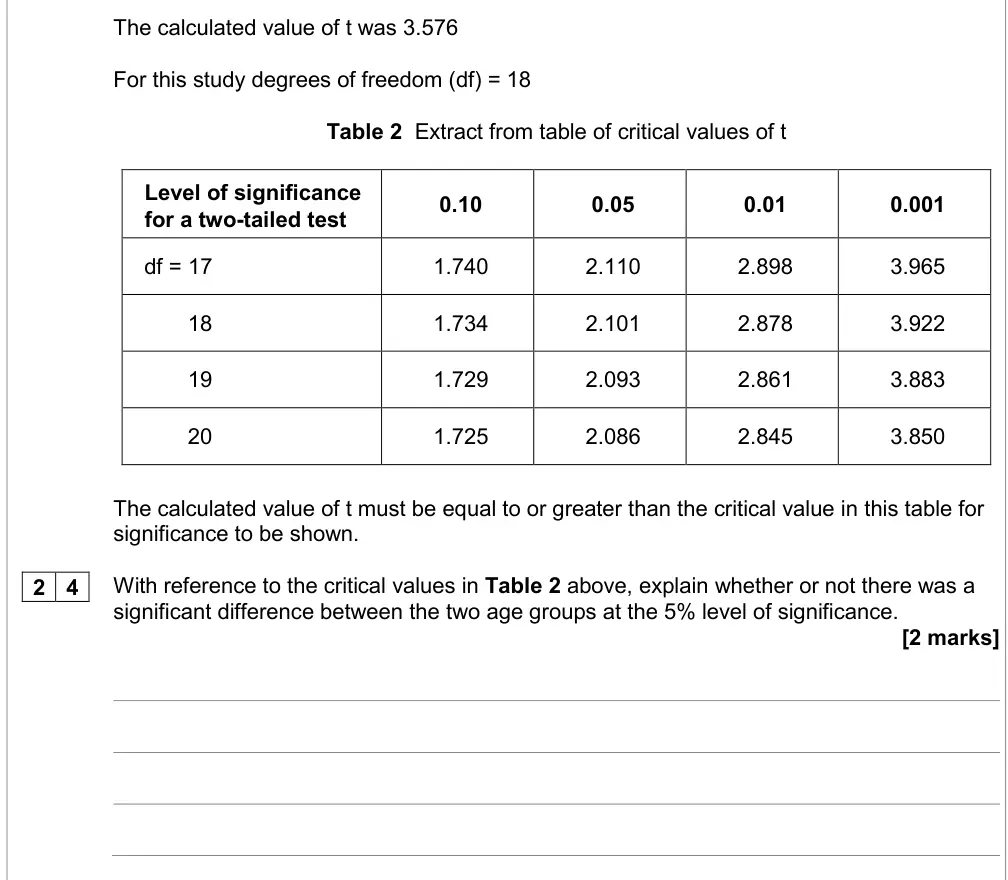
The calculated value of t was 3.576
For this study degrees of freedom (df) = 18
Table 2  Extract from table of critical values of t
Level of significance
for a two-tailed test
0.10
0.05
0.01
0.001
df = 17
1.740
2.110
2.898
3.965
18
1.734
2.101
2.878
3.922
19
1.729
2.093
2.861
3.883
20
1.725
2.086
2.845
3.850
The calculated value of t must be equal to or greater than the critical value in this table for
significance to be shown.
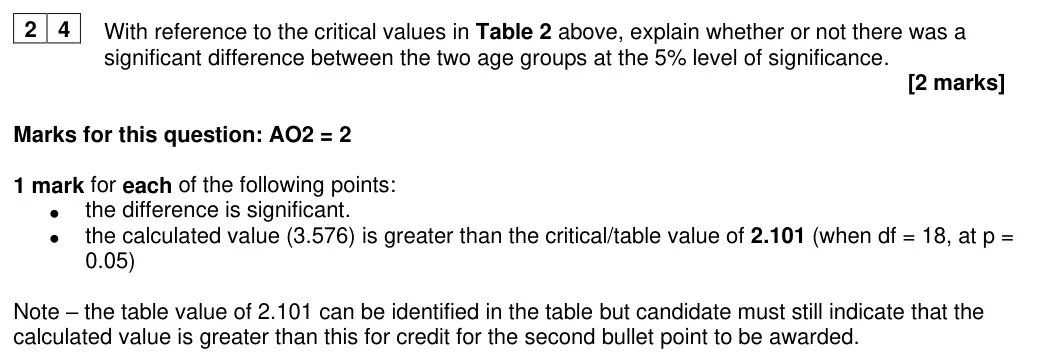
2 4
With reference to the critical values in Table 2 above, explain whether or not there was a
significant difference between the two age groups at the 5% level of significance.
[2 marks]
June 2024 · Paper 2 · Q25 3 marks AO2=3 Research methods inferential testing
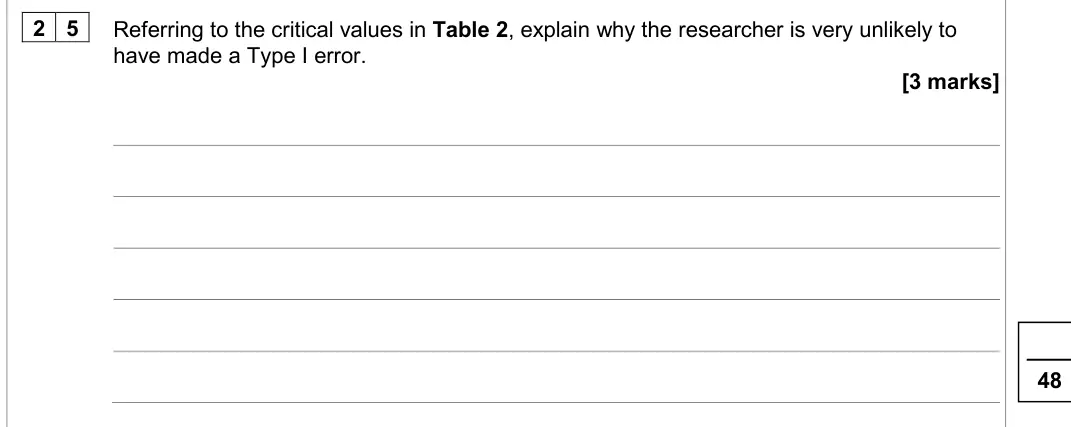
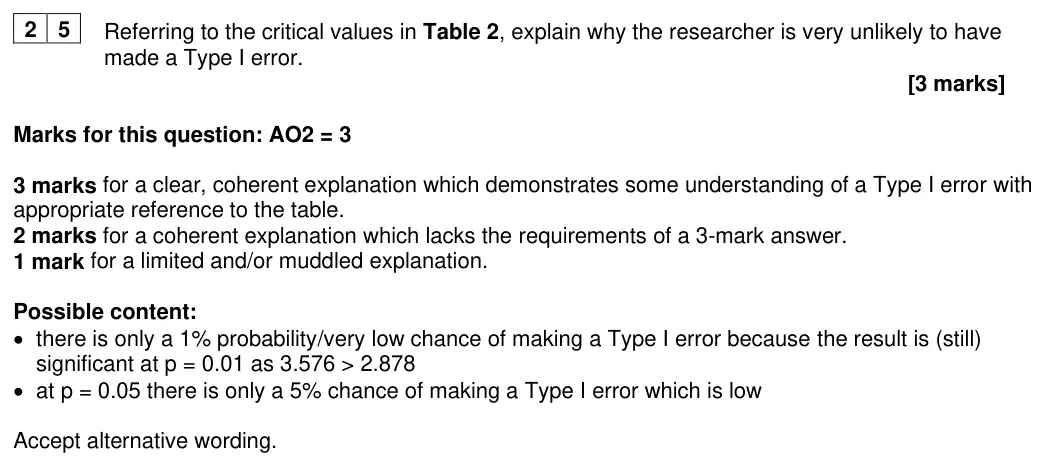
2 5
Referring to the critical values in Table 2, explain why the researcher is very unlikely to
have made a Type I error.
[3 marks]
June 2024 · Paper 3 · Q6 3 marks AO3=3 Research methods scientific processes
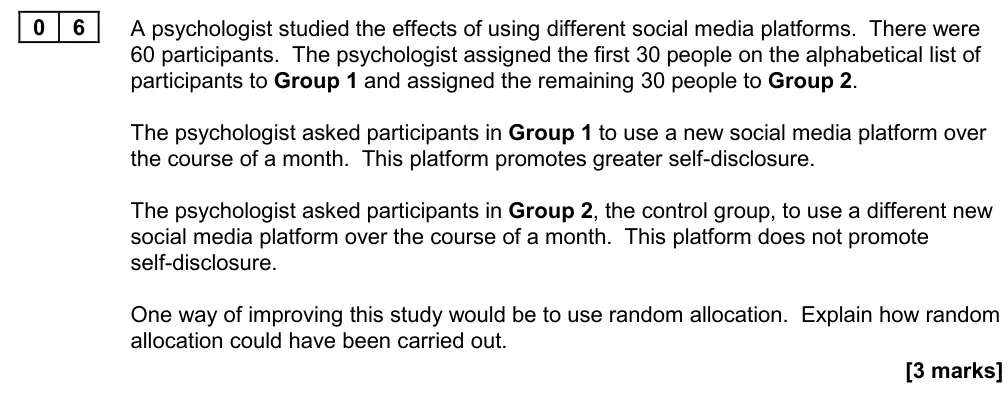
0 6
A psychologist studied the effects of using different social media platforms.  There were
60 participants.  The psychologist assigned the first 30 people on the alphabetical list of
participants to Group 1 and assigned the remaining 30 people to Group 2.
The psychologist asked participants in Group 1 to use a new social media platform over
the course of a month.  This platform promotes greater self-disclosure.
The psychologist asked participants in Group 2, the control group, to use a different new
social media platform over the course of a month.  This platform does not promote
self-disclosure.
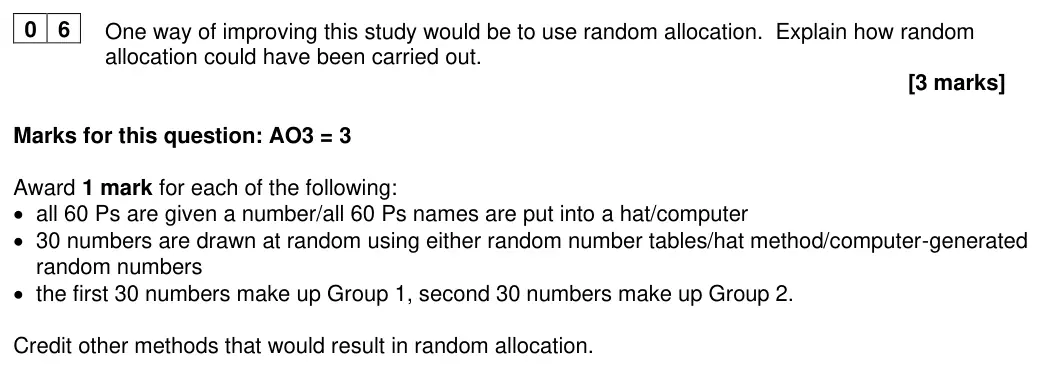
One way of improving this study would be to use random allocation.  Explain how random
allocation could have been carried out.
[3 marks]
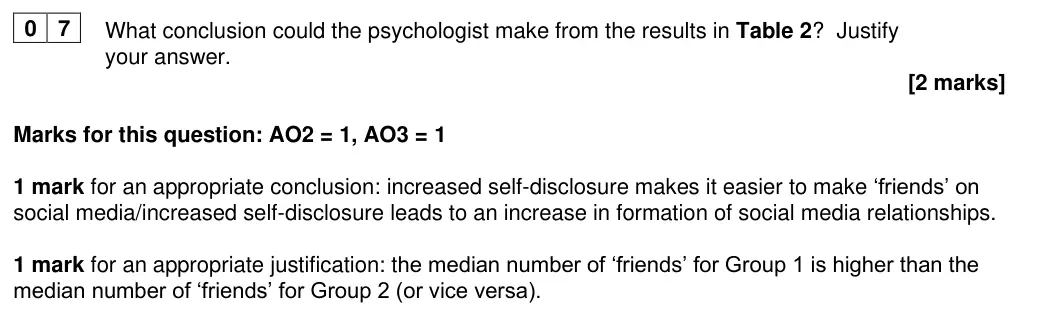
June 2024 · Paper 3 · Q7 2 marks AO2=1, AO3=1 Research methods data handling
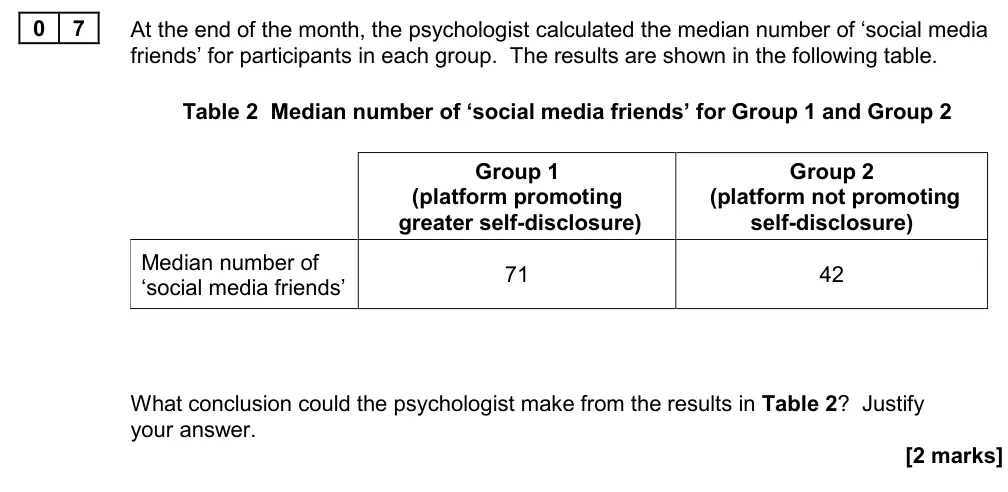
0 7
At the end of the month, the psychologist calculated the median number of ‘social media
friends’ for participants in each group.  The results are shown in the following table.
Table 2  Median number of ‘social media friends’ for Group 1 and Group 2
Group 1
Group 2
(platform promoting
(platform not promoting
greater self-disclosure)
self-disclosure)
Median number of
‘social media friends’
71
42
What conclusion could the psychologist make from the results in Table 2?  Justify
your answer.
[2 marks]
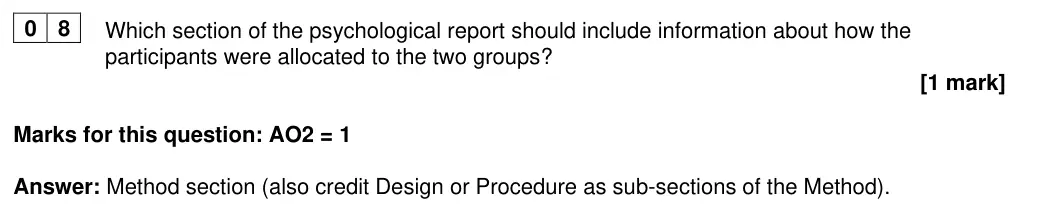
June 2024 · Paper 3 · Q8 1 mark AO2=1 Research methods scientific processes
0 8
After conducting the study, the psychologist wrote up a psychological report.
Which section of the psychological report should include information about how the
participants were allocated to the two groups?
[1 mark]
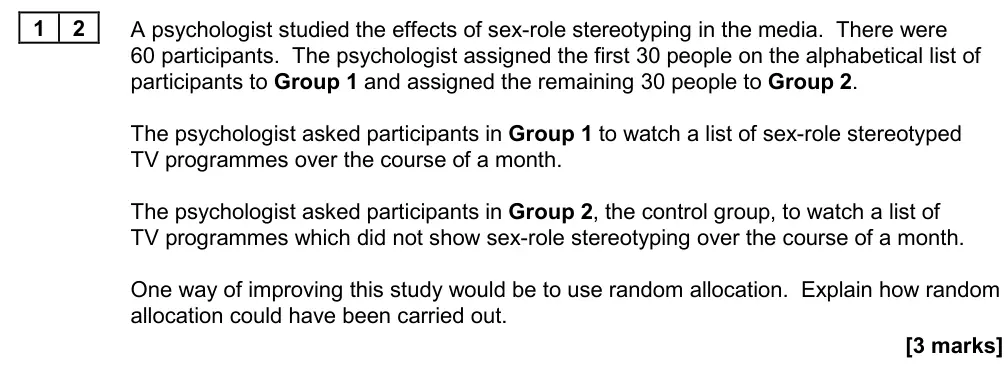
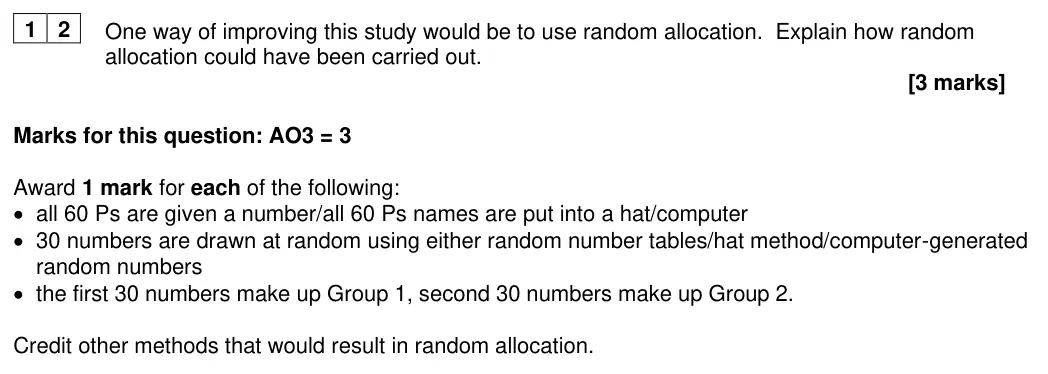
June 2024 · Paper 3 · Q12 3 marks AO3=3 Research methods scientific processes
1 2
A psychologist studied the effects of sex-role stereotyping in the media.  There were
60 participants.  The psychologist assigned the first 30 people on the alphabetical list of
participants to Group 1 and assigned the remaining 30 people to Group 2.
The psychologist asked participants in Group 1 to watch a list of sex-role stereotyped
TV programmes over the course of a month.
The psychologist asked participants in Group 2, the control group, to watch a list of
TV programmes which did not show sex-role stereotyping over the course of a month.
One way of improving this study would be to use random allocation.  Explain how random
allocation could have been carried out.
[3 marks]
June 2024 · Paper 3 · Q13 2 marks AO2=1, AO3=1 Research methods data handling
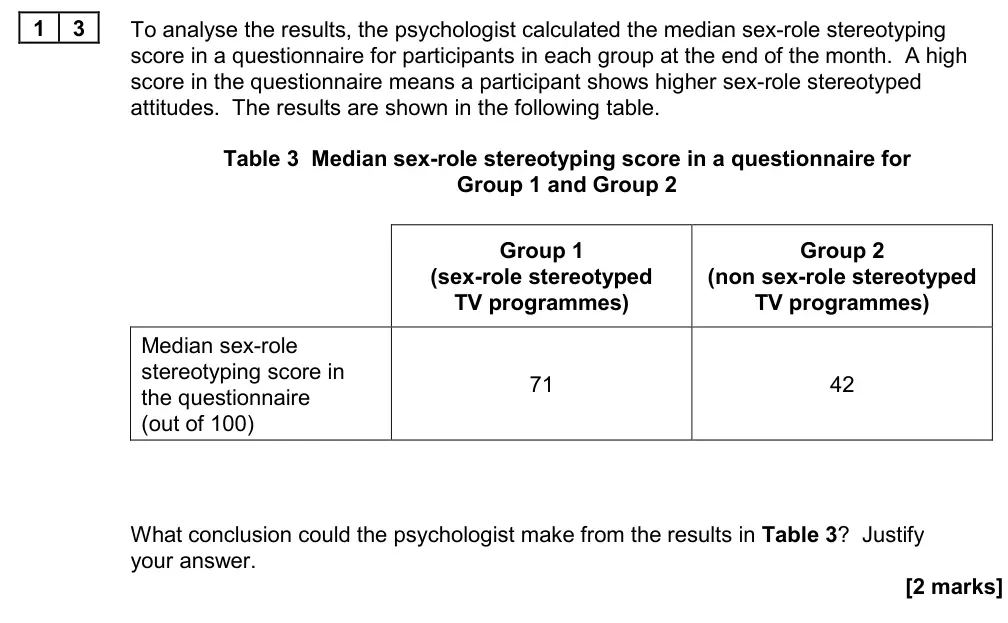
1 3
To analyse the results, the psychologist calculated the median sex-role stereotyping
score in a questionnaire for participants in each group at the end of the month.  A high
score in the questionnaire means a participant shows higher sex-role stereotyped
attitudes.  The results are shown in the following table.
Table 3  Median sex-role stereotyping score in a questionnaire for
Group 1 and Group 2
Group 1
Group 2
(sex-role stereotyped
(non sex-role stereotyped
TV programmes)
TV programmes)
Median sex-role
stereotyping score in
71
42
the questionnaire
(out of 100)
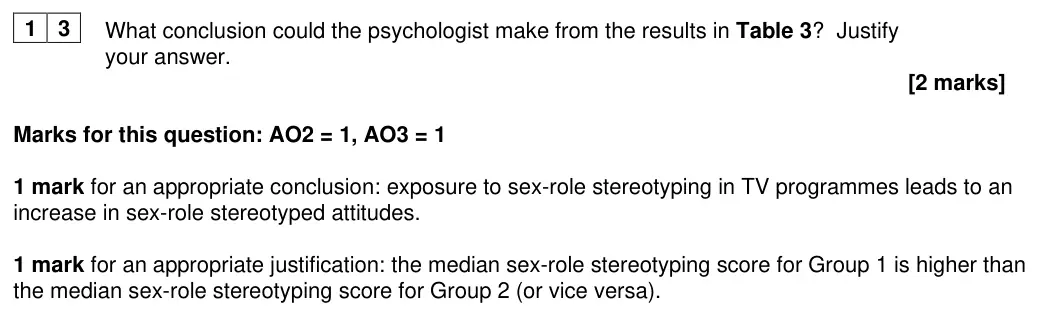
What conclusion could the psychologist make from the results in Table 3?  Justify
your answer.
[2 marks]
June 2024 · Paper 3 · Q14 1 mark AO2=1 Research methods scientific processes
1 4
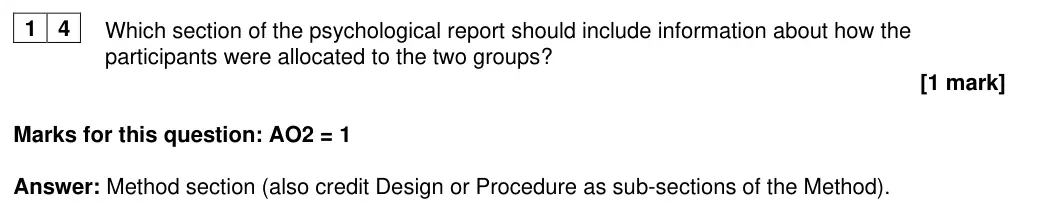
After conducting the study, the psychologist wrote up a psychological report.
Which section of the psychological report should include information about how the
participants were allocated to the two groups?
[1 mark]
June 2024 · Paper 3 · Q18 3 marks AO3=3 Research methods scientific processes
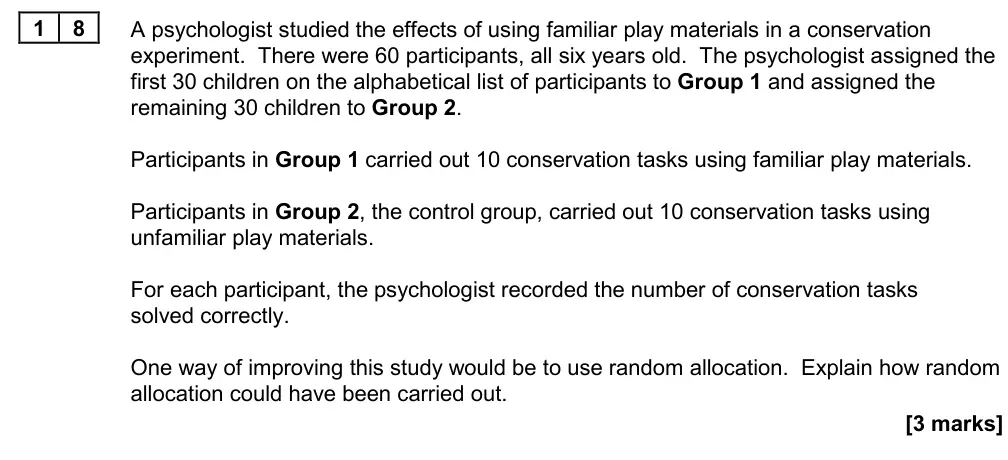
1 8
A psychologist studied the effects of using familiar play materials in a conservation
experiment.  There were 60 participants, all six years old.  The psychologist assigned the
first 30 children on the alphabetical list of participants to Group 1 and assigned the
remaining 30 children to Group 2.
Participants in Group 1 carried out 10 conservation tasks using familiar play materials.
Participants in Group 2, the control group, carried out 10 conservation tasks using
unfamiliar play materials.
For each participant, the psychologist recorded the number of conservation tasks
solved correctly.
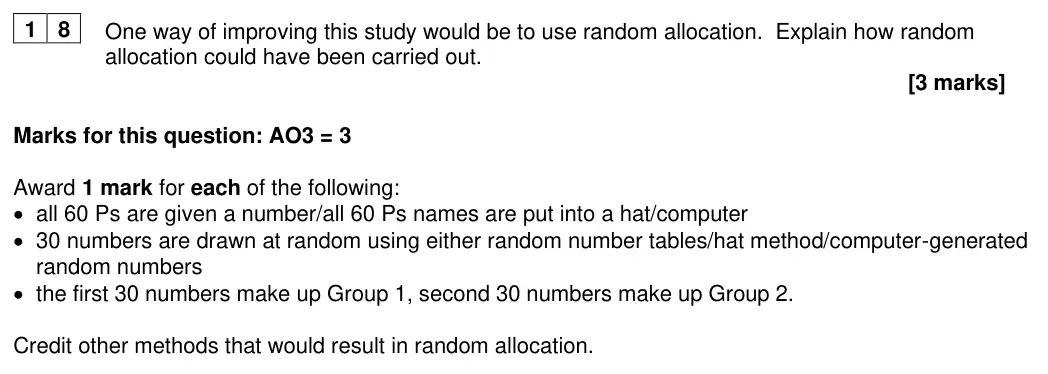
One way of improving this study would be to use random allocation.  Explain how random
allocation could have been carried out.
[3 marks]
June 2024 · Paper 3 · Q19 2 marks AO2=1, AO3=1 Research methods data handling
1 9
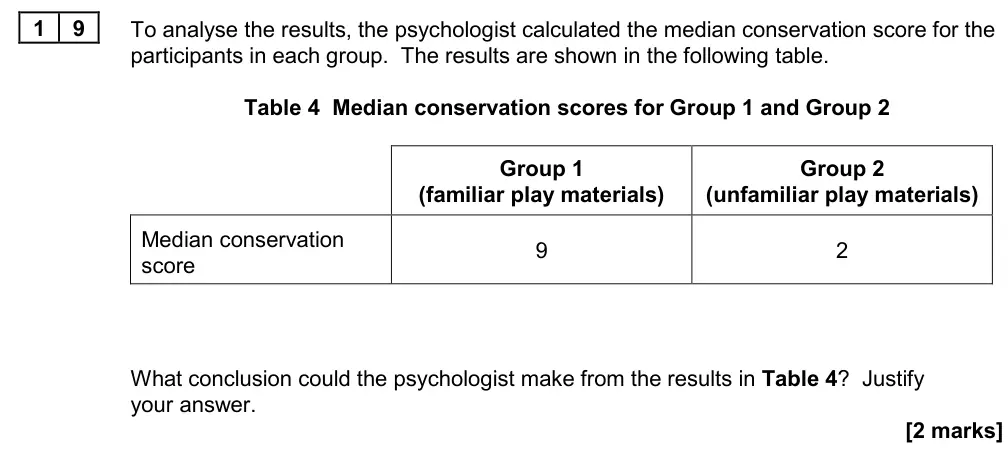
To analyse the results, the psychologist calculated the median conservation score for the
participants in each group.  The results are shown in the following table.
Table 4  Median conservation scores for Group 1 and Group 2
Group 1
Group 2
(familiar play materials)
(unfamiliar play materials)
Median conservation
9
2
score
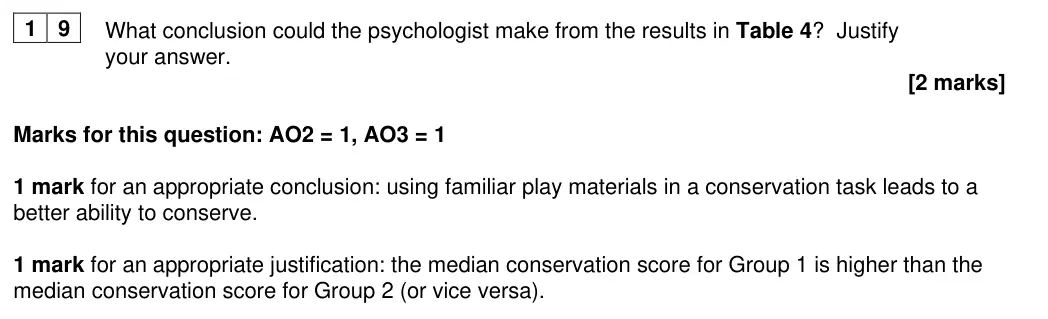
What conclusion could the psychologist make from the results in Table 4?  Justify
your answer.
[2 marks]
June 2024 · Paper 3 · Q20 1 mark AO2=1 Research methods scientific processes
2 0
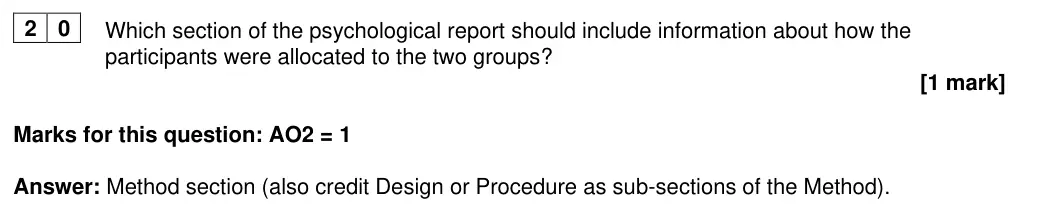
After conducting the study, the psychologist wrote up a psychological report.
Which section of the psychological report should include information about how the
participants were allocated to the two groups?
[1 mark]
June 2024 · Paper 3 · Q39 3 marks AO3=3 Research methods scientific processes
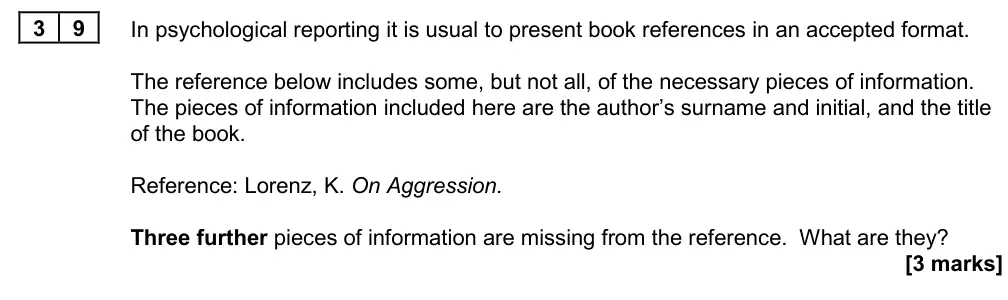
3 9
In psychological reporting it is usual to present book references in an accepted format.
The reference below includes some, but not all, of the necessary pieces of information.
The pieces of information included here are the author’s surname and initial, and the title
of the book.
Reference: Lorenz, K. On Aggression.
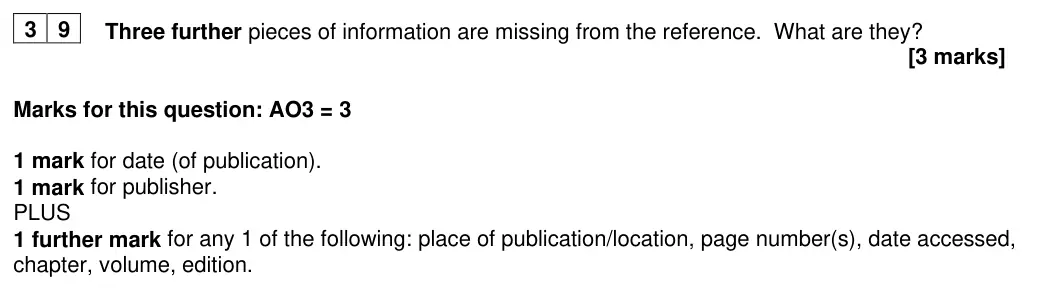
Three further pieces of information are missing from the reference.  What are they?
[3 marks]
June 2024 · Paper 3 · Q40 2 marks AO3=2 Research methods scientific processesresearch methods
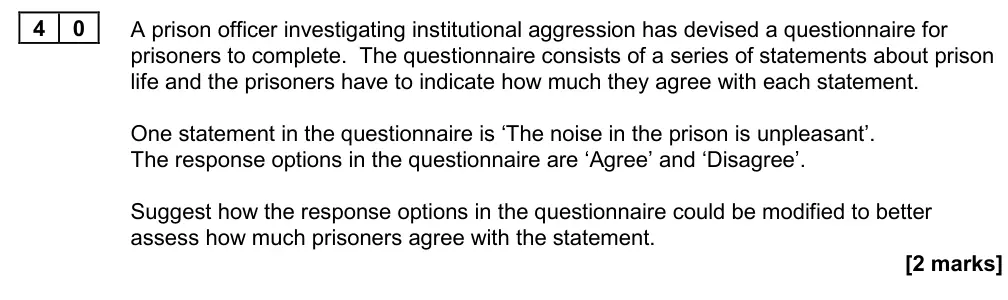
4 0
A prison officer investigating institutional aggression has devised a questionnaire for
prisoners to complete.  The questionnaire consists of a series of statements about prison
life and the prisoners have to indicate how much they agree with each statement.
One statement in the questionnaire is ‘The noise in the prison is unpleasant’.
The response options in the questionnaire are ‘Agree’ and ‘Disagree’.
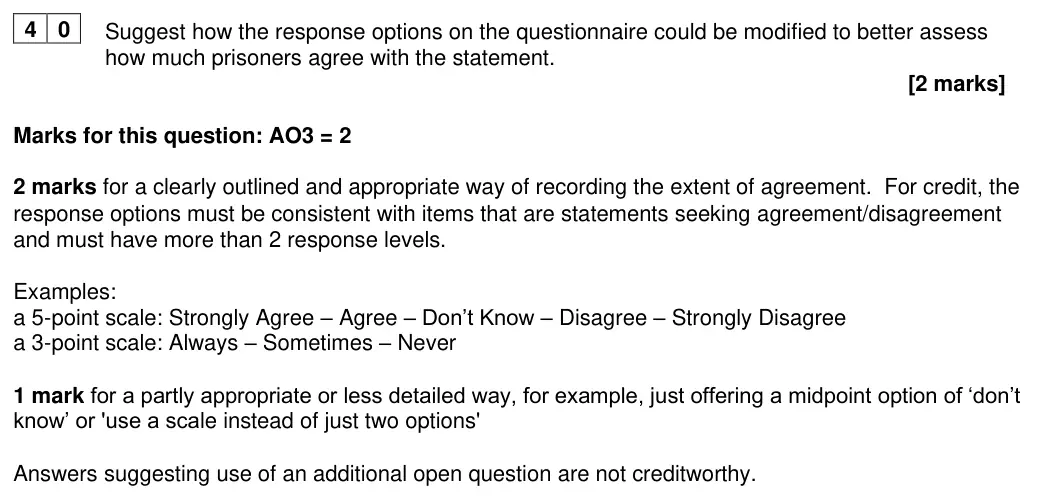
Suggest how the response options in the questionnaire could be modified to better
assess how much prisoners agree with the statement.
[2 marks]
June 2024 · Paper 3 · Q43 3 marks AO3=3 Research methods scientific processes
4 3
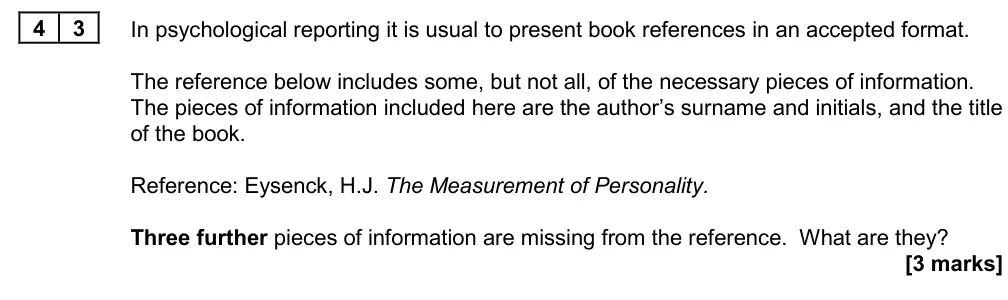
In psychological reporting it is usual to present book references in an accepted format.
The reference below includes some, but not all, of the necessary pieces of information.
The pieces of information included here are the author’s surname and initials, and the title
of the book.
Reference: Eysenck, H.J. The Measurement of Personality.
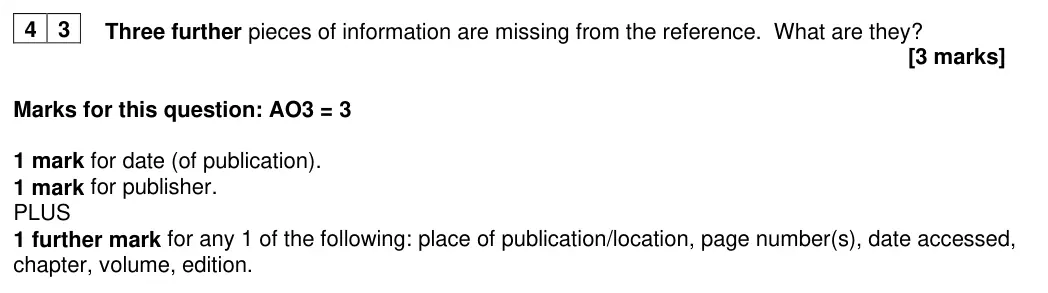
Three further pieces of information are missing from the reference.  What are they?
[3 marks]
June 2024 · Paper 3 · Q44 2 marks AO3=2 Research methods scientific processesresearch methods
4 4
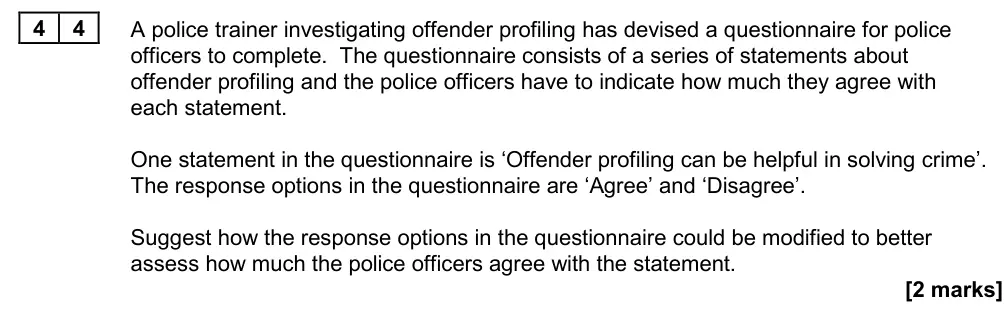
A police trainer investigating offender profiling has devised a questionnaire for police
officers to complete.  The questionnaire consists of a series of statements about
offender profiling and the police officers have to indicate how much they agree with
each statement.
One statement in the questionnaire is ‘Offender profiling can be helpful in solving crime’.
The response options in the questionnaire are ‘Agree’ and ‘Disagree’.
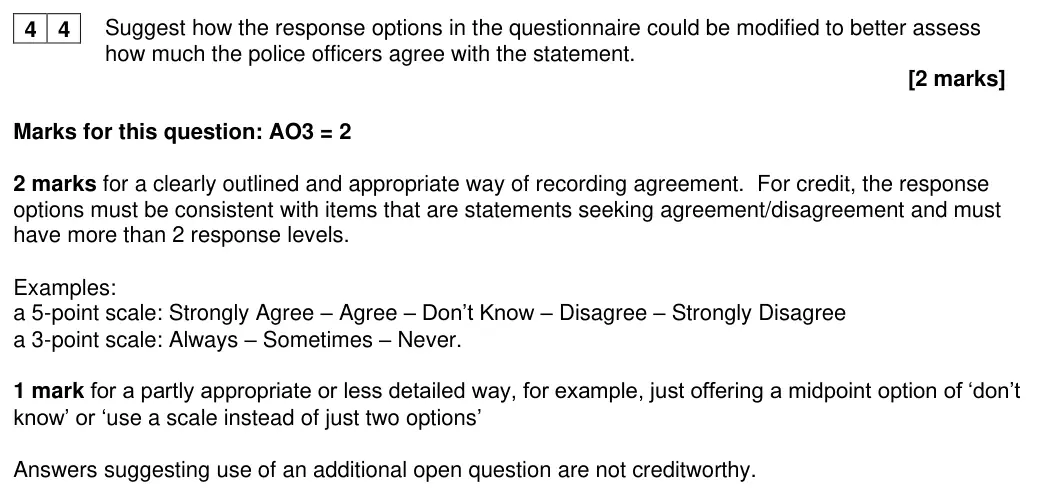
Suggest how the response options in the questionnaire could be modified to better
assess how much the police officers agree with the statement.
[2 marks]
June 2024 · Paper 3 · Q47 3 marks AO3=3 Research methods scientific processes
4 7
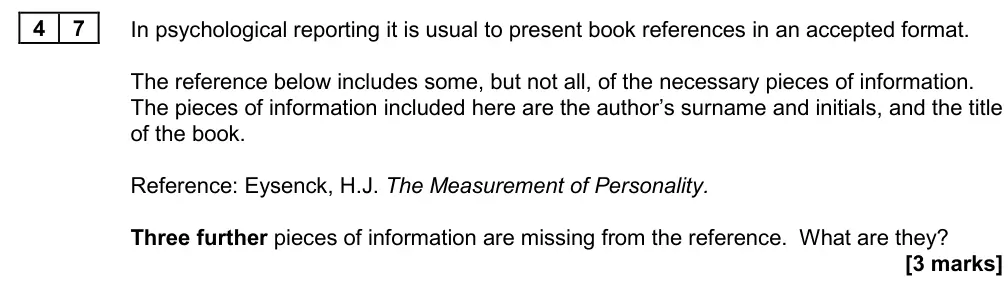
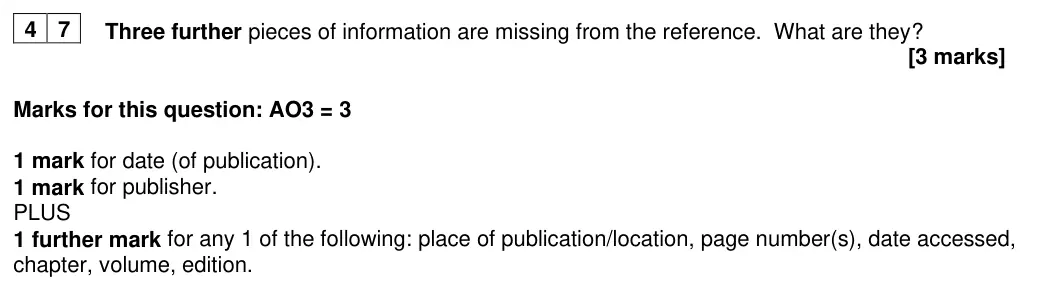
In psychological reporting it is usual to present book references in an accepted format.
The reference below includes some, but not all, of the necessary pieces of information.
The pieces of information included here are the author’s surname and initials, and the title
of the book.
Reference: Eysenck, H.J. The Measurement of Personality.
Three further pieces of information are missing from the reference.  What are they?
[3 marks]
June 2024 · Paper 3 · Q48 2 marks AO3=2 Research methods scientific processesresearch methods
4 8
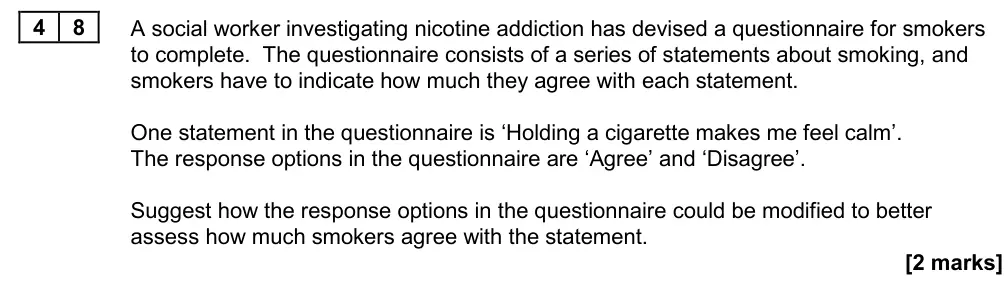
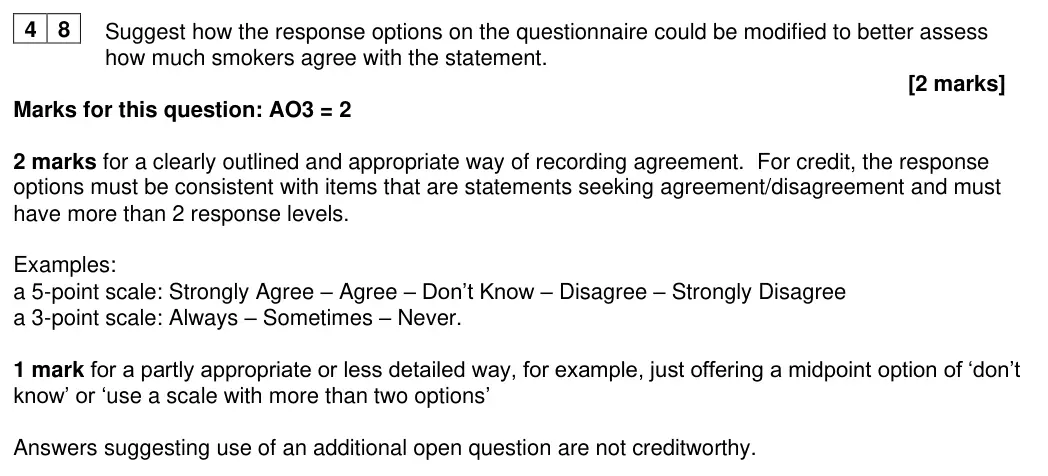
A social worker investigating nicotine addiction has devised a questionnaire for smokers
to complete.  The questionnaire consists of a series of statements about smoking, and
smokers have to indicate how much they agree with each statement.
One statement in the questionnaire is ‘Holding a cigarette makes me feel calm’.
The response options in the questionnaire are ‘Agree’ and ‘Disagree’.
Suggest how the response options in the questionnaire could be modified to better
assess how much smokers agree with the statement.
[2 marks]
June 2023 · AS Paper 1 · Q3.1 2 marks AO2=2 Research methods data handling
0 3
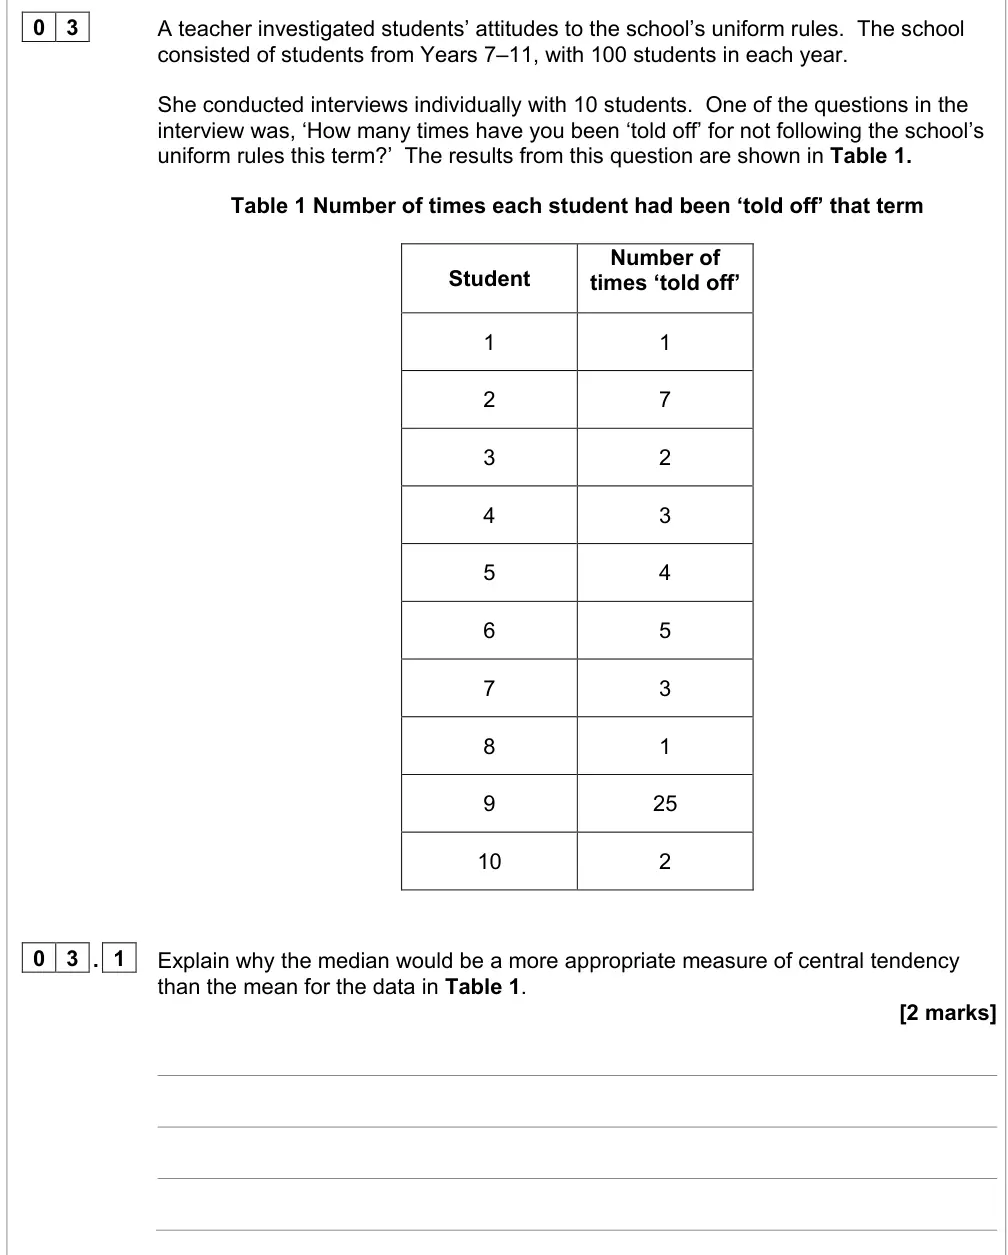
A teacher investigated students’ attitudes to the school’s uniform rules.  The school
consisted of students from Years 7–11, with 100 students in each year.
She conducted interviews individually with 10 students.  One of the questions in the
interview was, ‘How many times have you been ‘told off’ for not following the school’s
uniform rules this term?’  The results from this question are shown in Table 1.
Table 1 Number of times each student had been ‘told off’ that term
Number of
Student
times ‘told off’
1
1
2
7
3
2
4
3
5
4
6
5
7
3
8
1
9
25
10
2
0 3 . 1
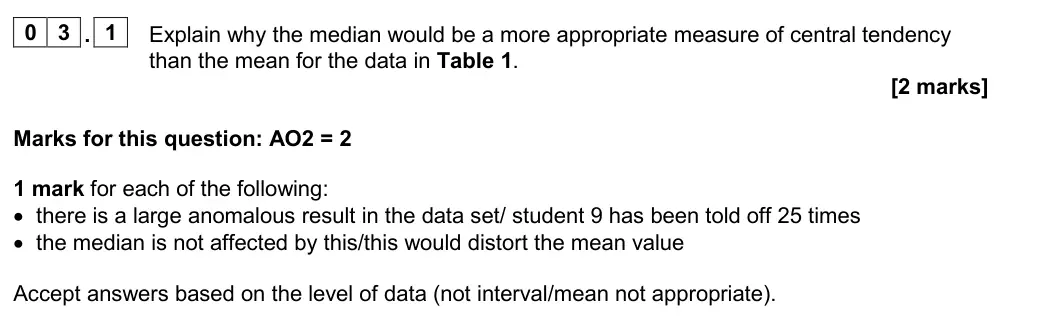
Explain why the median would be a more appropriate measure of central tendency
than the mean for the data in Table 1.
[2 marks]
June 2023 · AS Paper 1 · Q3.2 4 marks AO2=4 Research methods Medium scientific processes
0 3 . 2
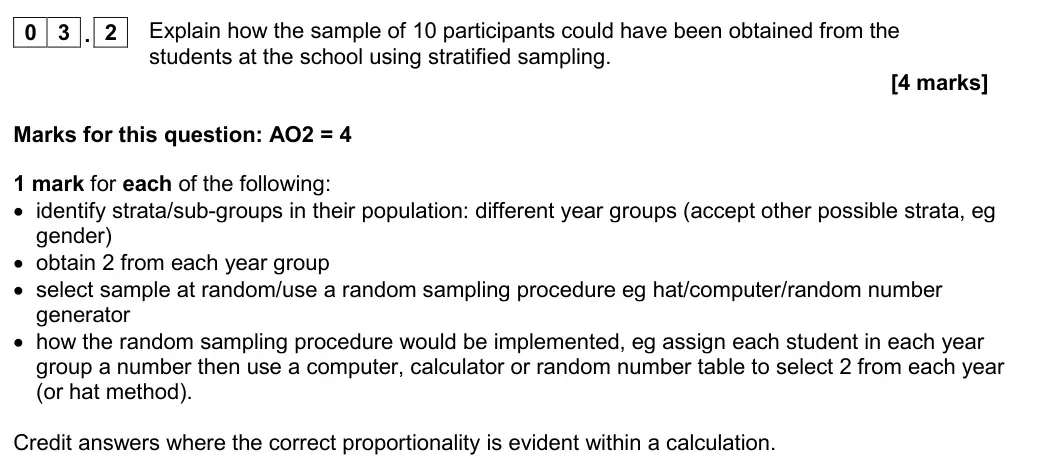
Explain how the sample of 10 participants could have been obtained from the
students at the school using stratified sampling.
[4 marks]
Extra space
June 2023 · AS Paper 1 · Q3.3 4 marks AO3=4 Research methods scientific processes
0 3 . 3
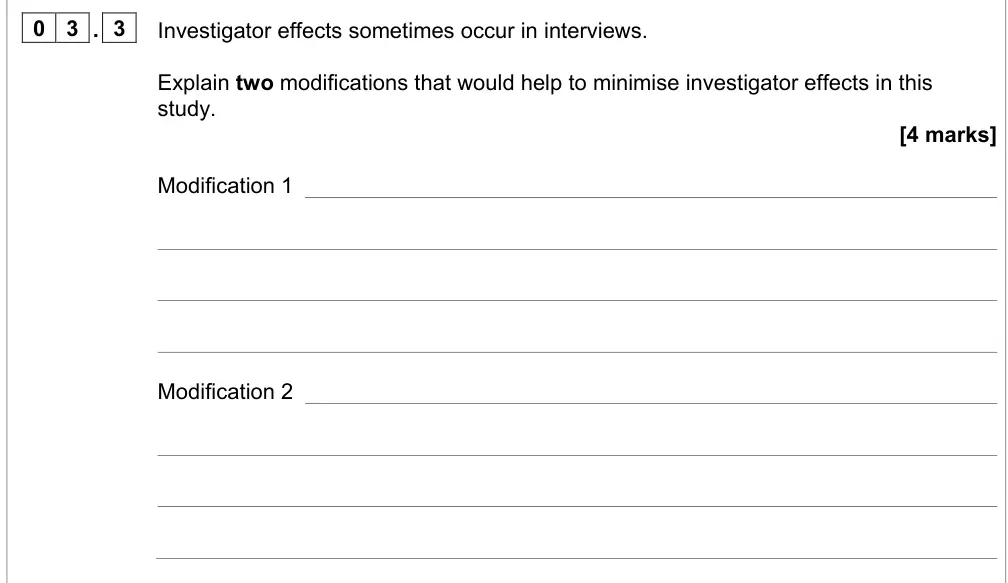
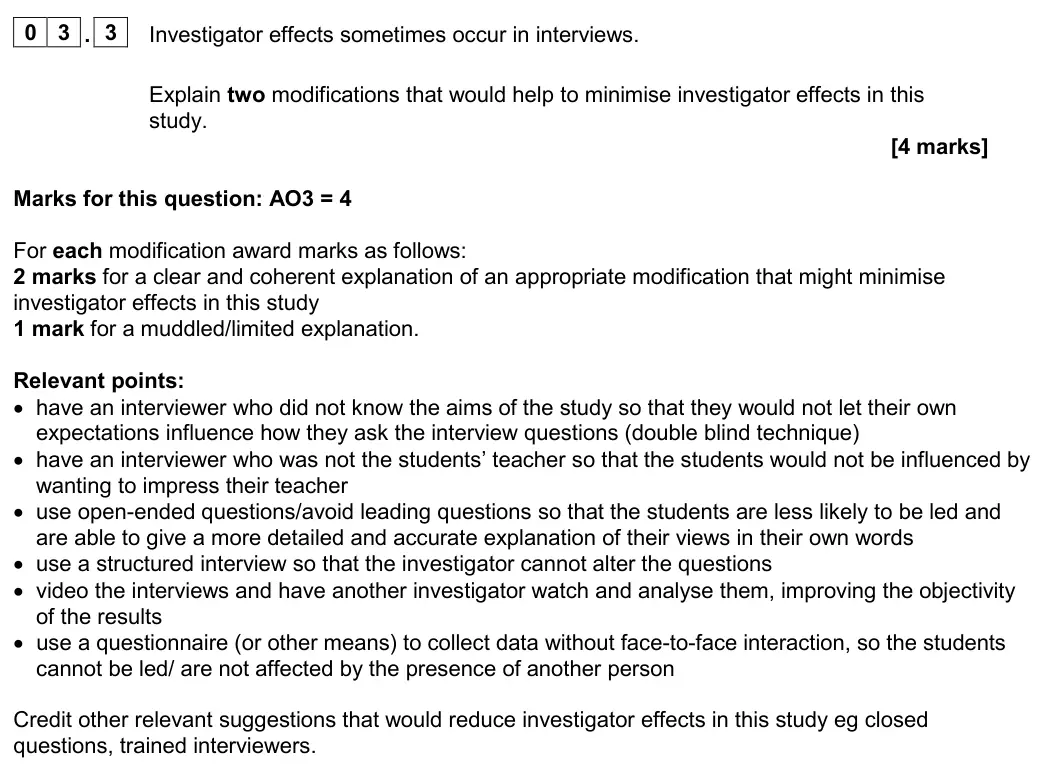
Investigator effects sometimes occur in interviews.
Explain two modifications that would help to minimise investigator effects in this
study.
[4 marks]
Modification 1
Modification 2
June 2023 · AS Paper 2 · Q6.3 4 marks AO3=4 Research methods scientific processes
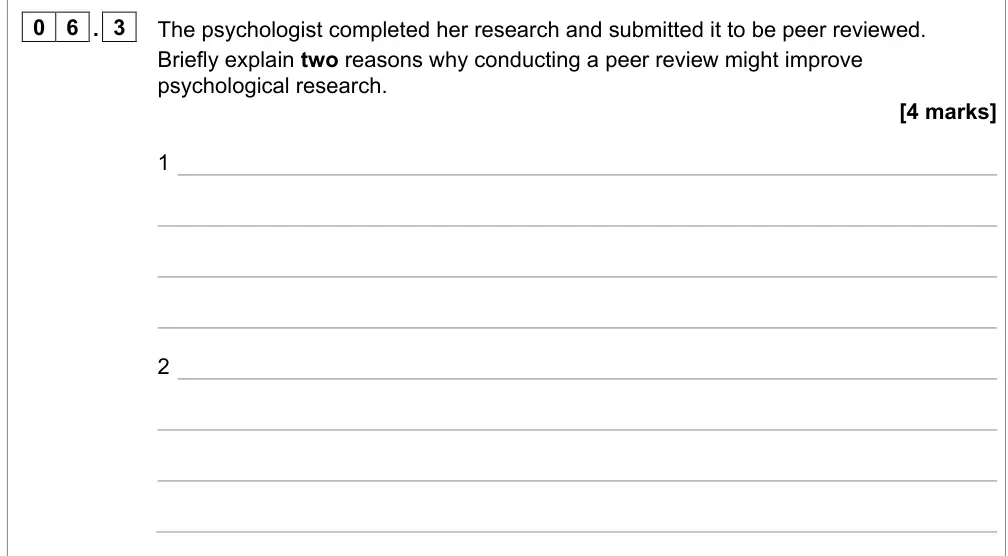
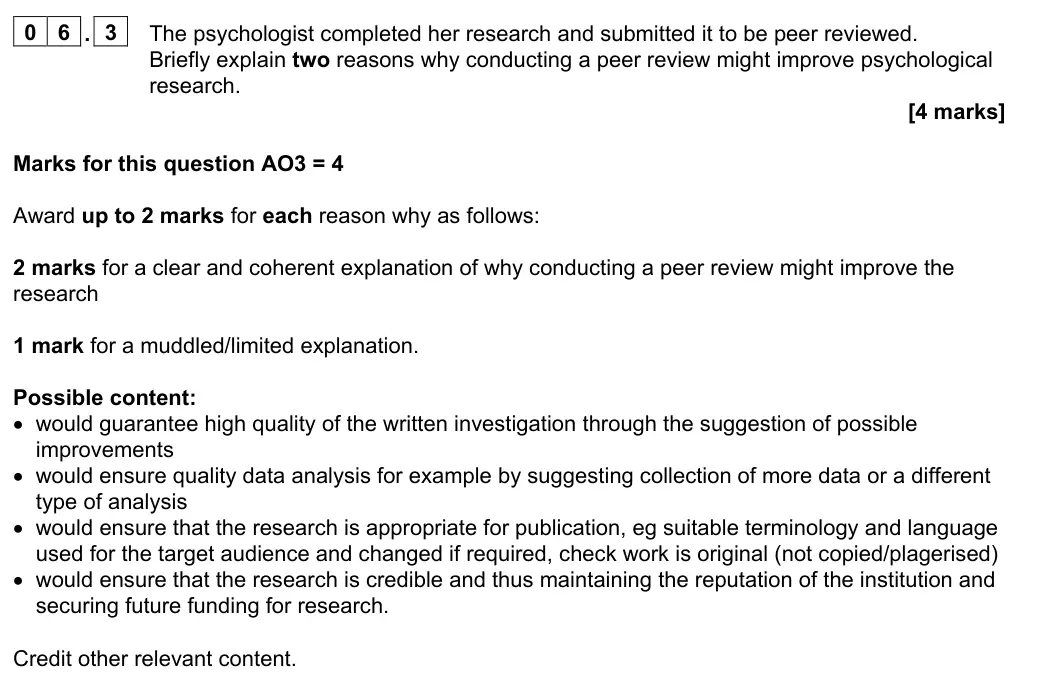
0 6 . 3
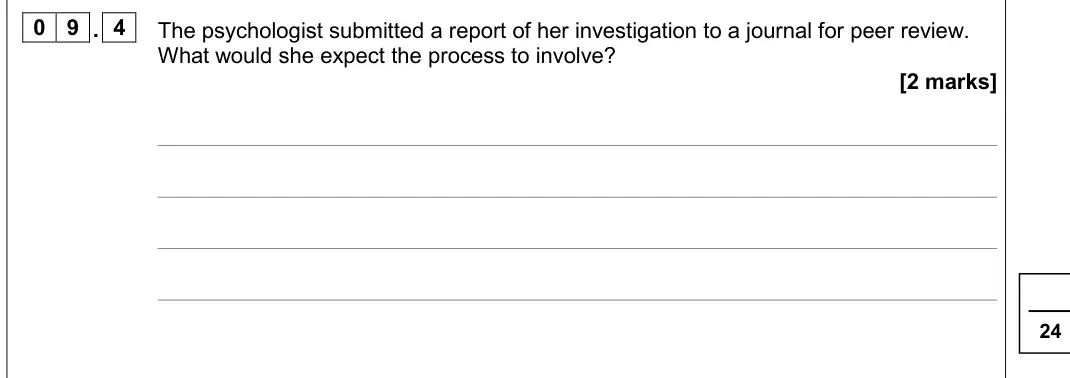
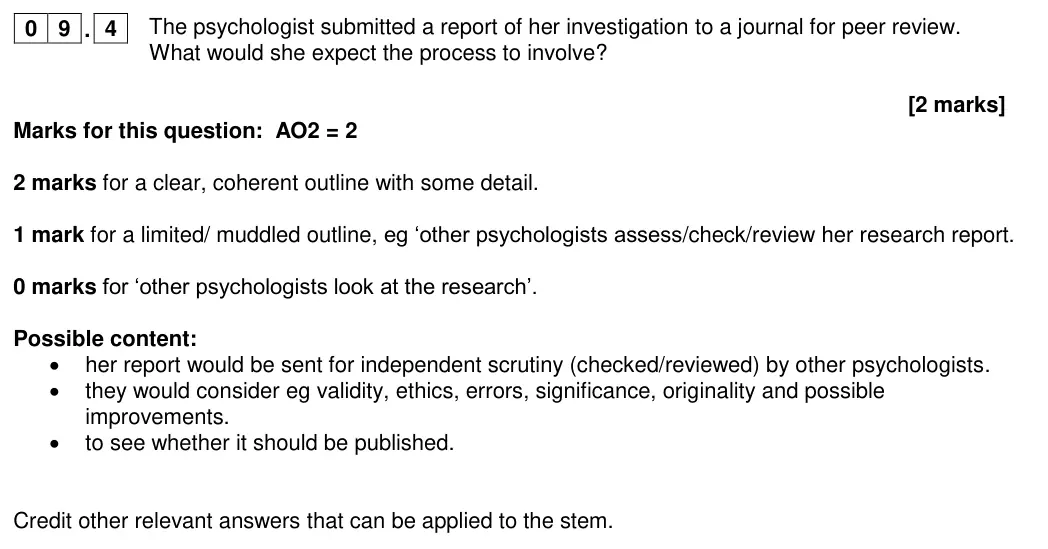
The psychologist completed her research and submitted it to be peer reviewed.
Briefly explain two reasons why conducting a peer review might improve
psychological research.
[4 marks]
1
2
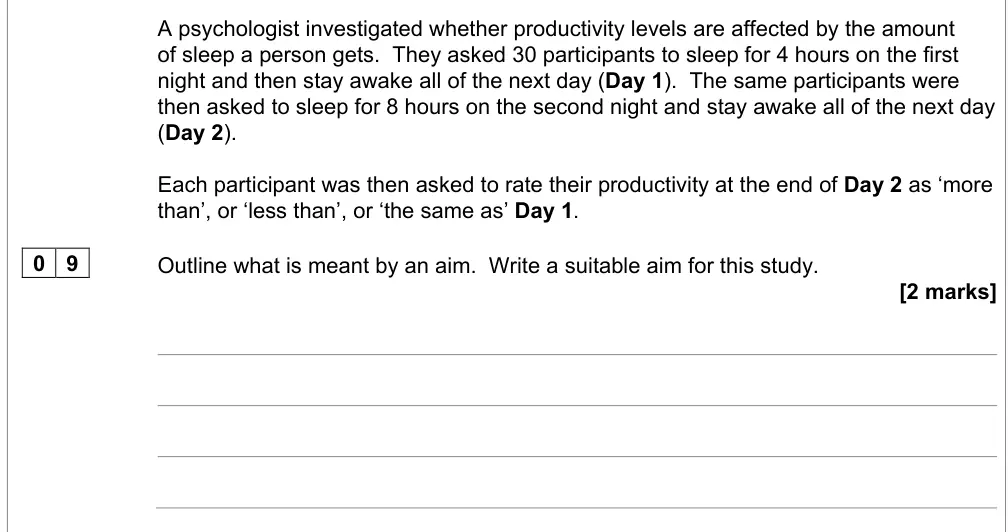
June 2023 · AS Paper 2 · Q9 2 marks AO1=1, AO2=1 Research methods Easy scientific processes
A psychologist investigated whether productivity levels are affected by the amount
of sleep a person gets.  They asked 30 participants to sleep for 4 hours on the first
night and then stay awake all of the next day (Day 1).  The same participants were
then asked to sleep for 8 hours on the second night and stay awake all of the next day
(Day 2).
Each participant was then asked to rate their productivity at the end of Day 2 as ‘more
than’, or ‘less than’, or ‘the same as’ Day 1.
0 9
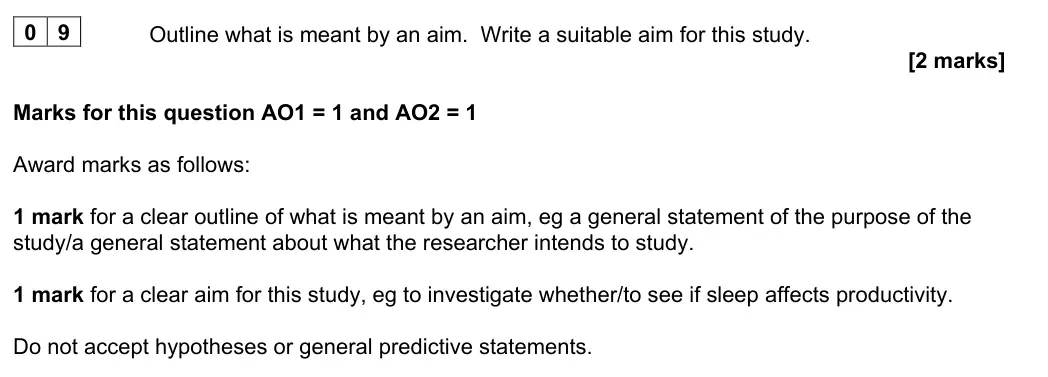
Outline what is meant by an aim.  Write a suitable aim for this study.
[2 marks]
June 2023 · AS Paper 2 · Q10 4 marks AO2=4 Research methods Hard inferential testingscientific processesdata handling
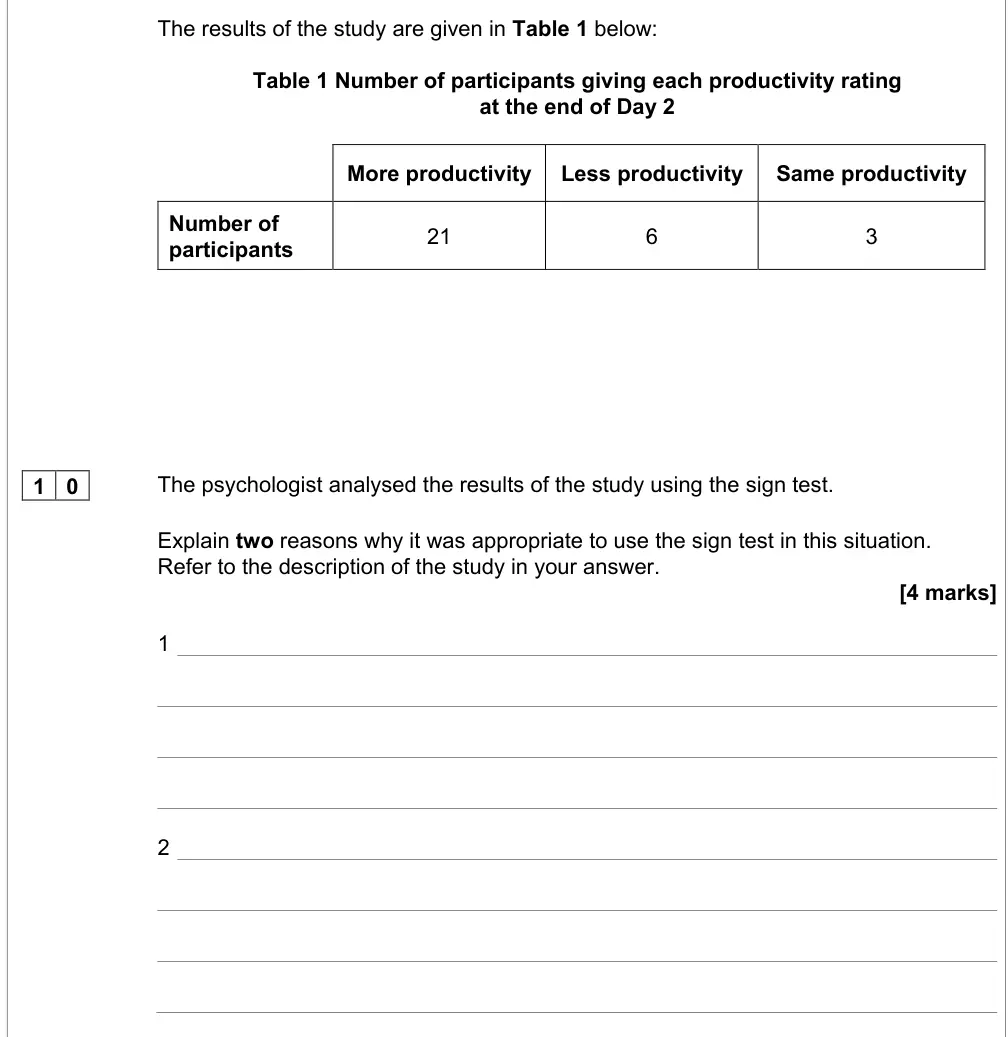
The results of the study are given in Table 1 below:
Table 1 Number of participants giving each productivity rating
at the end of Day 2
More productivity
Less productivity
Same productivity
Number of
21
6
3
participants
1 0
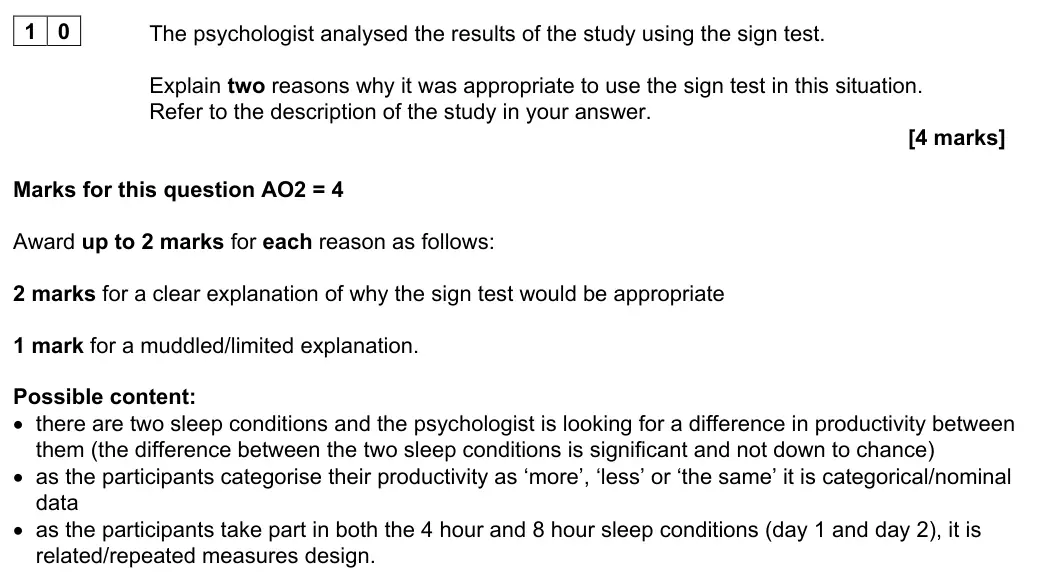
The psychologist analysed the results of the study using the sign test.
Explain two reasons why it was appropriate to use the sign test in this situation.
Refer to the description of the study in your answer.
[4 marks]
1
2
June 2023 · AS Paper 2 · Q12 2 marks AO3=2 Research methods scientific processes
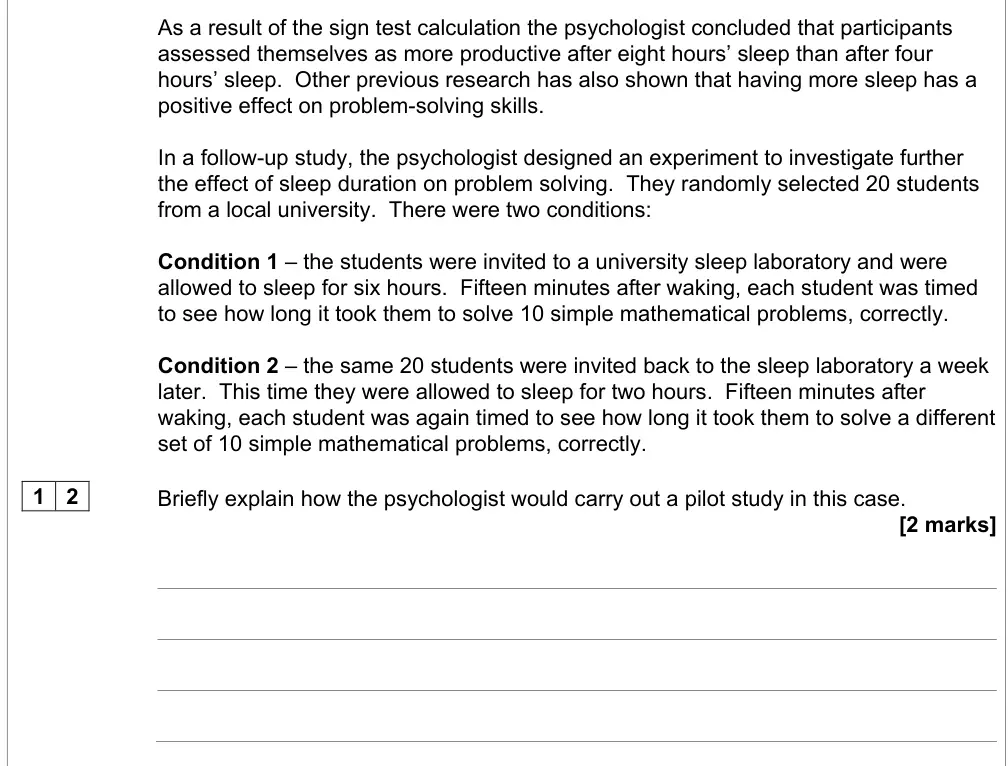
As a result of the sign test calculation the psychologist concluded that participants
assessed themselves as more productive after eight hours’ sleep than after four
hours’ sleep.  Other previous research has also shown that having more sleep has a
positive effect on problem-solving skills.
In a follow-up study, the psychologist designed an experiment to investigate further
the effect of sleep duration on problem solving.  They randomly selected 20 students
from a local university.  There were two conditions:
Condition 1 – the students were invited to a university sleep laboratory and were
allowed to sleep for six hours.  Fifteen minutes after waking, each student was timed
to see how long it took them to solve 10 simple mathematical problems, correctly.
Condition 2 – the same 20 students were invited back to the sleep laboratory a week
later.  This time they were allowed to sleep for two hours.  Fifteen minutes after
waking, each student was again timed to see how long it took them to solve a different
set of 10 simple mathematical problems, correctly.
1 2
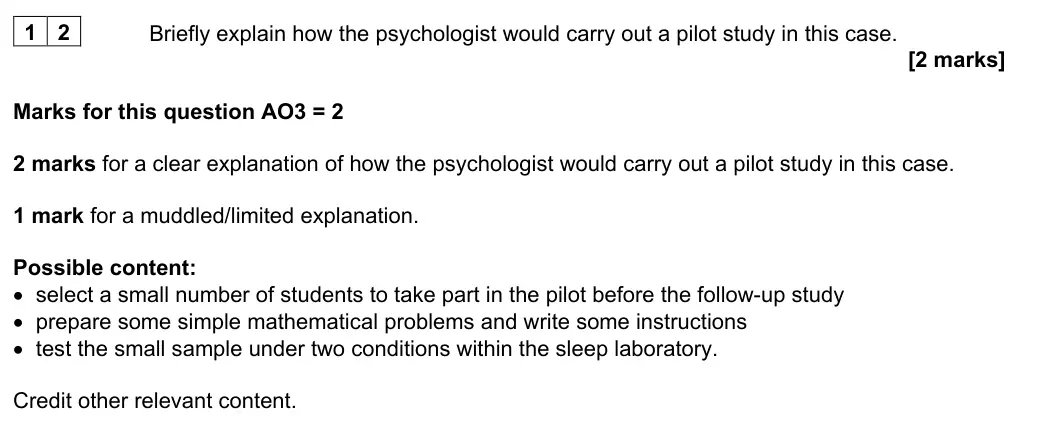
Briefly explain how the psychologist would carry out a pilot study in this case.
[2 marks]
June 2023 · AS Paper 2 · Q13 2 marks AO2=2 Research methods Easy scientific processes
1 3
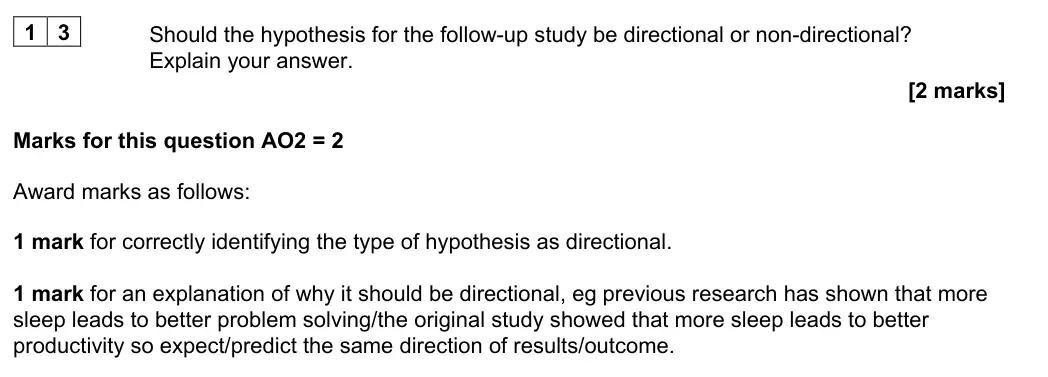
Should the hypothesis for the follow-up study be directional or non-directional?
Explain your answer.
[2 marks]
June 2023 · AS Paper 2 · Q14 3 marks AO2=3 Research methods Hard scientific processes
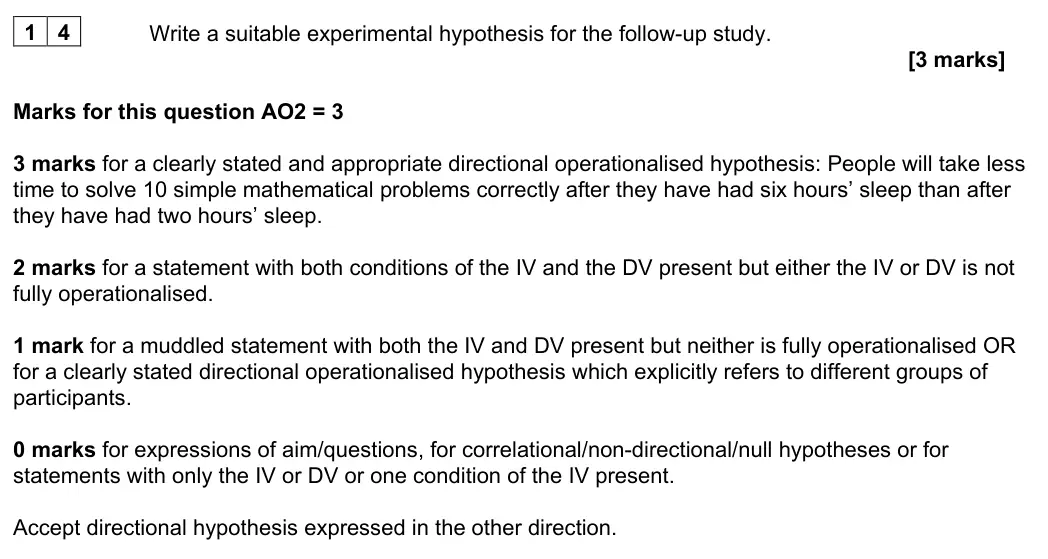
1 4
Write a suitable experimental hypothesis for the follow-up study.
[3 marks]
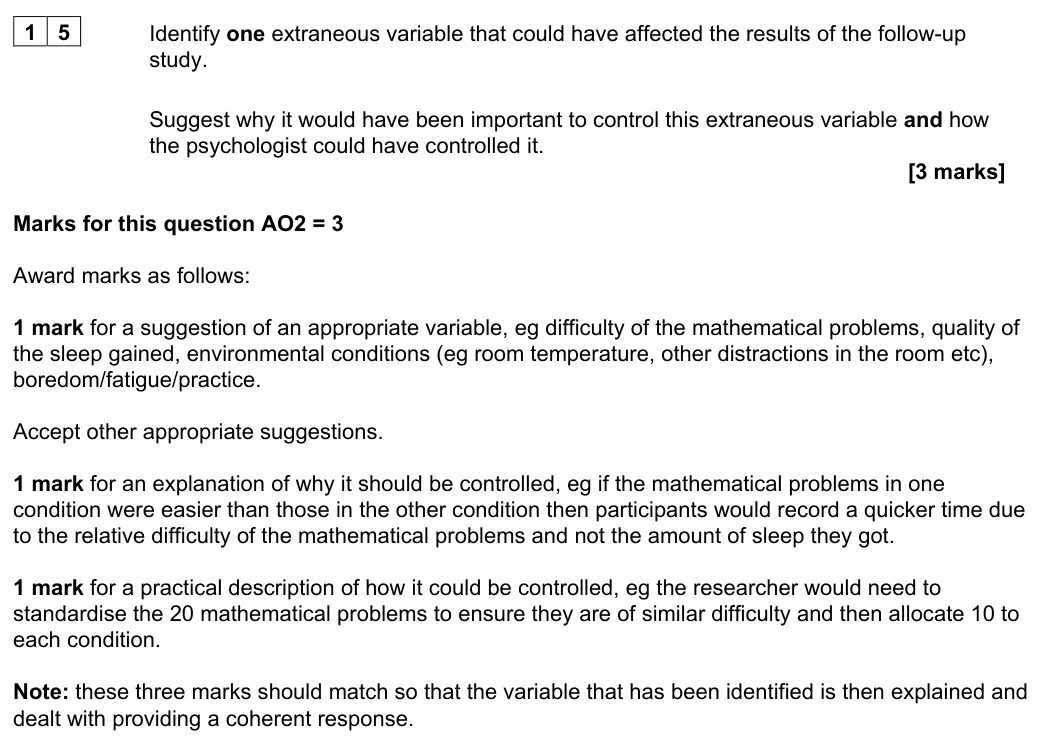
June 2023 · AS Paper 2 · Q15 3 marks AO2=3 Research methods scientific processes
1 5
Identify one extraneous variable that could have affected the results of the follow-up
study.
Suggest why it would have been important to control this extraneous variable and
how the psychologist could have controlled it.
[3 marks]
June 2023 · AS Paper 2 · Q16 3 marks AO2=3 Research methods scientific processes
1 6
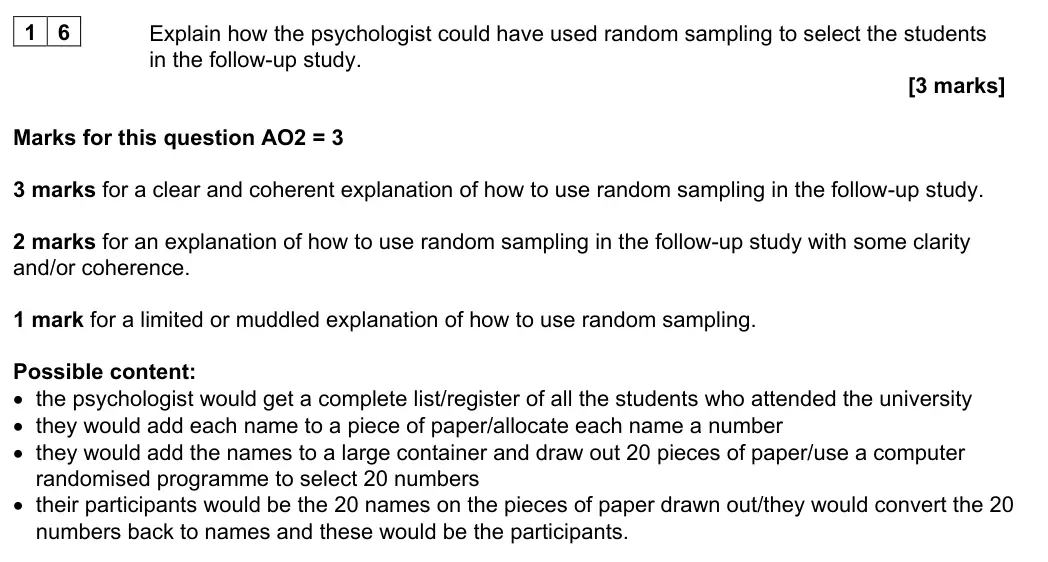
Explain how the psychologist could have used random sampling to select the students
in the follow-up study.
[3 marks]
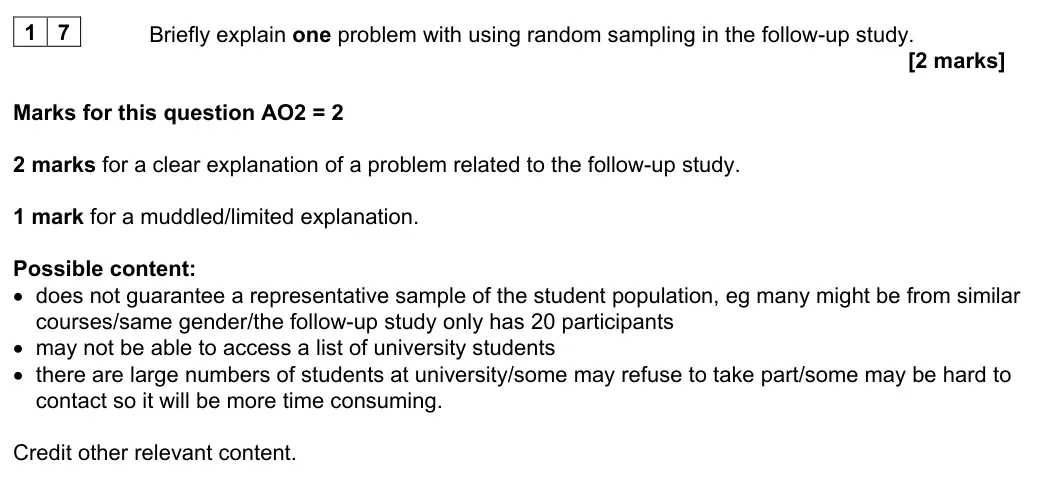
June 2023 · AS Paper 2 · Q17 2 marks AO2=2 Research methods scientific processes
1 7
Briefly explain one problem with using random sampling in the follow-up study.
[2 marks]
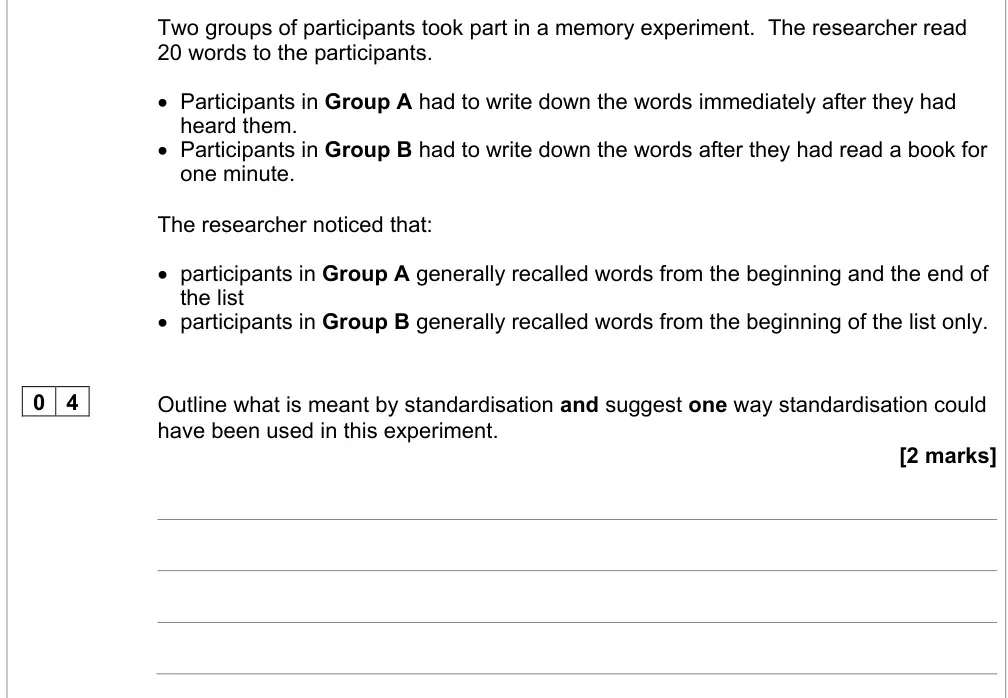
June 2023 · Paper 1 · Q4 2 marks AO1=1, AO2=1 Research methods Medium scientific processes
Two groups of participants took part in a memory experiment.  The researcher read
20 words to the participants.
• Participants in Group A had to write down the words immediately after they had
heard them.
• Participants in Group B had to write down the words after they had read a book for
one minute.
The researcher noticed that:
• participants in Group A generally recalled words from the beginning and the end of
the list
• participants in Group B generally recalled words from the beginning of the list only.
0 4
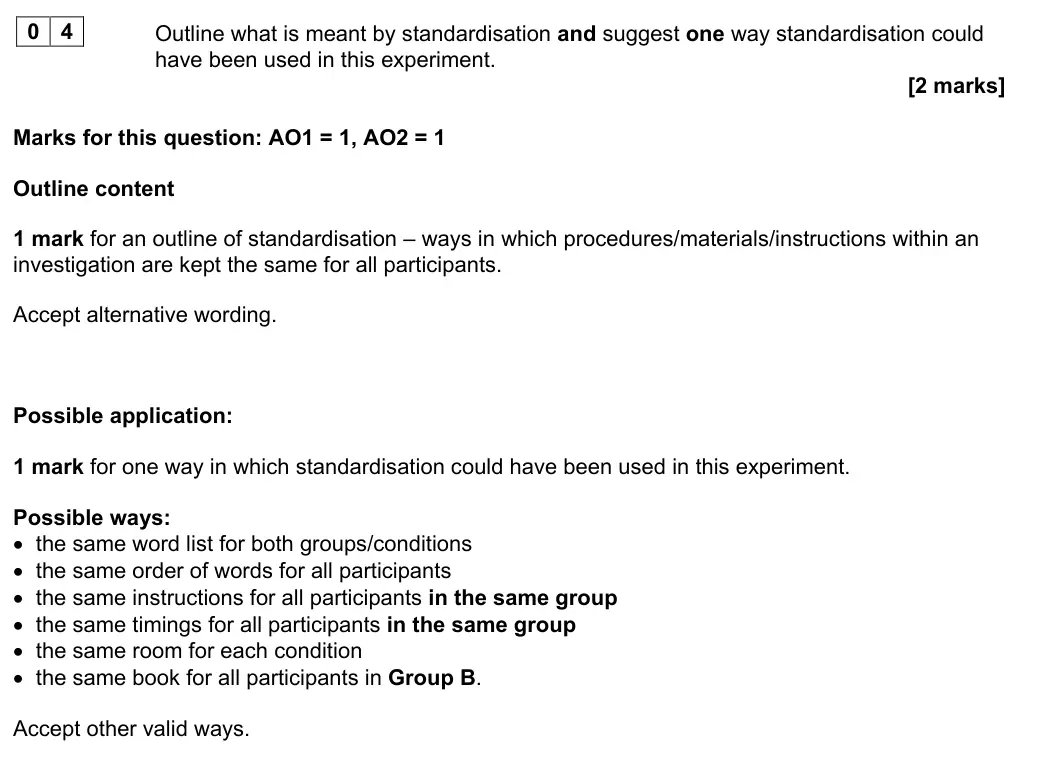
Outline what is meant by standardisation and suggest one way standardisation could
have been used in this experiment.
[2 marks]
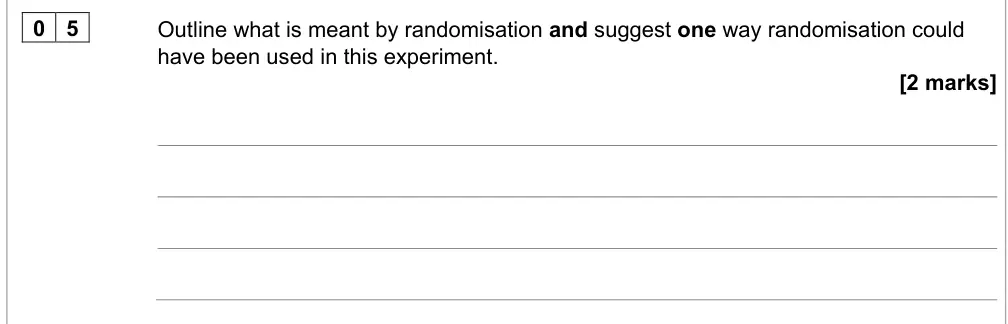
June 2023 · Paper 1 · Q5 2 marks AO1=1, AO2=1 Research methods scientific processes
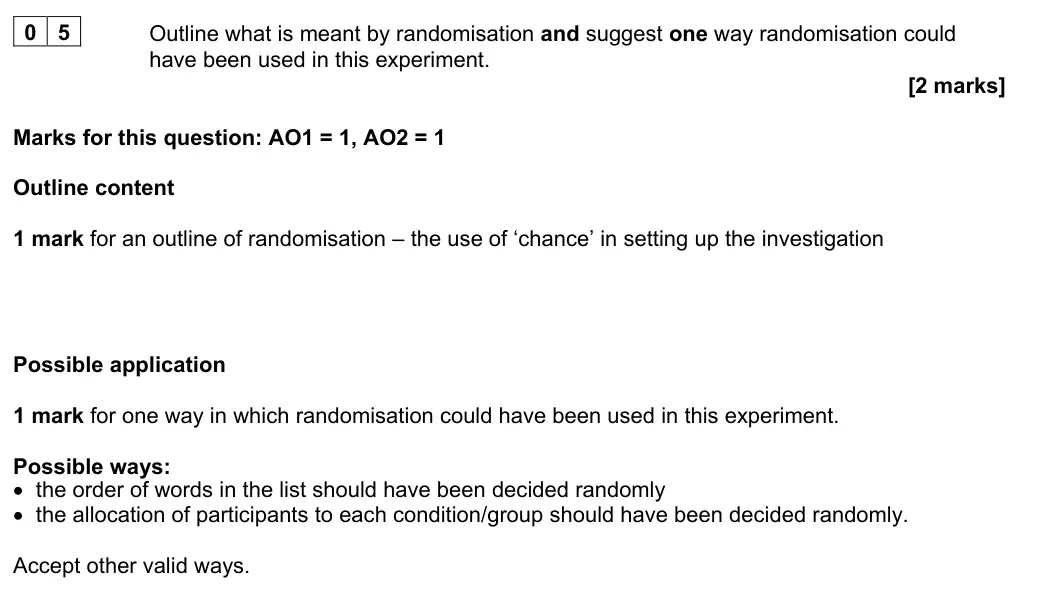
0 5
Outline what is meant by randomisation and suggest one way randomisation could
have been used in this experiment.
[2 marks]
June 2023 · Paper 1 · Q13 1 mark AO1=1 Research methods research methodsdata handling
1 3
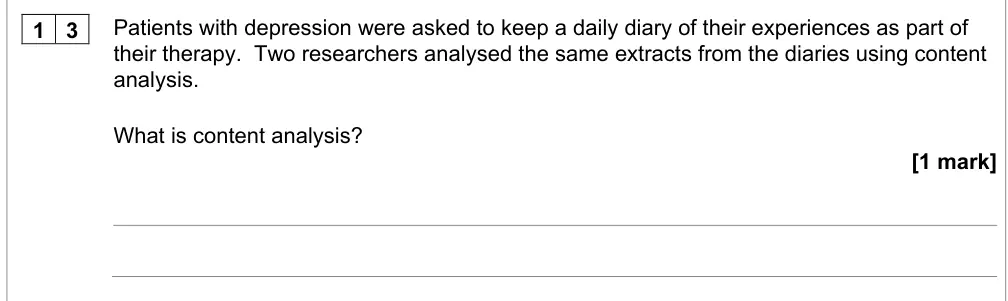
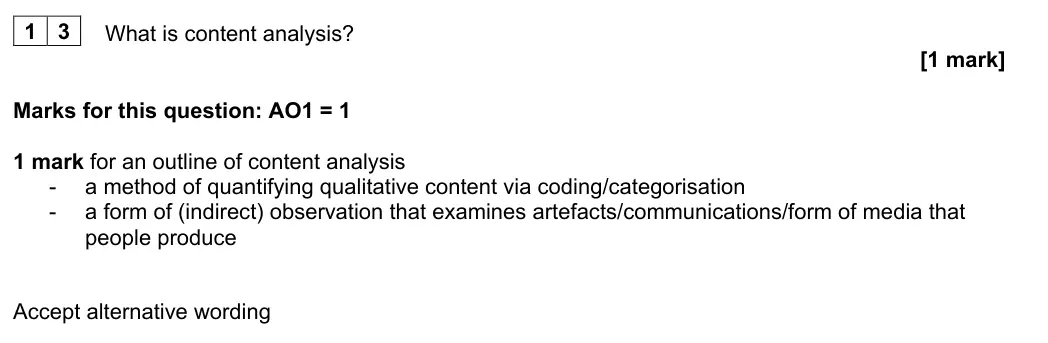
Patients with depression were asked to keep a daily diary of their experiences as part of
their therapy.  Two researchers analysed the same extracts from the diaries using content
analysis.
What is content analysis?
[1 mark]
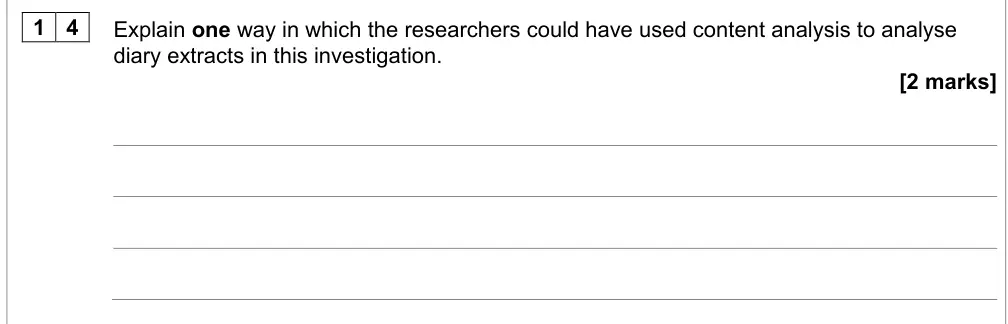
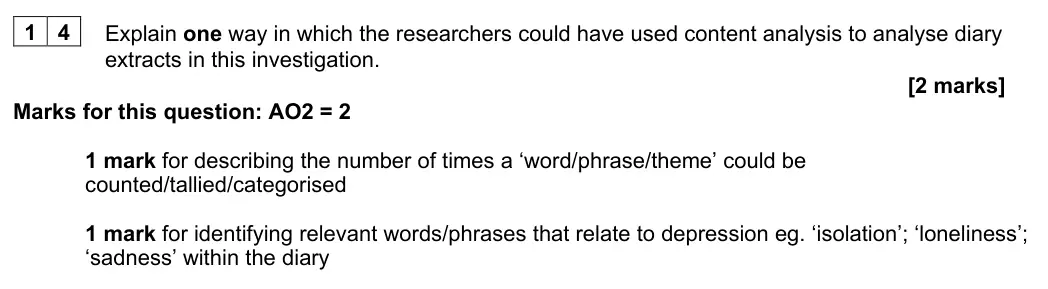
June 2023 · Paper 1 · Q14 2 marks AO2=2 Research methods data handlingresearch methods
1 4
Explain one way in which the researchers could have used content analysis to analyse
diary extracts in this investigation.
[2 marks]
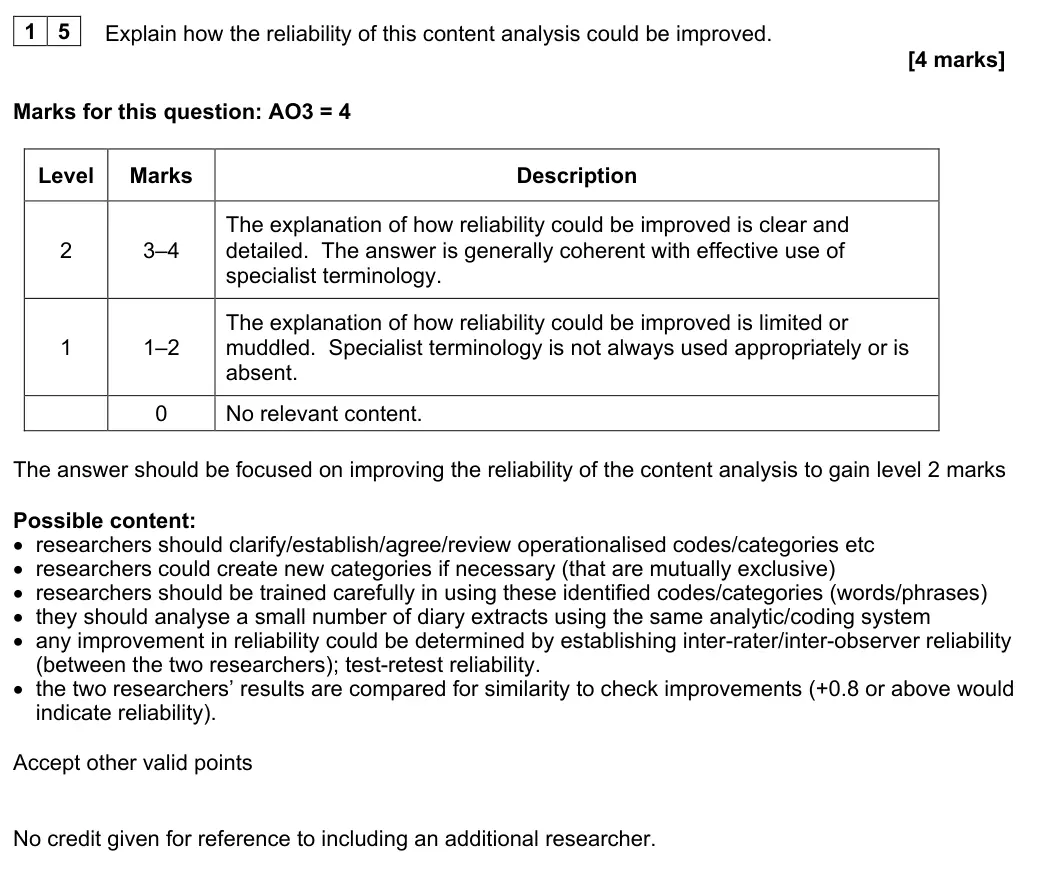
June 2023 · Paper 1 · Q15 4 marks AO3=4 Research methods scientific processesdata handling
The two researchers’ analyses of the diary extracts were found to be quite different.
1 5
Explain how the reliability of this content analysis could be improved.
[4 marks]
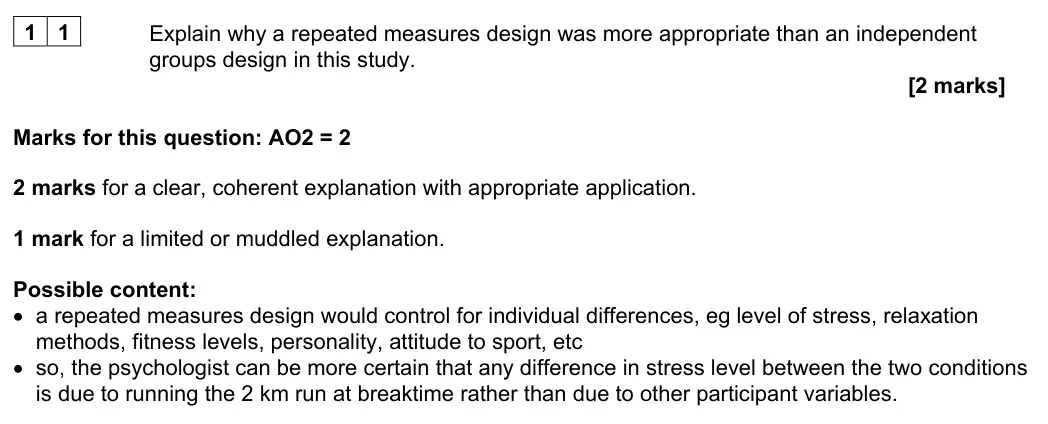
June 2023 · Paper 2 · Q11 2 marks AO2=2 Research methods scientific processes
1 1
Explain why a repeated measures design was more appropriate than an independent
groups design in this study.
[2 marks]
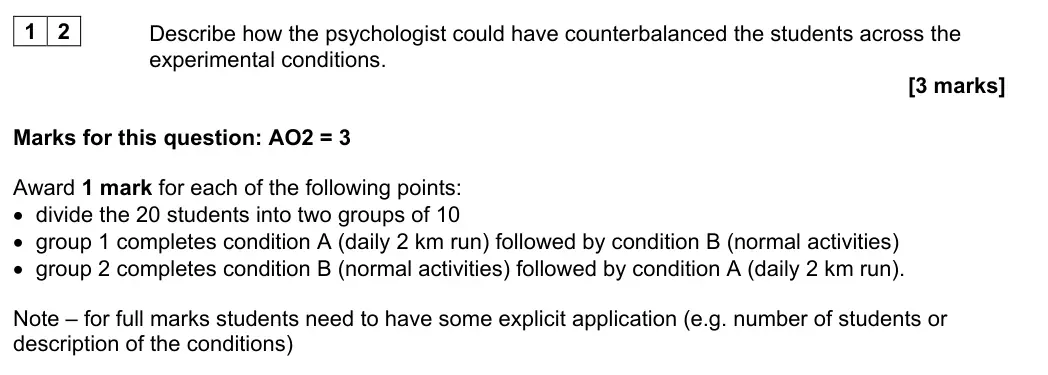
June 2023 · Paper 2 · Q12 3 marks AO2=3 Research methods scientific processes
To improve the validity of the findings, the psychologist counterbalanced the students
across the experimental conditions.
1 2
Describe how the psychologist could have counterbalanced the students across the
experimental conditions.
[3 marks]
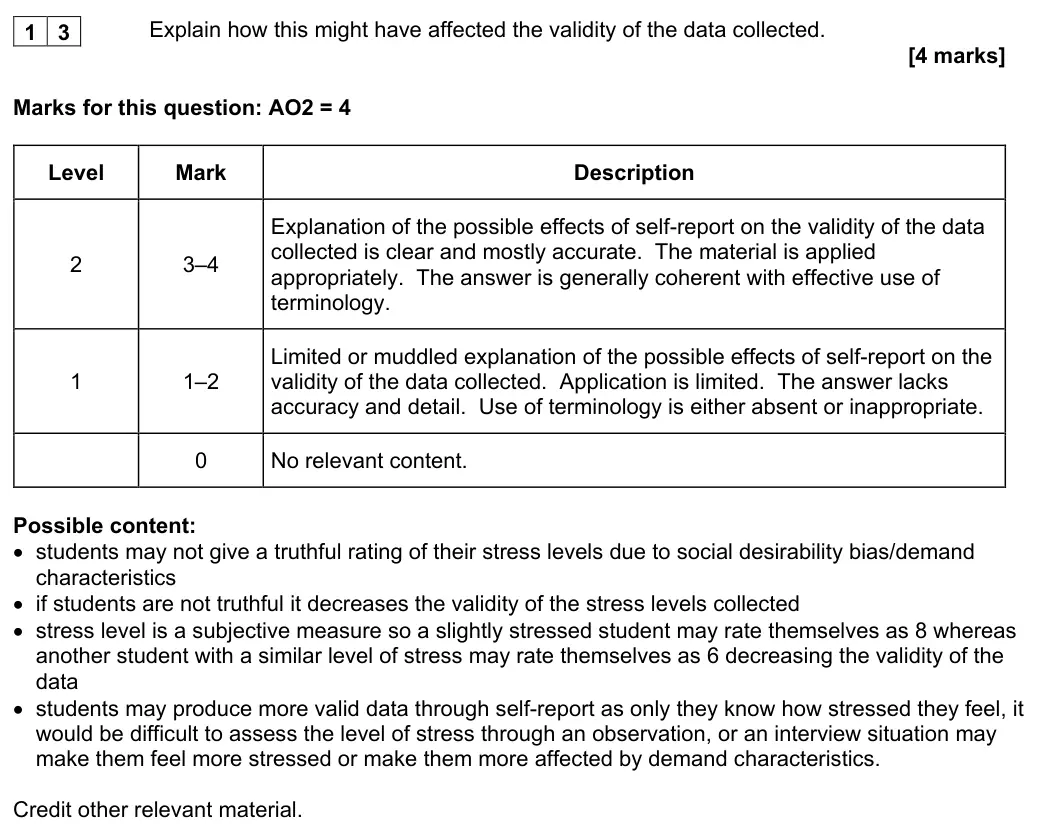
June 2023 · Paper 2 · Q13 4 marks AO2=4 Research methods research methodsscientific processes
Students self-reported their stress levels on a scale of 1–10.
1 3
Explain how this might have affected the validity of the data collected.
[4 marks]
June 2023 · Paper 2 · Q14 4 marks AO2=4 Research methods data handling
1 4
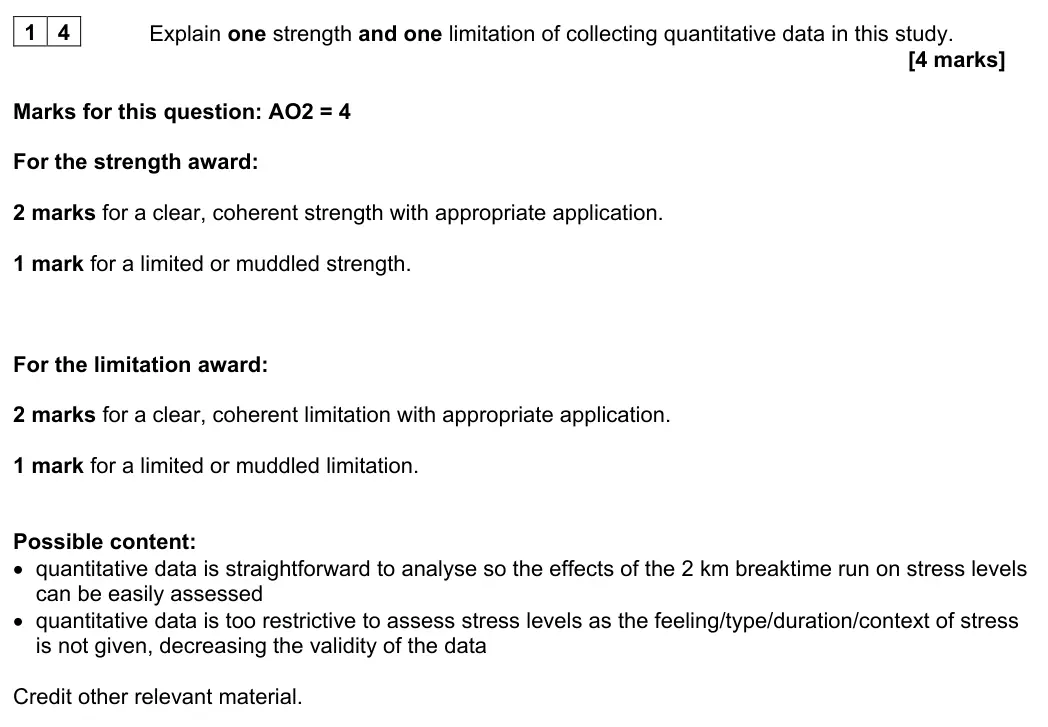
Explain one strength and one limitation of collecting quantitative data in this study.
[4 marks]
June 2023 · Paper 2 · Q15 4 marks AO2=2, AO3=2 Research methods data handling
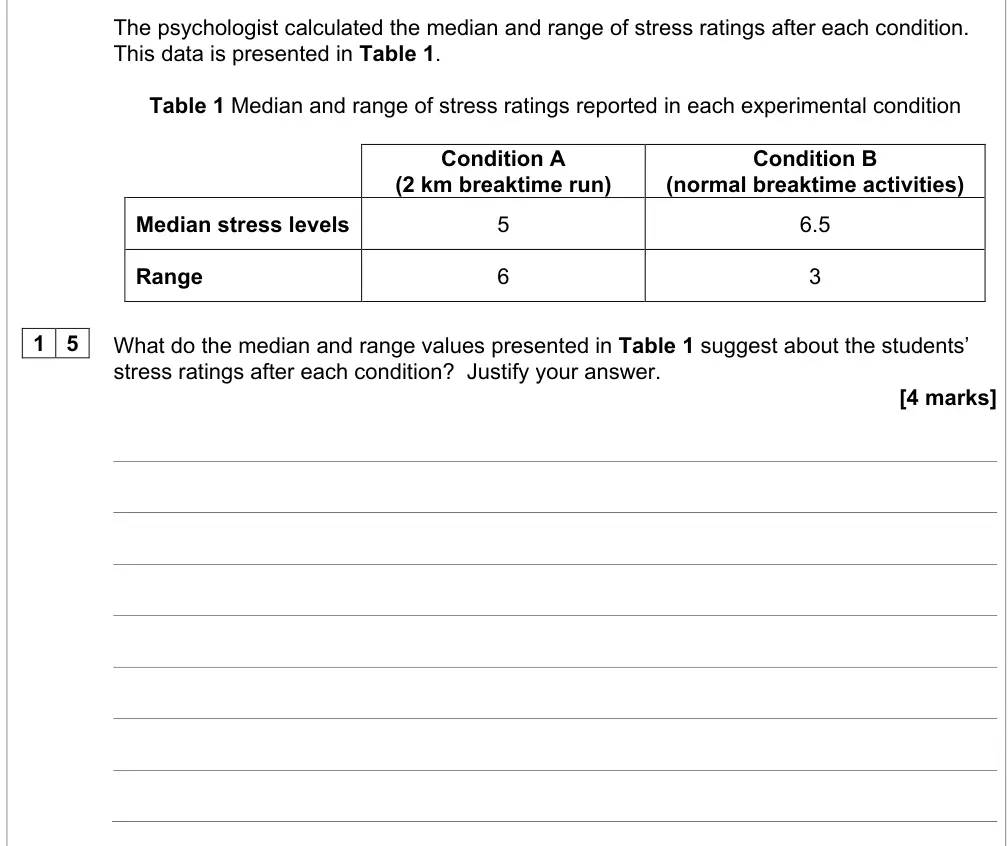
The psychologist calculated the median and range of stress ratings after each condition.
This data is presented in Table 1.
Table 1 Median and range of stress ratings reported in each experimental condition
Condition A
Condition B
(2 km breaktime run)
(normal breaktime activities)
Median stress levels
5
6.5
Range
6
3
1 5
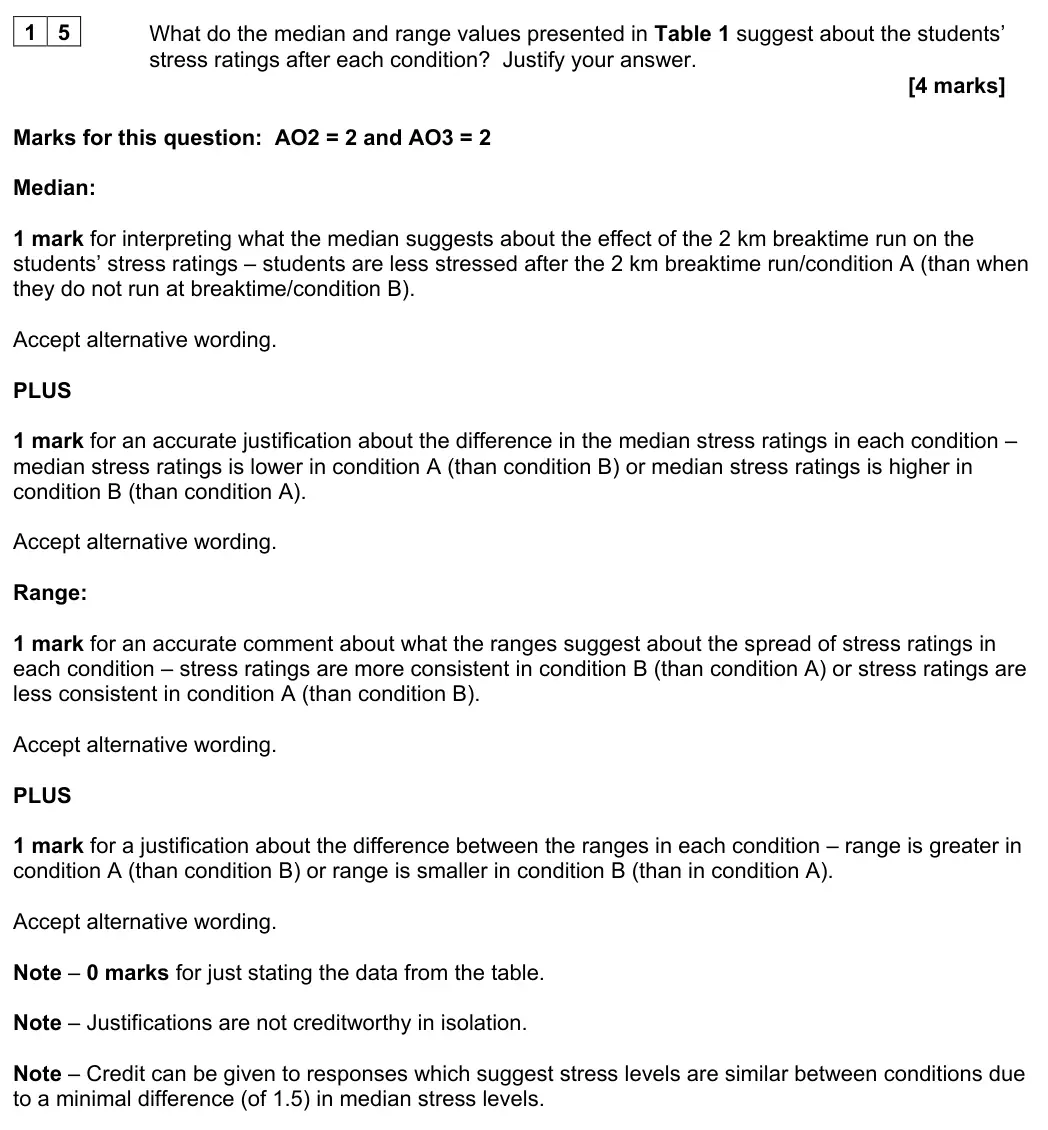
What do the median and range values presented in Table 1 suggest about the students’
stress ratings after each condition?  Justify your answer.
[4 marks]
June 2023 · Paper 2 · Q16 4 marks AO2=4 Research methods data handling
1 6
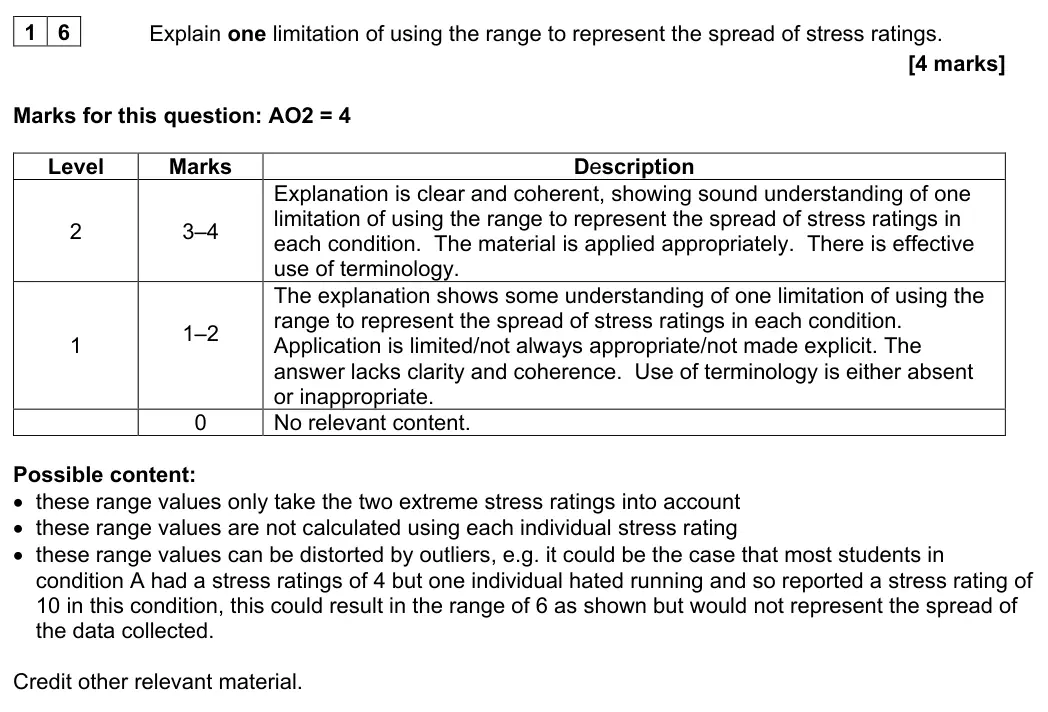
Explain one limitation of using the range to represent the spread of stress ratings.
[4 marks]
June 2023 · Paper 2 · Q17 2 marks AO1=1, AO2=1 Research methods inferential testing
A Wilcoxon test was used to determine whether differences in stress ratings were
significant.  The psychologist used a 0.01 level of significance.
1 7
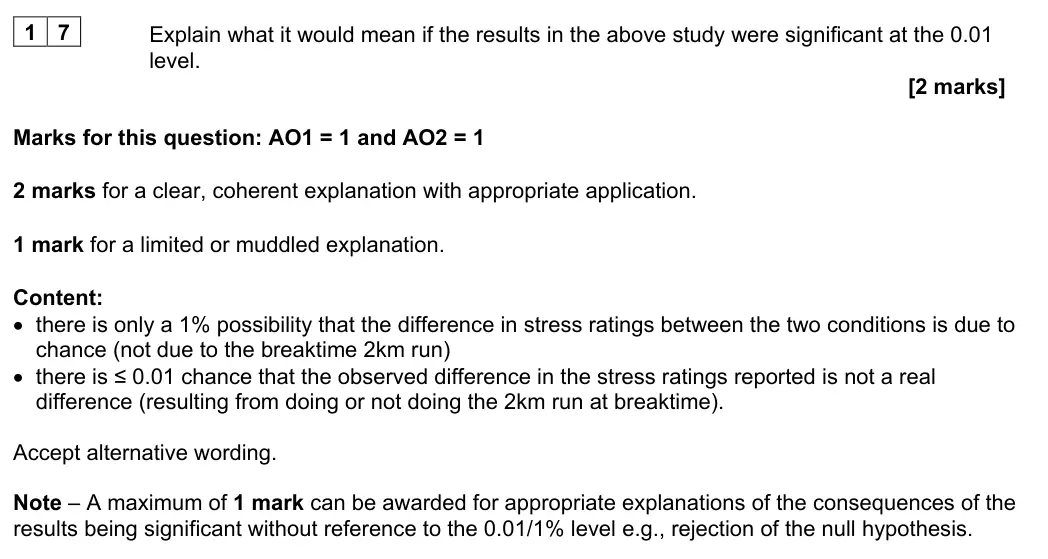
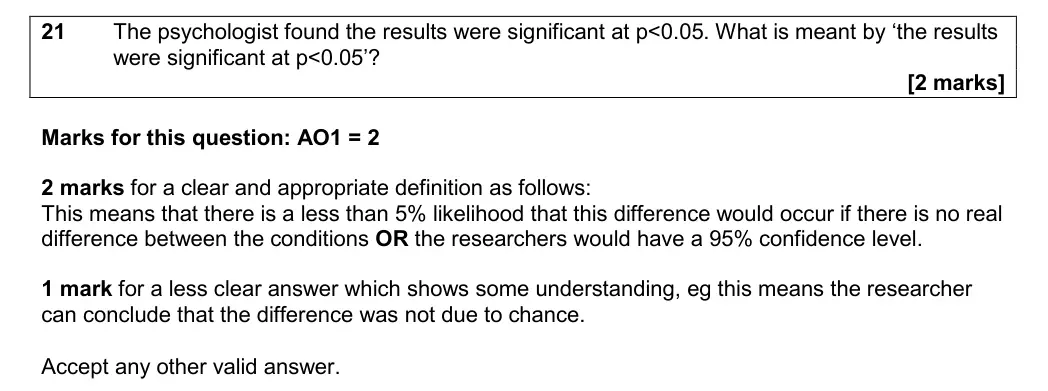
Explain what it would mean if the results in the above study were significant at the
0.01 level.
[2 marks]
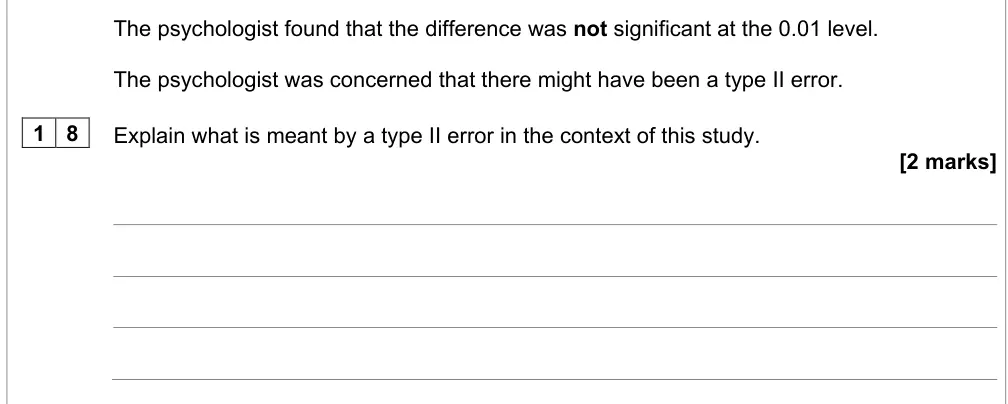
June 2023 · Paper 2 · Q18 2 marks AO1=1, AO2=1 Research methods inferential testing
The psychologist found that the difference was not significant at the 0.01 level.
The psychologist was concerned that there might have been a type II error.
1 8
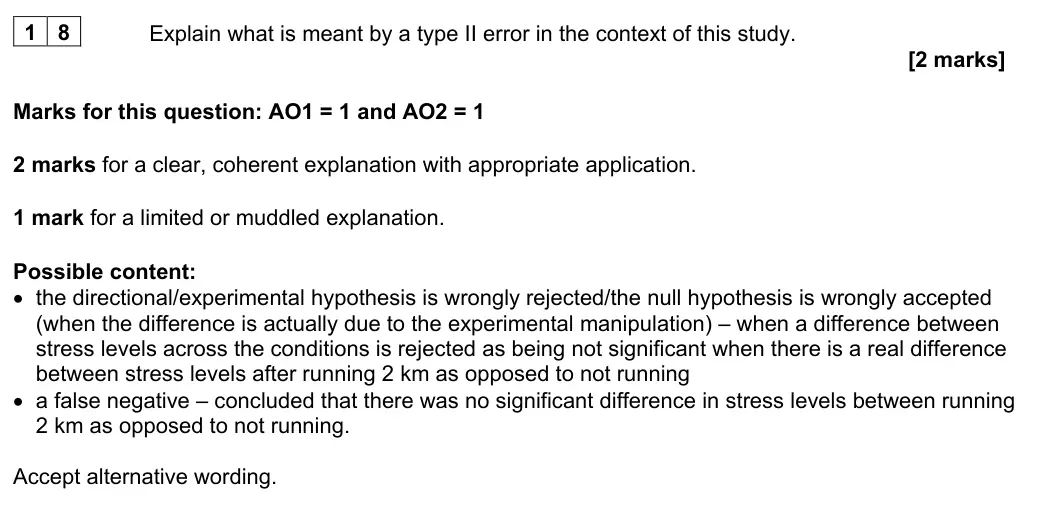
Explain what is meant by a type II error in the context of this study.
[2 marks]
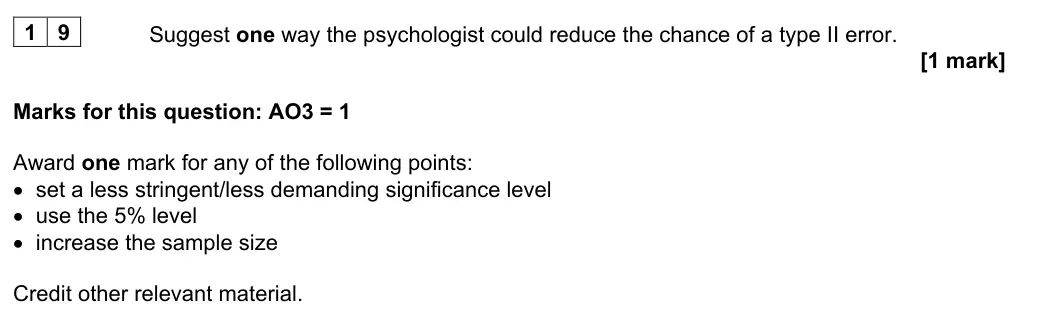
June 2023 · Paper 2 · Q19 1 mark AO3=1 Research methods Hard inferential testing
1 9
Suggest one way the psychologist could reduce the chance of a type II error.
[1 mark]
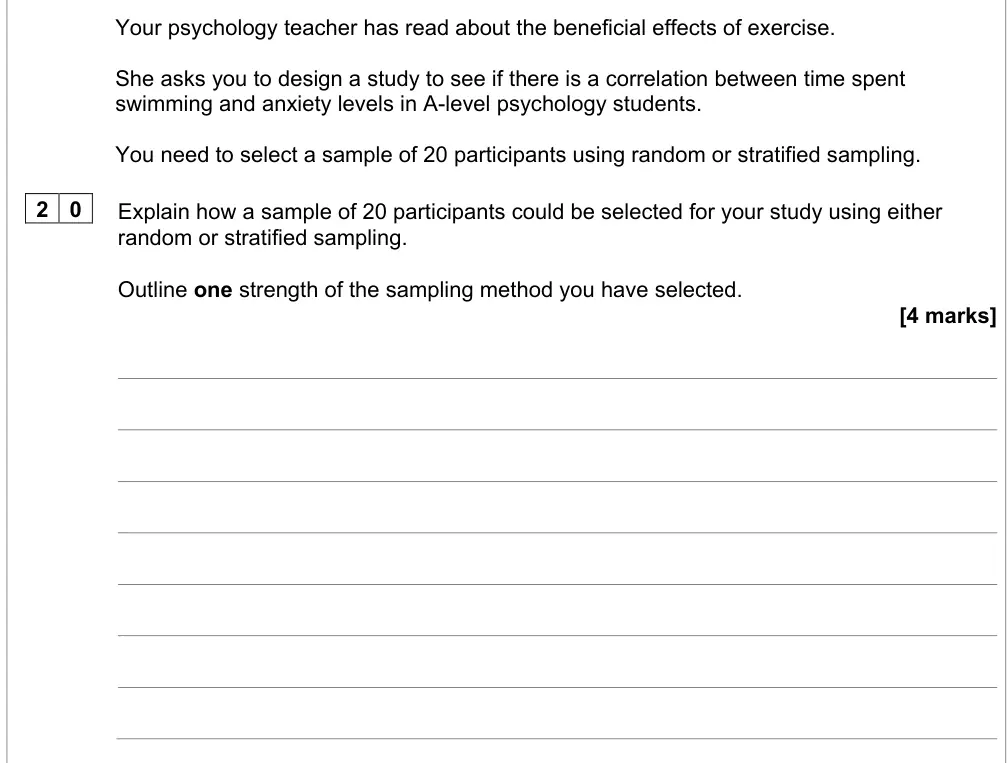
June 2023 · Paper 2 · Q20 4 marks AO2=2, AO3=2 Research methods scientific processes
Your psychology teacher has read about the beneficial effects of exercise.
She asks you to design a study to see if there is a correlation between time spent
swimming and anxiety levels in A-level psychology students.
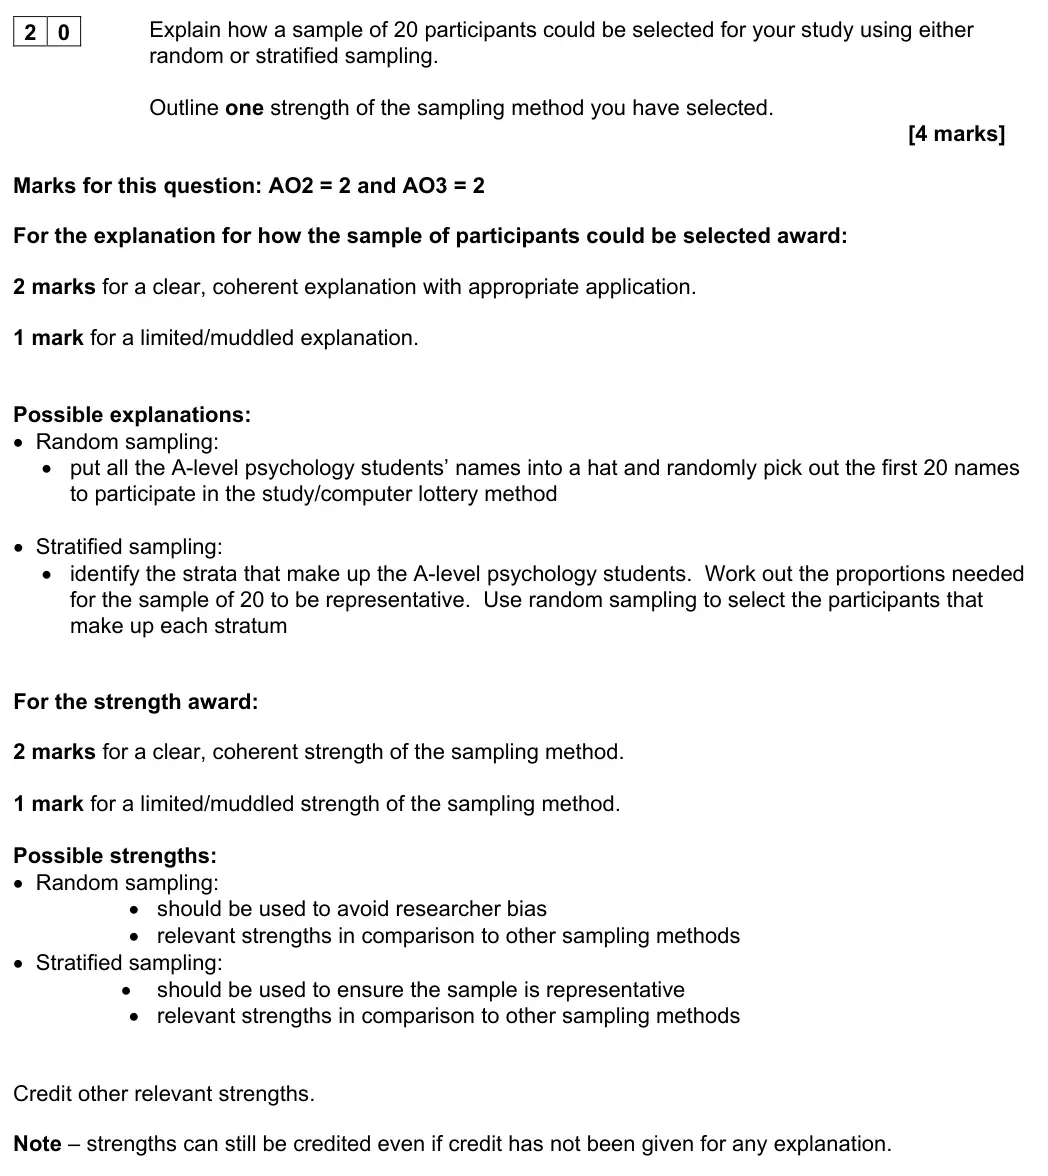
You need to select a sample of 20 participants using random or stratified sampling.
2 0
Explain how a sample of 20 participants could be selected for your study using either
random or stratified sampling.
Outline one strength of the sampling method you have selected.
[4 marks]
June 2023 · Paper 2 · Q21 4 marks AO2=2, AO3=2 Research methods Medium scientific processesresearch methods
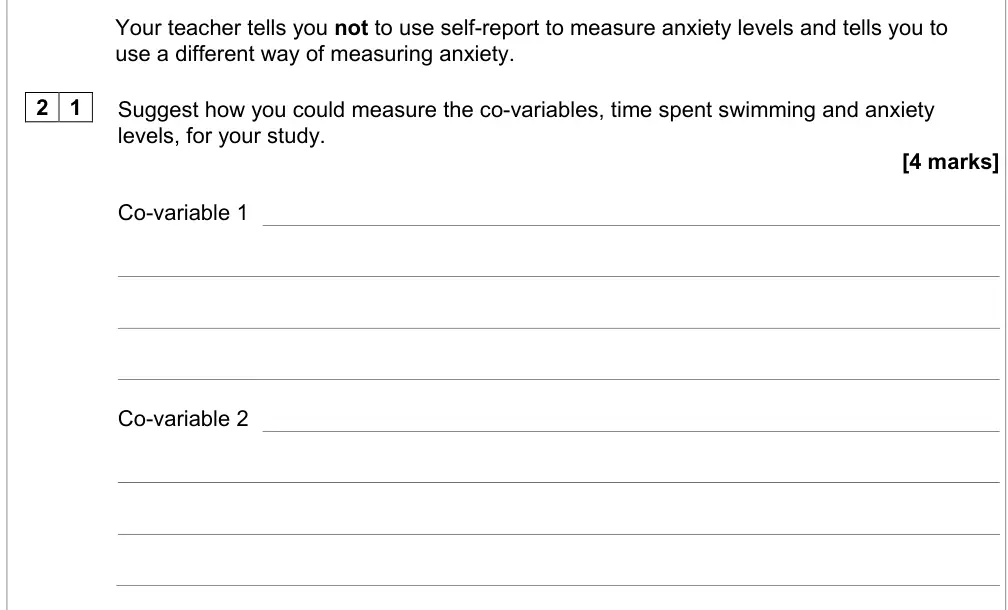
Your teacher tells you not to use self-report to measure anxiety levels and tells you to
use a different way of measuring anxiety.
2 1
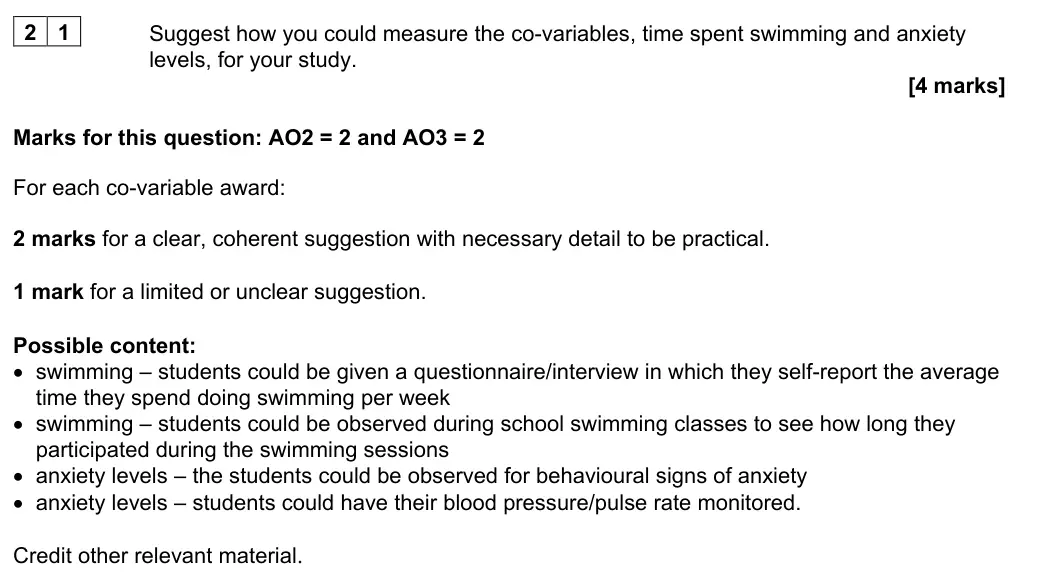
Suggest how you could measure the co-variables, time spent swimming and anxiety
levels, for your study.
[4 marks]
Co-variable 1
Co-variable 2
June 2023 · Paper 2 · Q22 5 marks AO2=4, AO3=1 Research methods inferential testingdata handling
2 2
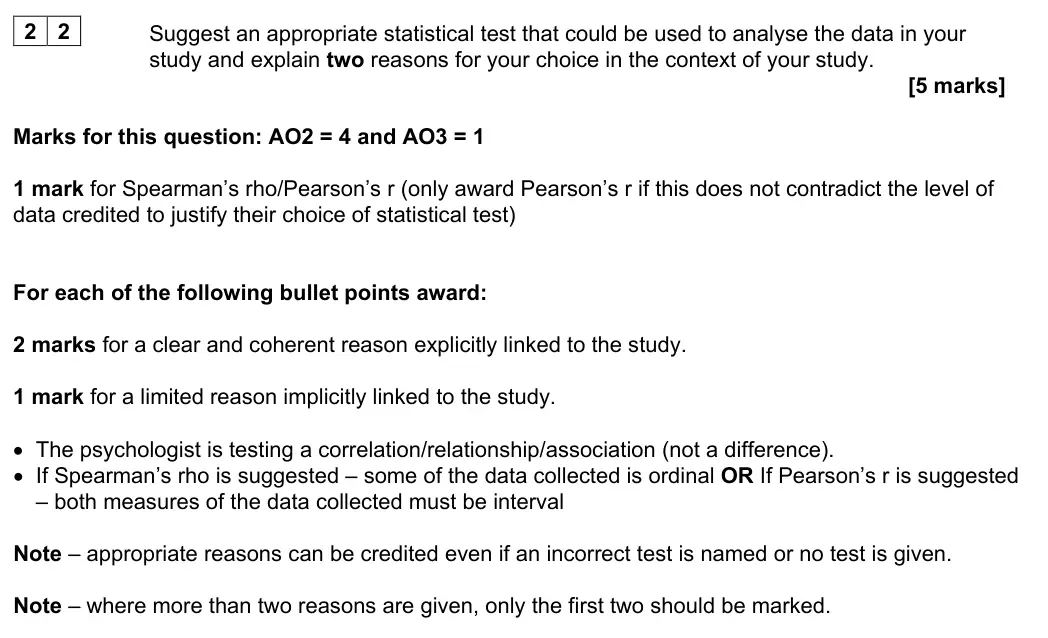
Suggest an appropriate statistical test that could be used to analyse the data in your study
and explain two reasons for your choice in the context of your study.
[5 marks]
Extra space
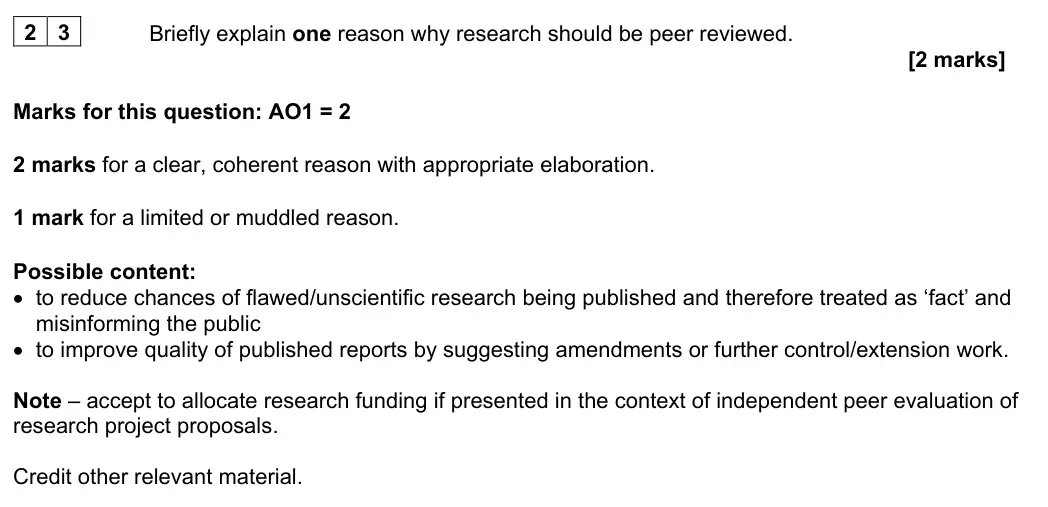
June 2023 · Paper 2 · Q23 2 marks AO1=2 Research methods scientific processes
2 3
Briefly explain one reason why research should be peer reviewed.
[2 marks]
June 2023 · Paper 2 · Q24 6 marks AO1=6 Research methods scientific processes
2 4
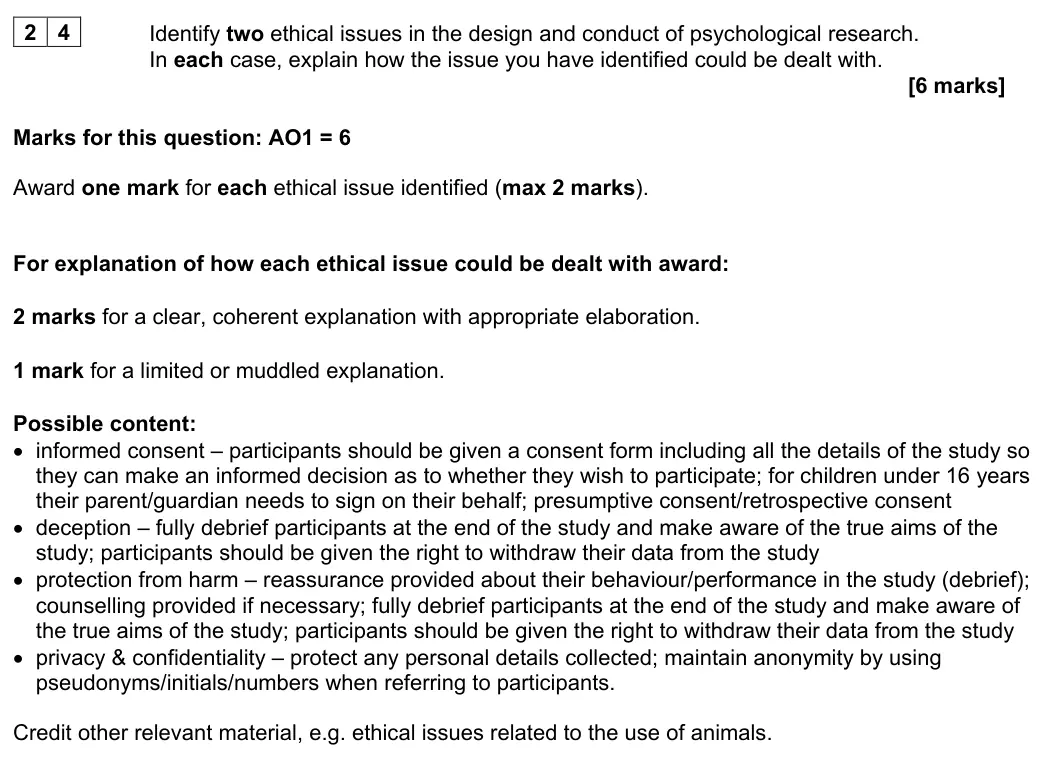
Identify two ethical issues in the design and conduct of psychological research.
In each case, explain how the issue you have identified could be dealt with.
[6 marks]
Extra space
June 2023 · Paper 3 · Q18 4 marks AO3=4 Research methods scientific processes
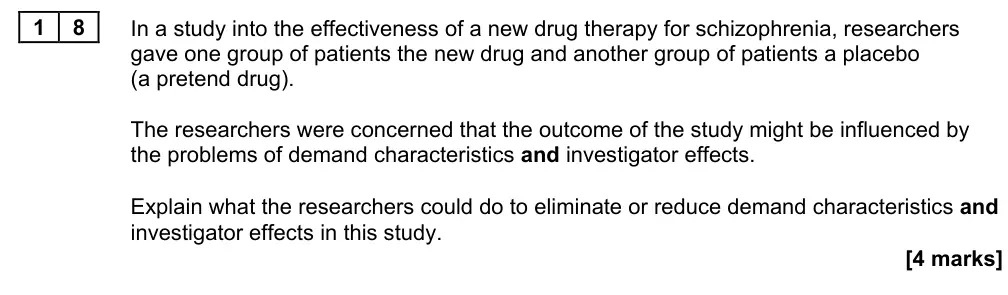
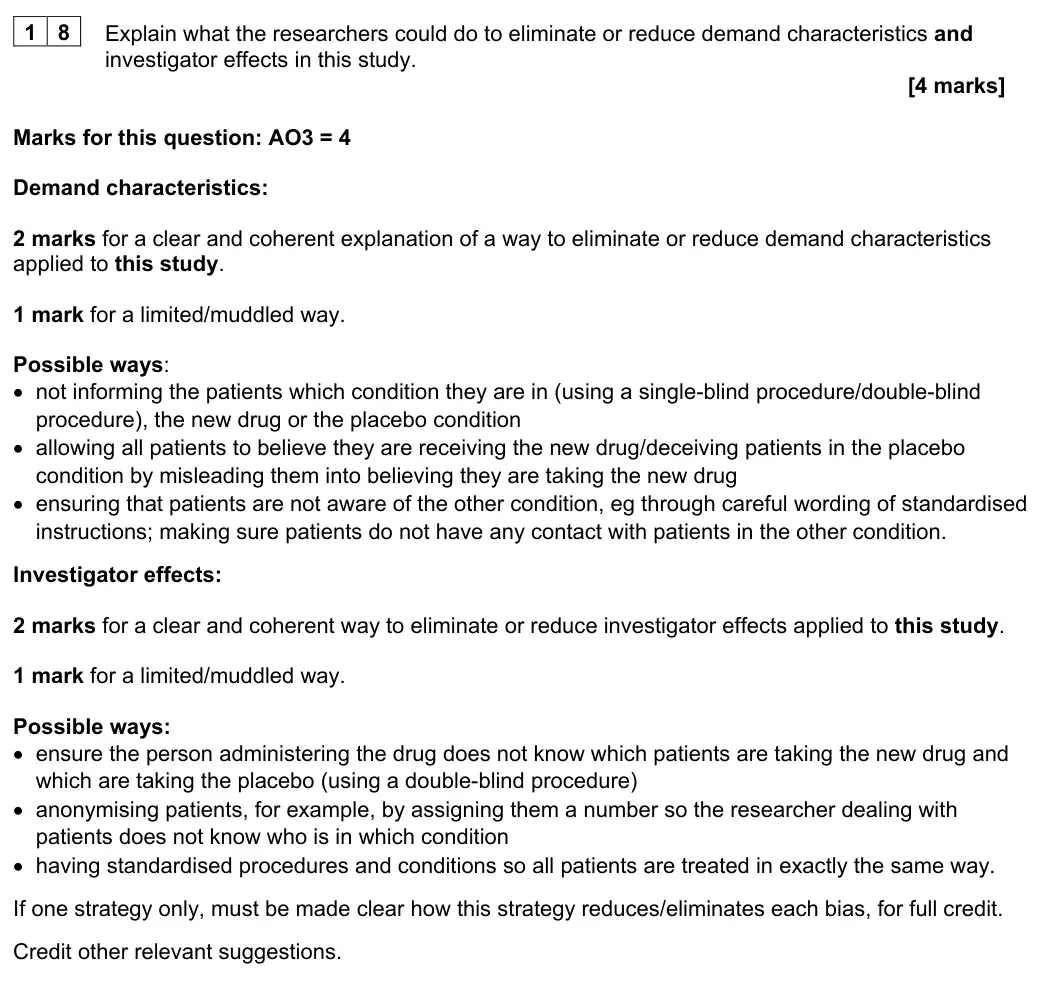
1 8
In a study into the effectiveness of a new drug therapy for schizophrenia, researchers
gave one group of patients the new drug and another group of patients a placebo
(a pretend drug).
The researchers were concerned that the outcome of the study might be influenced by
the problems of demand characteristics and investigator effects.
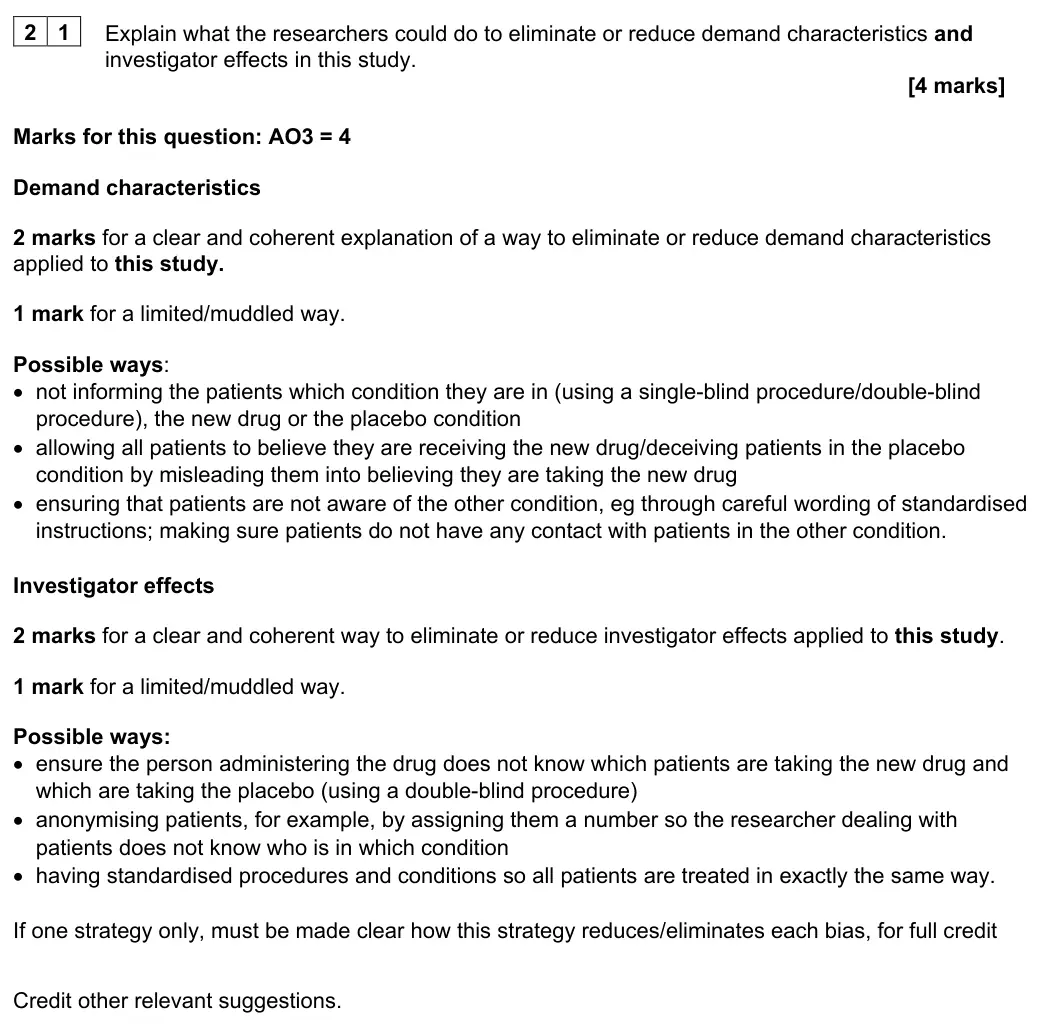
Explain what the researchers could do to eliminate or reduce demand characteristics and
investigator effects in this study.
[4 marks]
June 2023 · Paper 3 · Q21 4 marks AO3=4 Research methods scientific processes
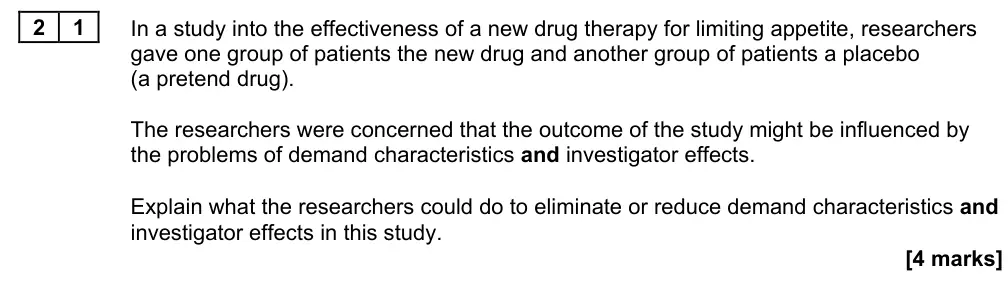
2 1
In a study into the effectiveness of a new drug therapy for limiting appetite, researchers
gave one group of patients the new drug and another group of patients a placebo
(a pretend drug).
The researchers were concerned that the outcome of the study might be influenced by
the problems of demand characteristics and investigator effects.
Explain what the researchers could do to eliminate or reduce demand characteristics and
investigator effects in this study.
[4 marks]
June 2023 · Paper 3 · Q24 4 marks AO3=4 Research methods scientific processes
2 4
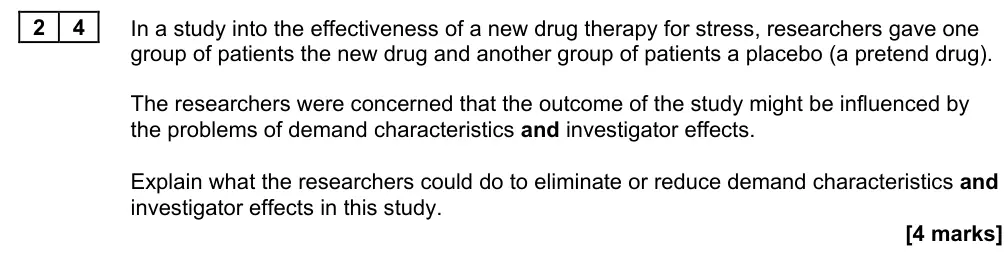
In a study into the effectiveness of a new drug therapy for stress, researchers gave one
group of patients the new drug and another group of patients a placebo (a pretend drug).
The researchers were concerned that the outcome of the study might be influenced by
the problems of demand characteristics and investigator effects.
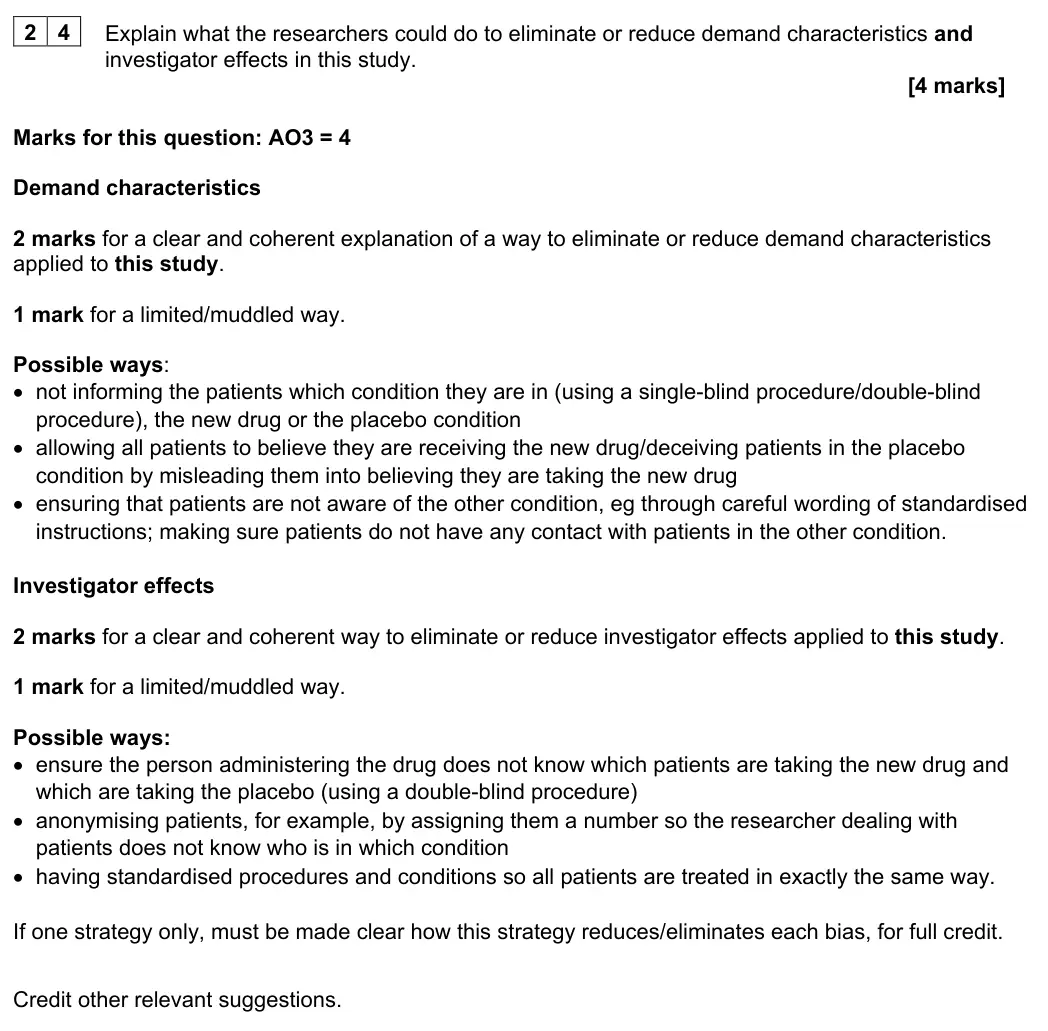
Explain what the researchers could do to eliminate or reduce demand characteristics and
investigator effects in this study.
[4 marks]
June 2023 · Paper 3 · Q26 4 marks AO2=4 Research methods inferential testingdata handling
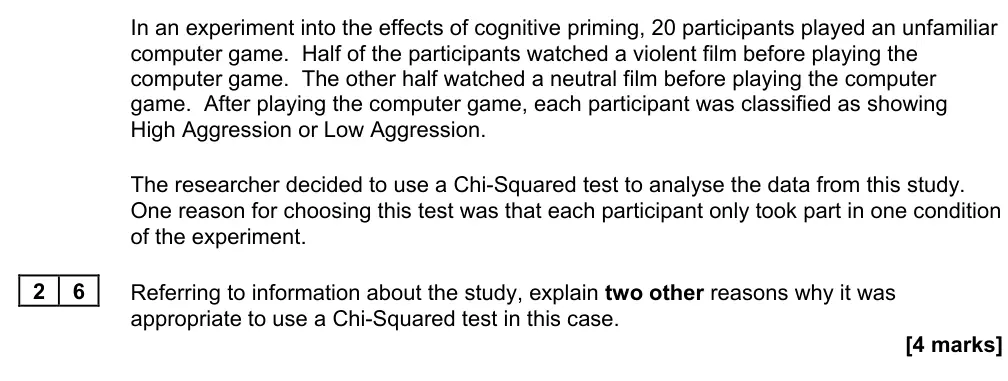
In an experiment into the effects of cognitive priming, 20 participants played an unfamiliar
computer game.  Half of the participants watched a violent film before playing the
computer game.  The other half watched a neutral film before playing the computer
game.  After playing the computer game, each participant was classified as showing
High Aggression or Low Aggression.
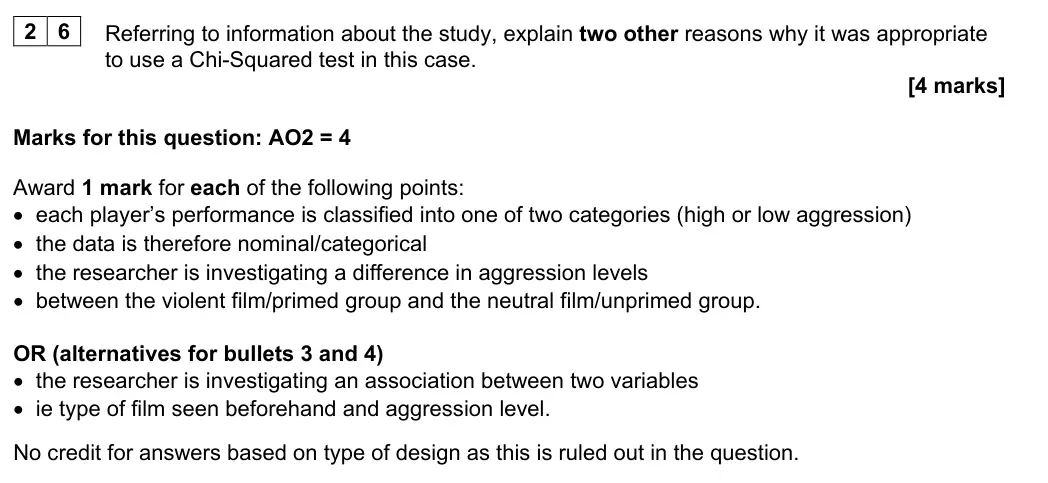
The researcher decided to use a Chi-Squared test to analyse the data from this study.
One reason for choosing this test was that each participant only took part in one condition
of the experiment.
2 6
Referring to information about the study, explain two other reasons why it was
appropriate to use a Chi-Squared test in this case.
[4 marks]
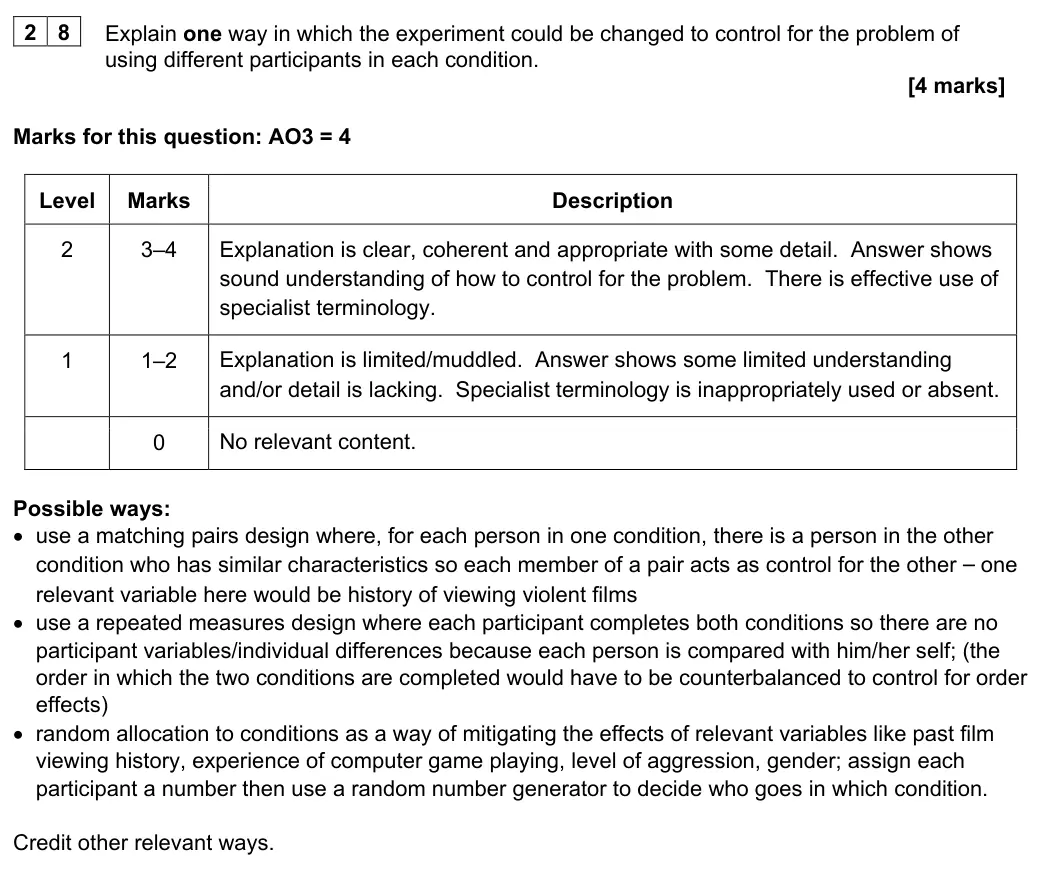
June 2023 · Paper 3 · Q28 4 marks AO3=4 Research methods scientific processes
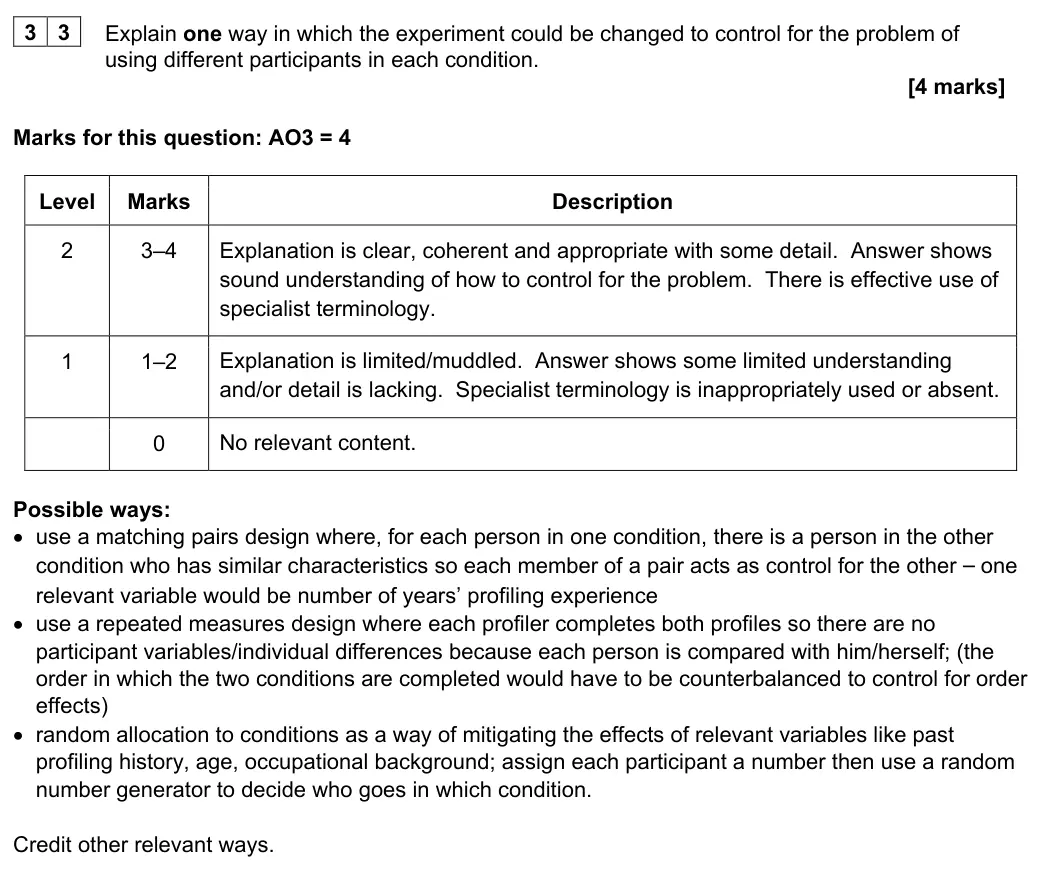
2 8
Different participants were used in each condition of the experiment, which might have
affected the results.
Explain one way in which the experiment could be changed to control for the problem of
using different participants in each condition.
[4 marks]
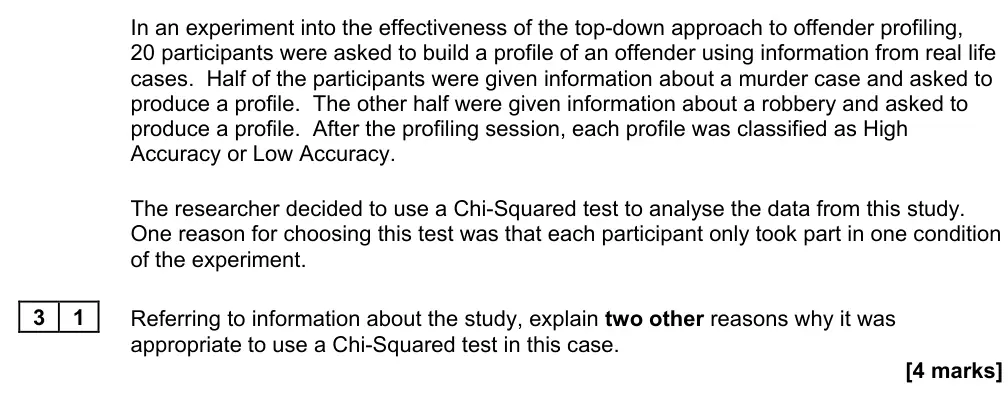
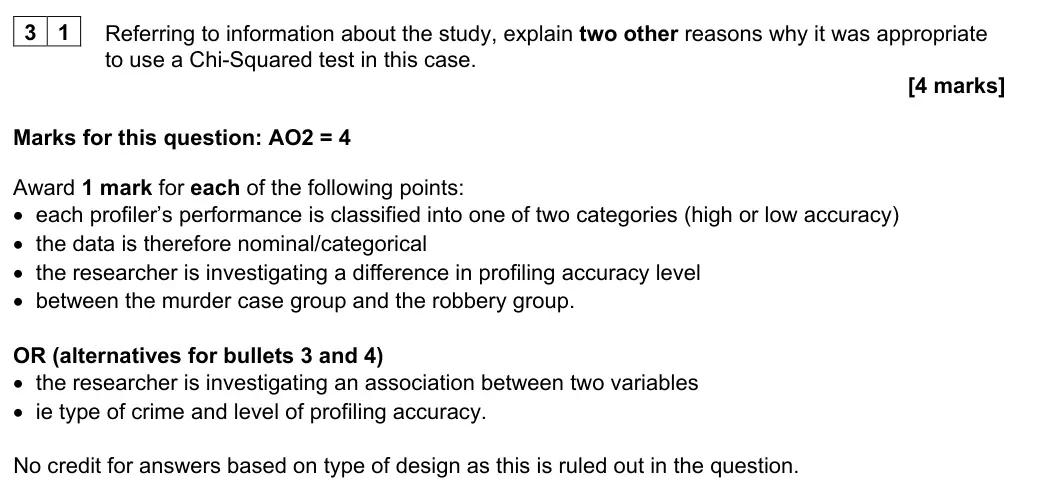
June 2023 · Paper 3 · Q31 4 marks AO2=4 Research methods inferential testingdata handling
In an experiment into the effectiveness of the top-down approach to offender profiling,
20 participants were asked to build a profile of an offender using information from real life
cases.  Half of the participants were given information about a murder case and asked to
produce a profile.  The other half were given information about a robbery and asked to
produce a profile.  After the profiling session, each profile was classified as High
Accuracy or Low Accuracy.
The researcher decided to use a Chi-Squared test to analyse the data from this study.
One reason for choosing this test was that each participant only took part in one condition
of the experiment.
3 1
Referring to information about the study, explain two other reasons why it was
appropriate to use a Chi-Squared test in this case.
[4 marks]
June 2023 · Paper 3 · Q33 4 marks AO3=4 Research methods scientific processes
3 3
Different participants were used in each condition of the experiment, which might have
affected the results.
Explain one way in which the experiment could be changed to control for the problem of
using different participants in each condition.
[4 marks]
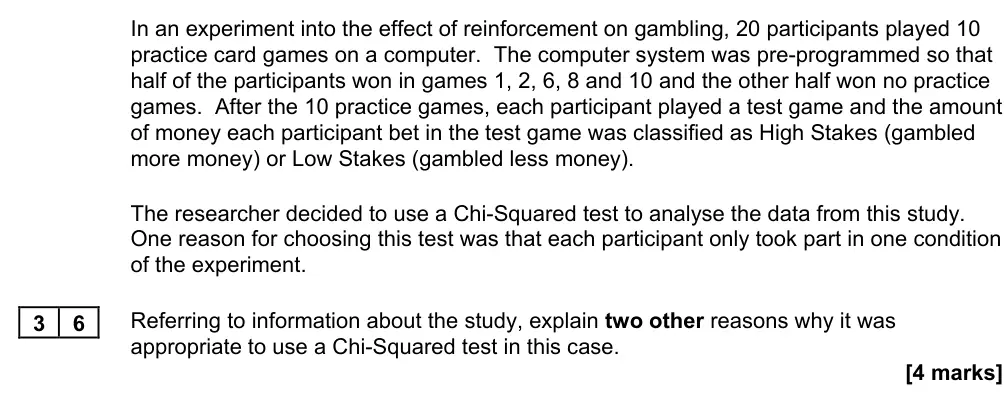
June 2023 · Paper 3 · Q36 4 marks AO2=4 Research methods inferential testingdata handling
In an experiment into the effect of reinforcement on gambling, 20 participants played 10
practice card games on a computer.  The computer system was pre-programmed so that
half of the participants won in games 1, 2, 6, 8 and 10 and the other half won no practice
games.  After the 10 practice games, each participant played a test game and the amount
of money each participant bet in the test game was classified as High Stakes (gambled
more money) or Low Stakes (gambled less money).
The researcher decided to use a Chi-Squared test to analyse the data from this study.
One reason for choosing this test was that each participant only took part in one condition
of the experiment.
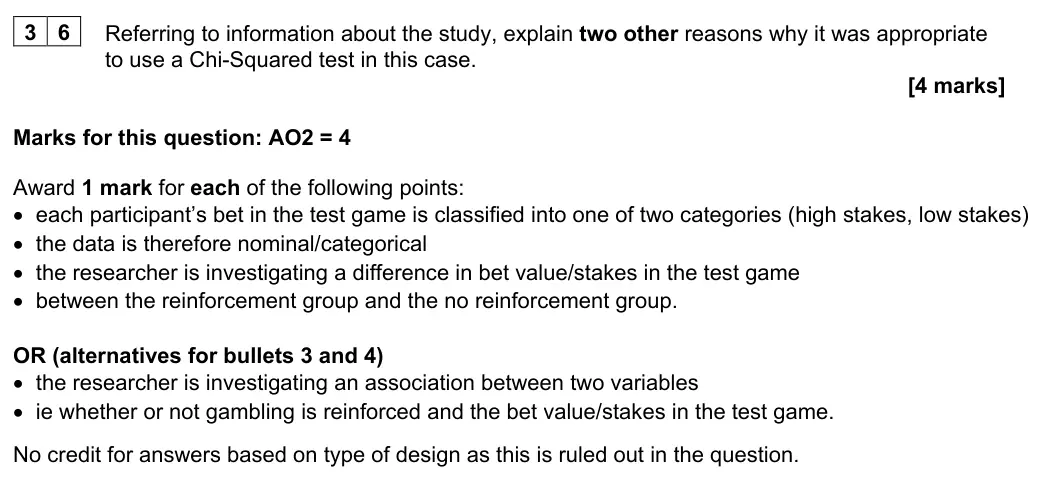
3 6
Referring to information about the study, explain two other reasons why it was
appropriate to use a Chi-Squared test in this case.
[4 marks]
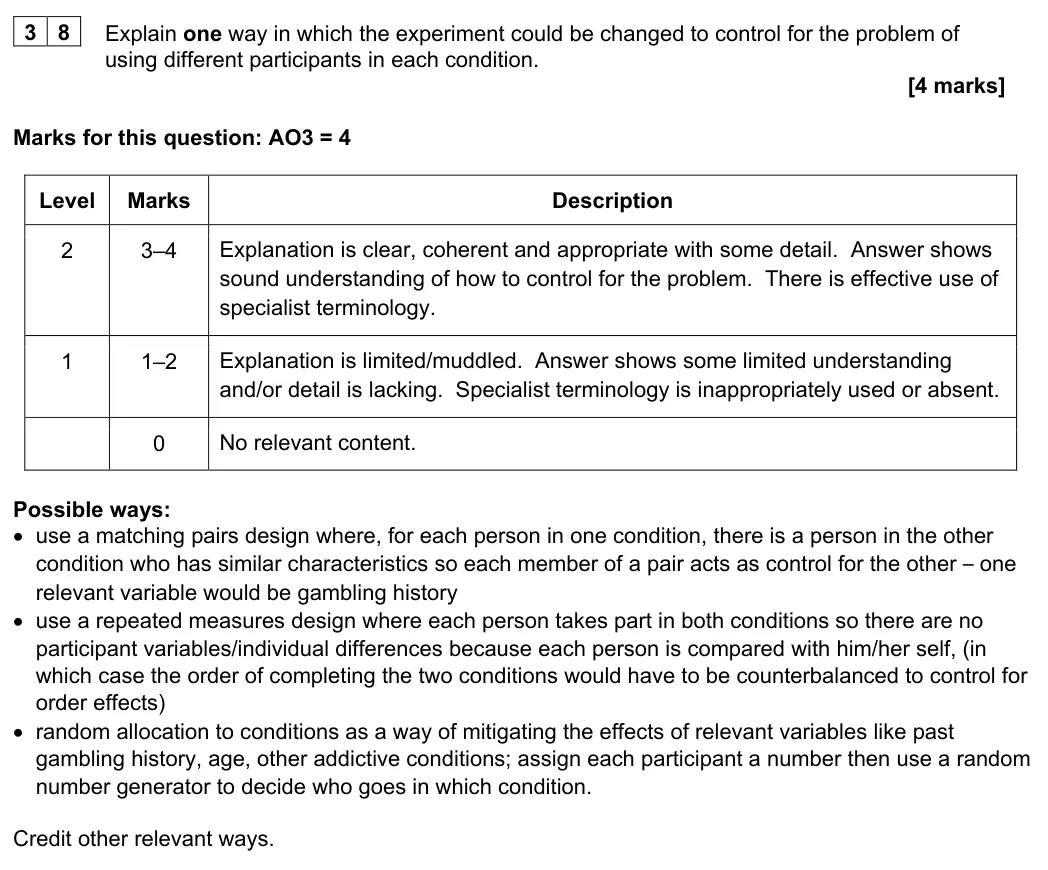
June 2023 · Paper 3 · Q38 4 marks AO3=4 Research methods scientific processes
3 8
Different participants were used in each condition of the experiment, which might have
affected the results.
Explain one way in which the experiment could be changed to control for the problem of
using different participants in each condition.
[4 marks]
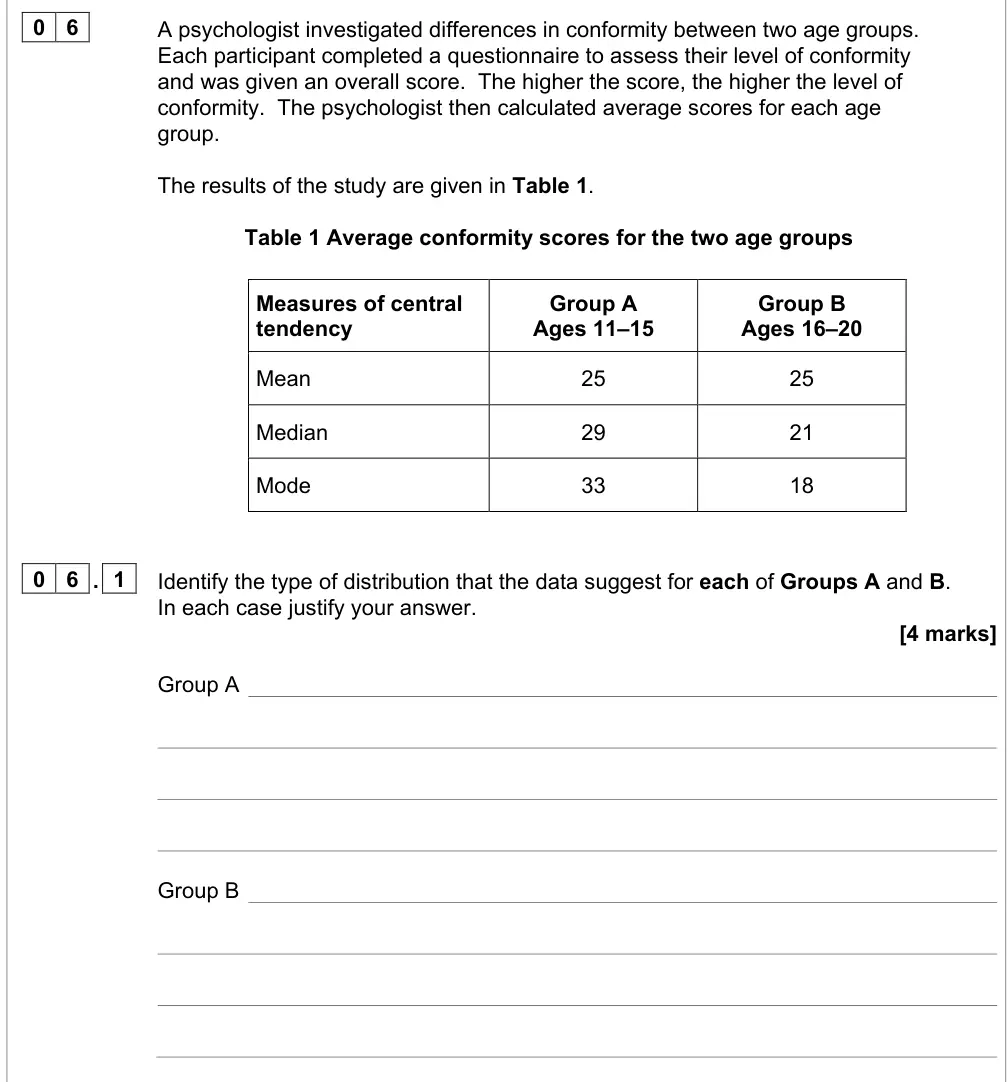
June 2022 · AS Paper 1 · Q6.1 4 marks AO2=4 Research methods data handling
0 6
A psychologist investigated differences in conformity between two age groups.
Each participant completed a questionnaire to assess their level of conformity
and was given an overall score.  The higher the score, the higher the level of
conformity.  The psychologist then calculated average scores for each age
group.
The results of the study are given in Table 1.
Table 1 Average conformity scores for the two age groups
Measures of central
Group A
Group B
tendency
Ages 11–15
Ages 16–20
Mean
25
25
Median
29
21
Mode
33
18
0 6 . 1
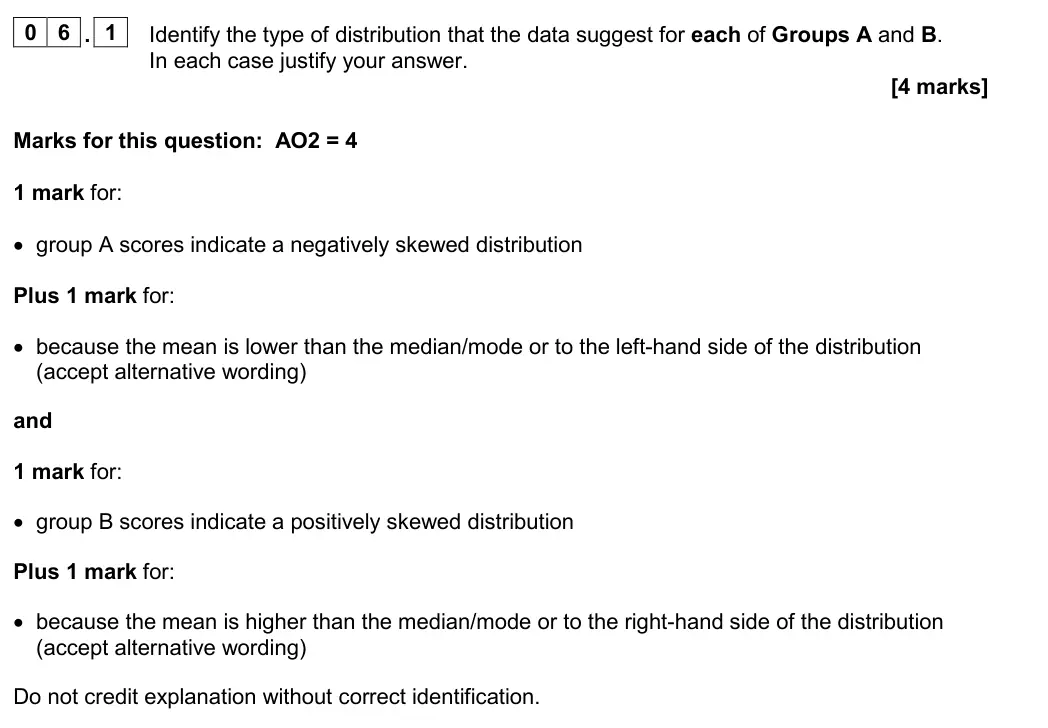
Identify the type of distribution that the data suggest for each of Groups A and B.
In each case justify your answer.
[4 marks]
Group A
Group B
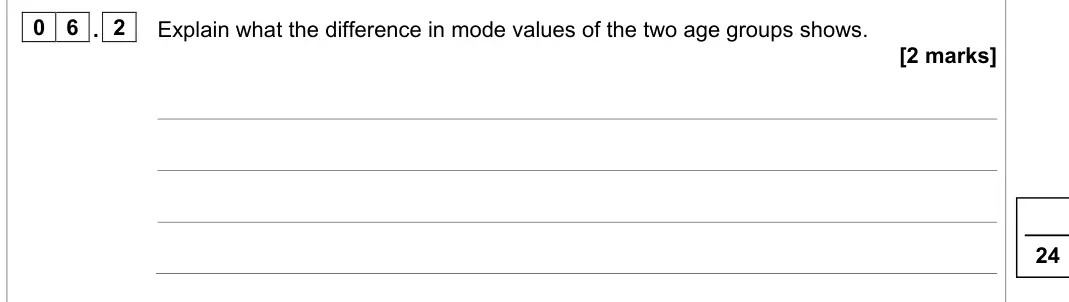
June 2022 · AS Paper 1 · Q6.2 2 marks AO2=2 Research methods data handling
0 6 . 2
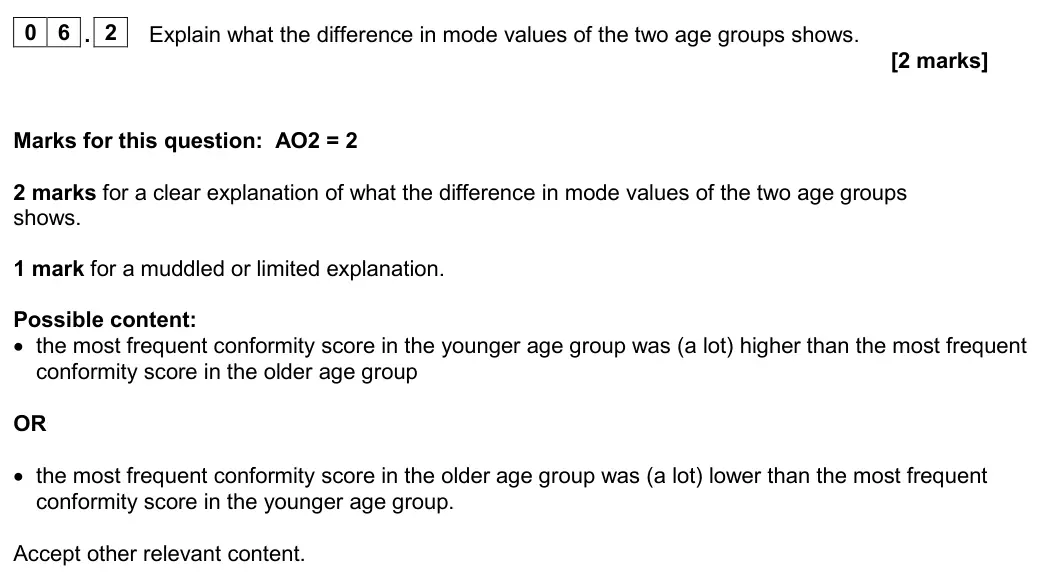
Explain what the difference in mode values of the two age groups shows.
[2 marks]
June 2022 · AS Paper 1 · Q7.1 2 marks AO2=2 Research methods scientific processes
0 7
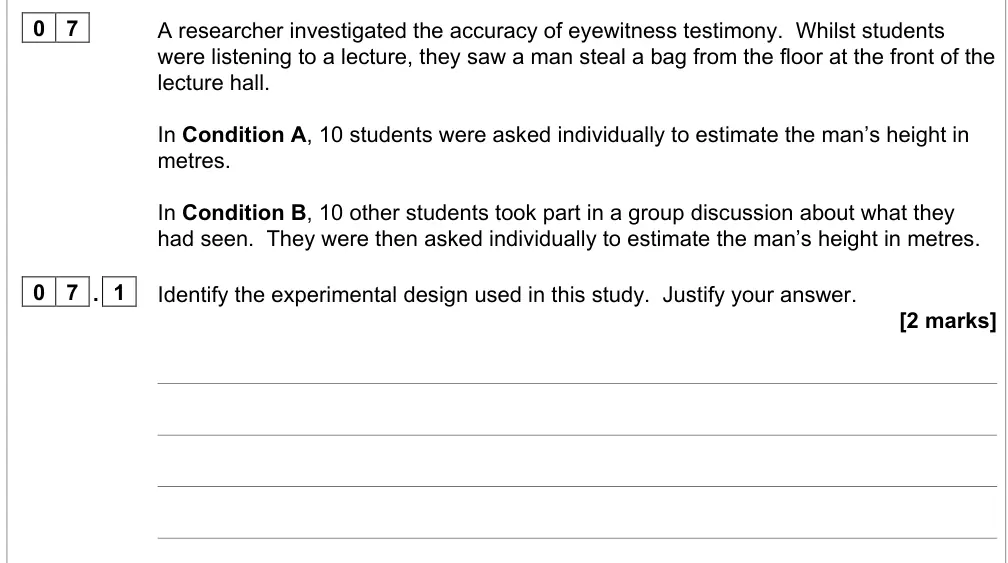
A researcher investigated the accuracy of eyewitness testimony.  Whilst students
were listening to a lecture, they saw a man steal a bag from the floor at the front of the
lecture hall.
In Condition A, 10 students were asked individually to estimate the man’s height in
metres.
In Condition B, 10 other students took part in a group discussion about what they
had seen.  They were then asked individually to estimate the man’s height in metres.
0 7 . 1
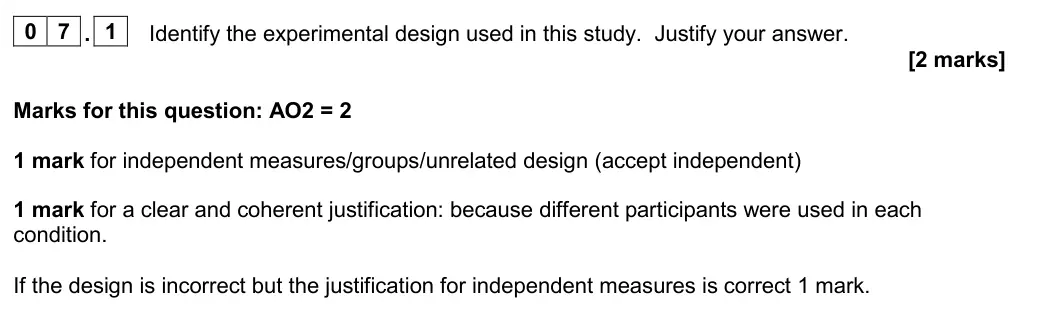
Identify the experimental design used in this study.  Justify your answer.
[2 marks]
June 2022 · AS Paper 1 · Q7.2 2 marks AO2=2 Research methods scientific processes
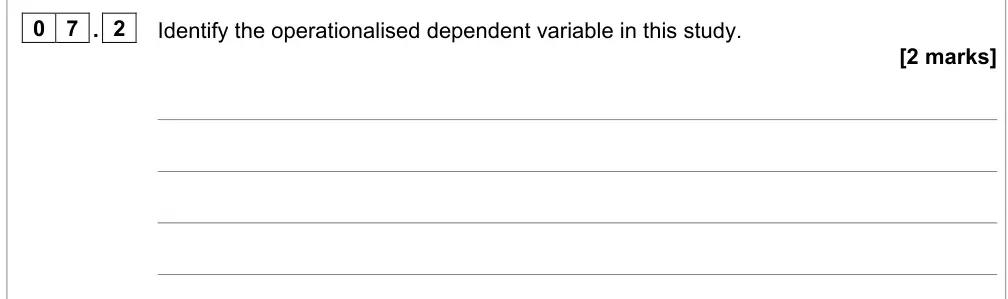
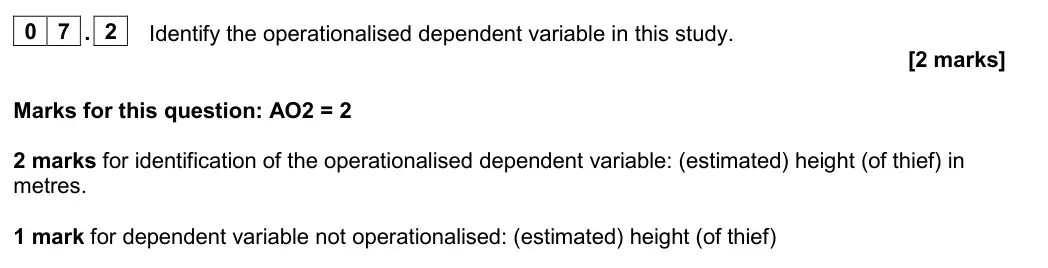
0 7 . 2
Identify the operationalised dependent variable in this study.
[2 marks]
June 2022 · AS Paper 1 · Q7.3 2 marks AO2=2 Research methods data handling
0 7 . 3
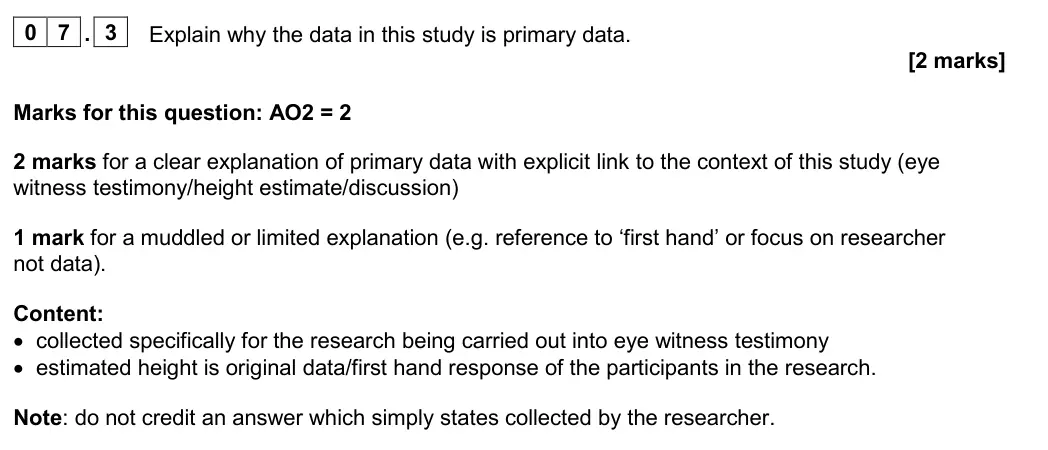
Explain why the data in this study is primary data.
[2 marks]
June 2022 · AS Paper 1 · Q7.4 2 marks AO2=2 Research methods data handling
0 7 . 4
A week later, the same students were asked to describe the man’s facial features,
estimate his age in years and weight in kilograms.
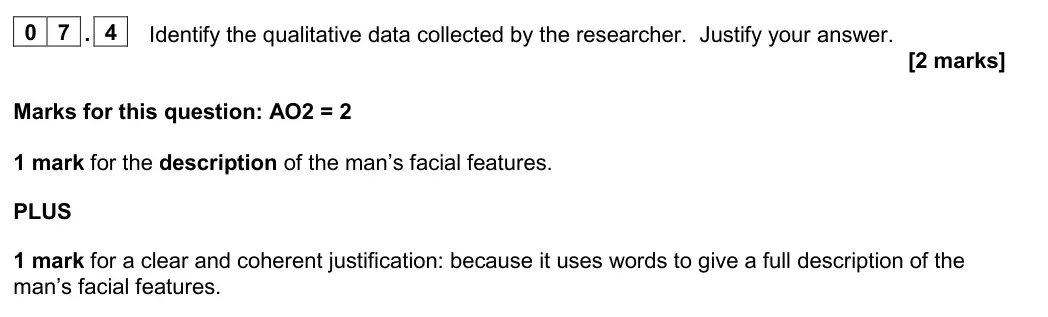
Identify the qualitative data collected by the researcher.  Justify your answer.
[2 marks]
June 2022 · AS Paper 2 · Q10.1 3 marks AO2=3 Research methods scientific processesresearch methods
A psychologist investigated the relationship between stress and illness at a local
school.  The psychologist placed an advert on the staffroom noticeboard.
Ten teachers contacted the psychologist offering to complete the psychologist’s
questionnaire.
In the questionnaire stress levels were measured on a scale from 1 to 10, with a
higher score indicating greater stress.  The questionnaire also asked how many days
they had been absent from work due to sickness in the previous six months.
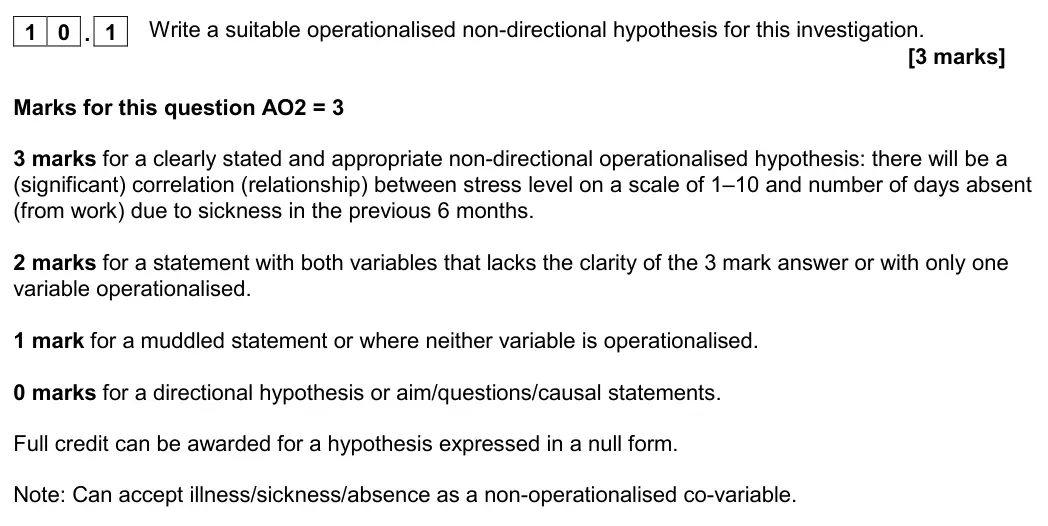
1 0 . 1
Write a suitable operationalised non-directional hypothesis for this investigation.
[3 marks]
June 2022 · AS Paper 2 · Q10.2 1 mark AO2=1 Research methods Hard scientific processes
1 0 . 2
Identify the sampling method used in this investigation.
[1 mark]
June 2022 · AS Paper 2 · Q10.3 2 marks AO2=2 Research methods data handling
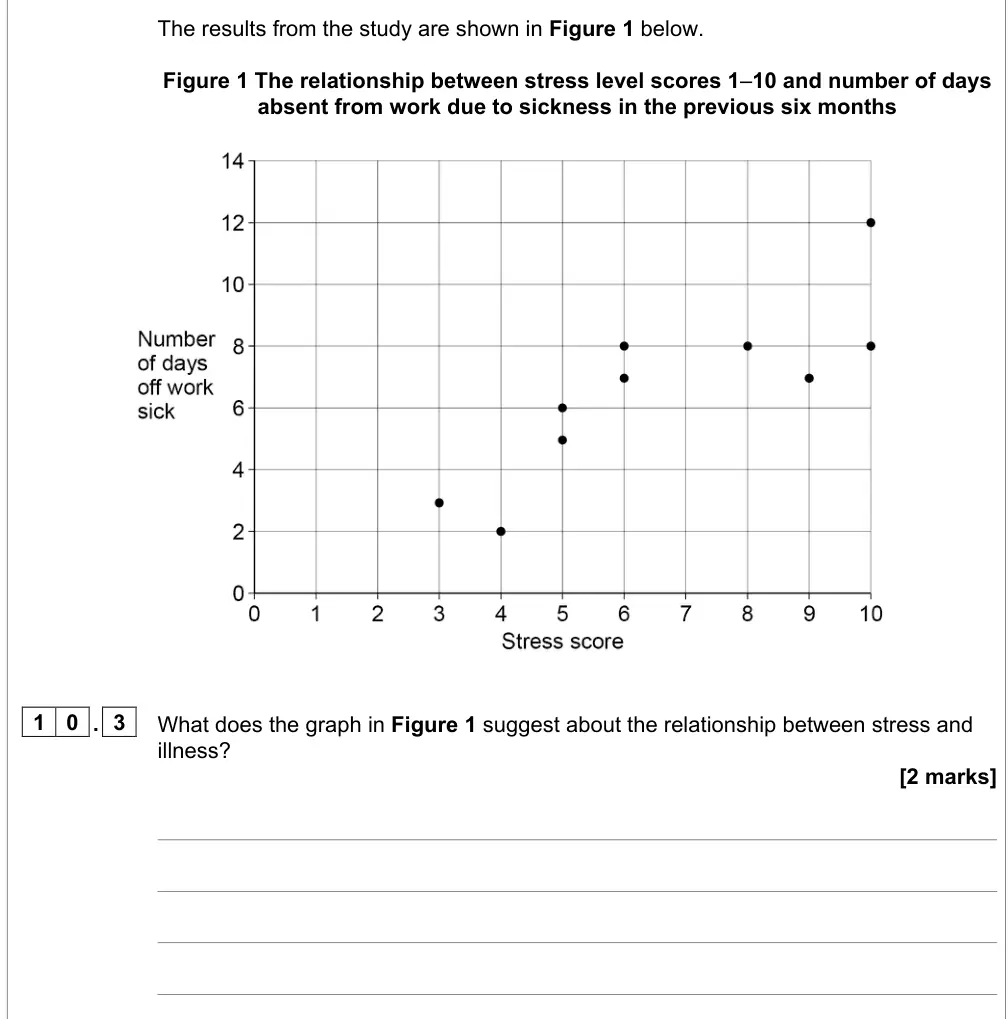
The results from the study are shown in Figure 1 below.
Figure 1 The relationship between stress level scores 1–10 and number of days
absent from work due to sickness in the previous six months
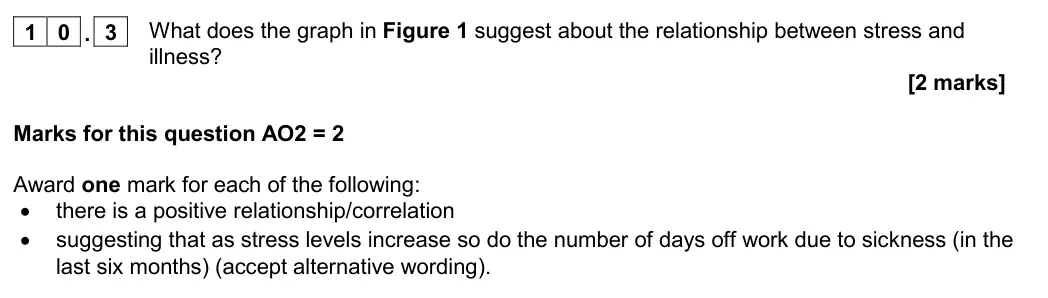
1 0 . 3
What does the graph in Figure 1 suggest about the relationship between stress and
illness?
[2 marks]
June 2022 · AS Paper 2 · Q10.4 3 marks AO3=3 Research methods research methods
1 0 . 4
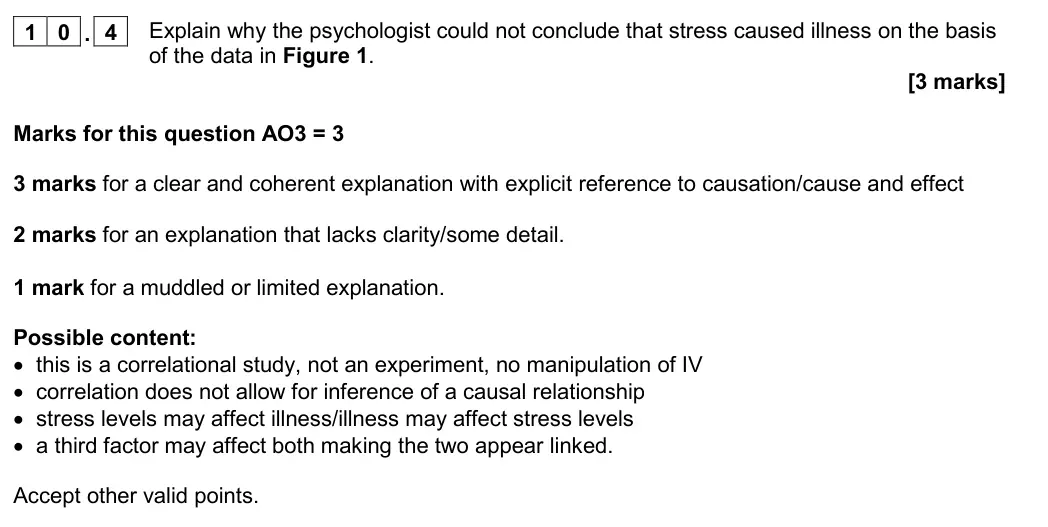
Explain why the psychologist could not conclude that stress caused illness on the
basis of the data in Figure 1.
[3 marks]
June 2022 · AS Paper 2 · Q11.1 2 marks AO2=1, AO3=1 Research methods data handling
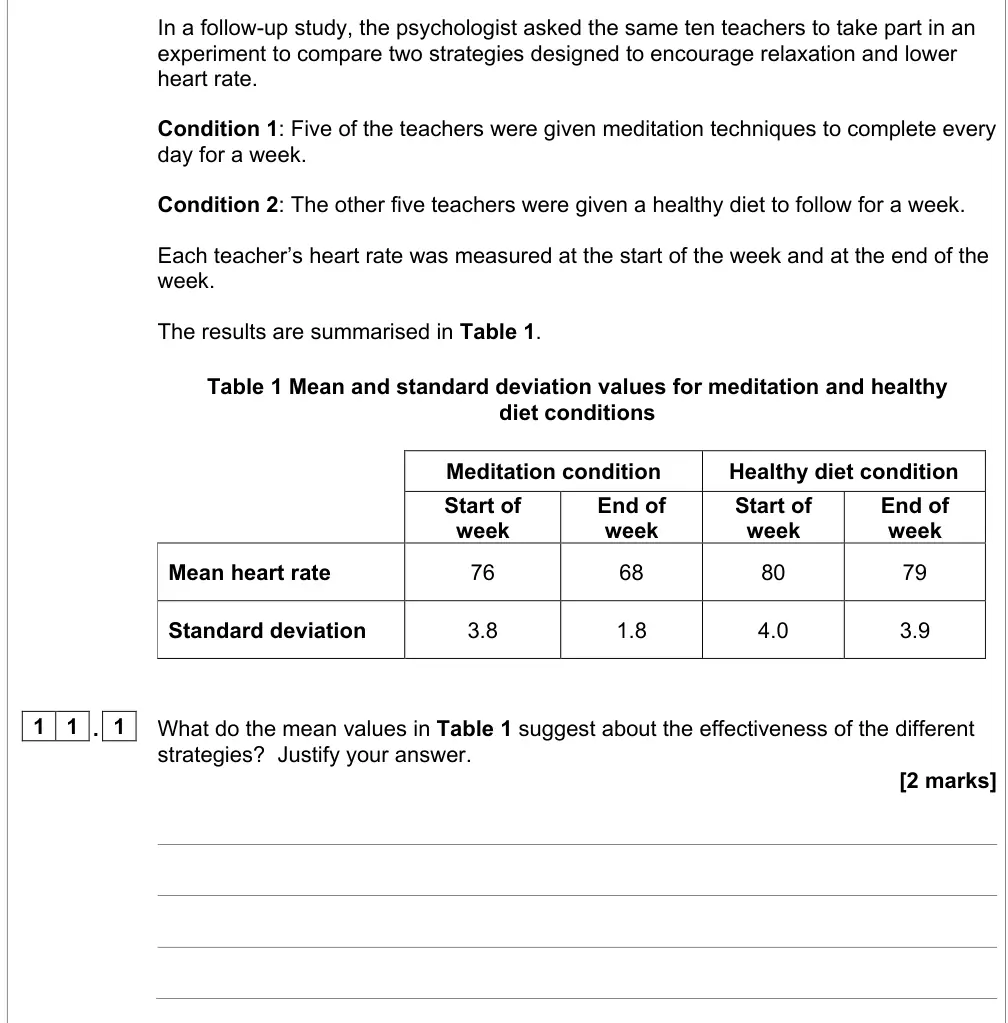
In a follow-up study, the psychologist asked the same ten teachers to take part in an
experiment to compare two strategies designed to encourage relaxation and lower
heart rate.
Condition 1: Five of the teachers were given meditation techniques to complete every
day for a week.
Condition 2: The other five teachers were given a healthy diet to follow for a week.
Each teacher’s heart rate was measured at the start of the week and at the end of the
week.
The results are summarised in Table 1.
Table 1 Mean and standard deviation values for meditation and healthy
diet conditions
Meditation condition
Healthy diet condition
Start of
End of
Start of
End of
week
week
week
week
Mean heart rate
76
68
80
79
Standard deviation
3.8
1.8
4.0
3.9
1 1 . 1
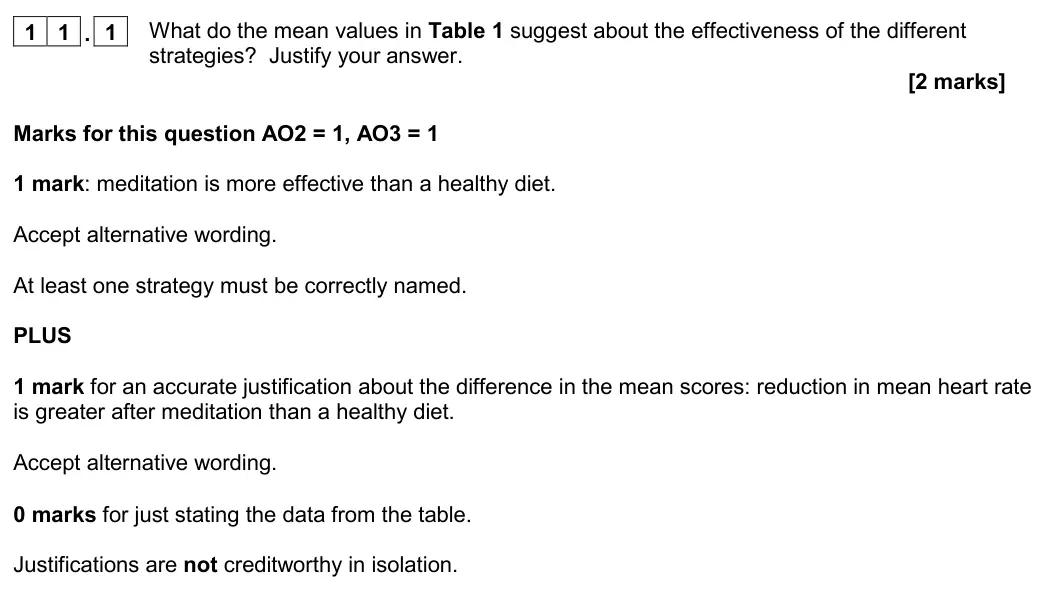
What do the mean values in Table 1 suggest about the effectiveness of the different
strategies?  Justify your answer.
[2 marks]
June 2022 · AS Paper 2 · Q11.2 2 marks AO2=1, AO3=1 Research methods data handling
1 1 . 2
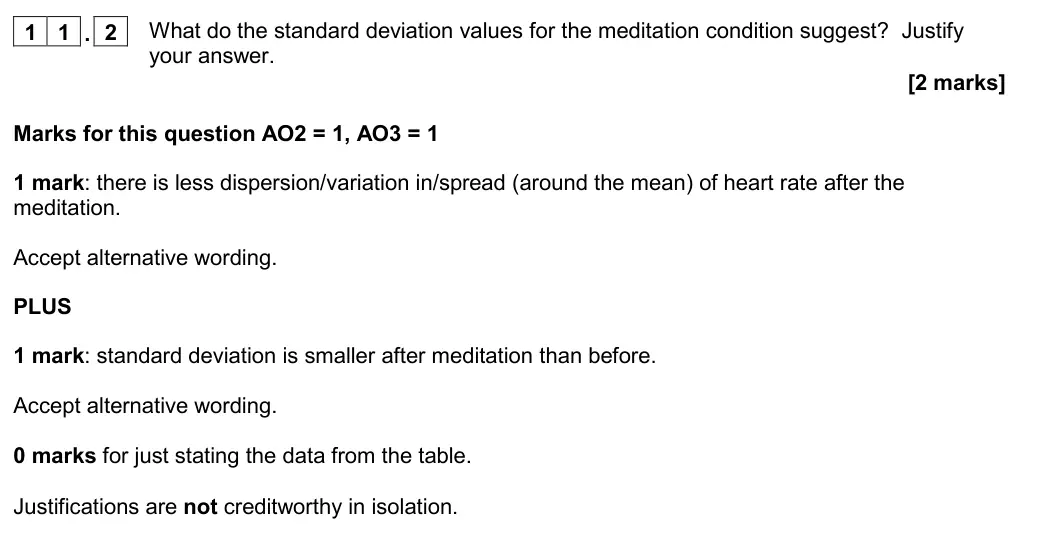
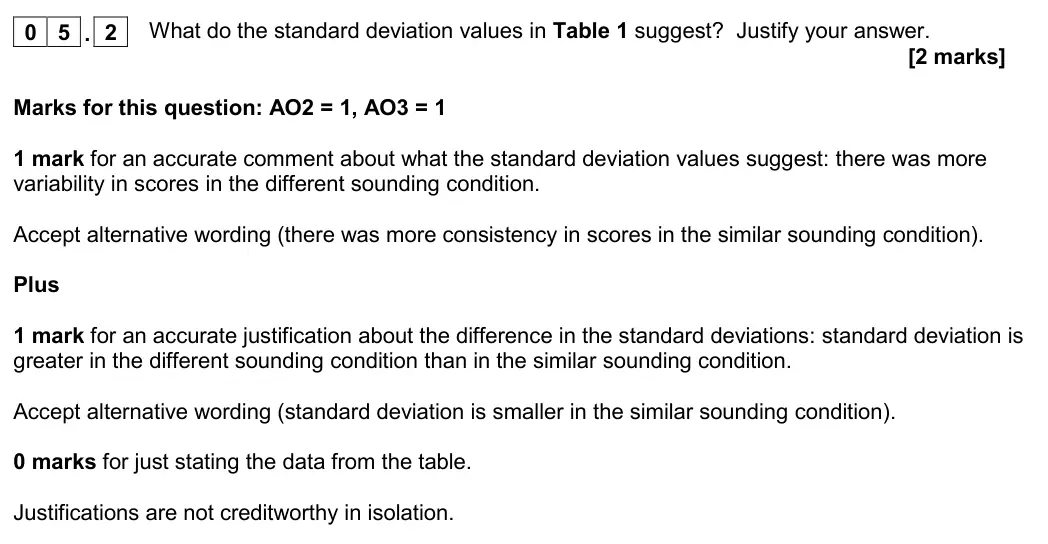
What do the standard deviation values for the meditation condition suggest?  Justify
your answer.
[2 marks]
June 2022 · AS Paper 2 · Q11.3 3 marks AO2=3 Research methods scientific processes
1 1 . 3
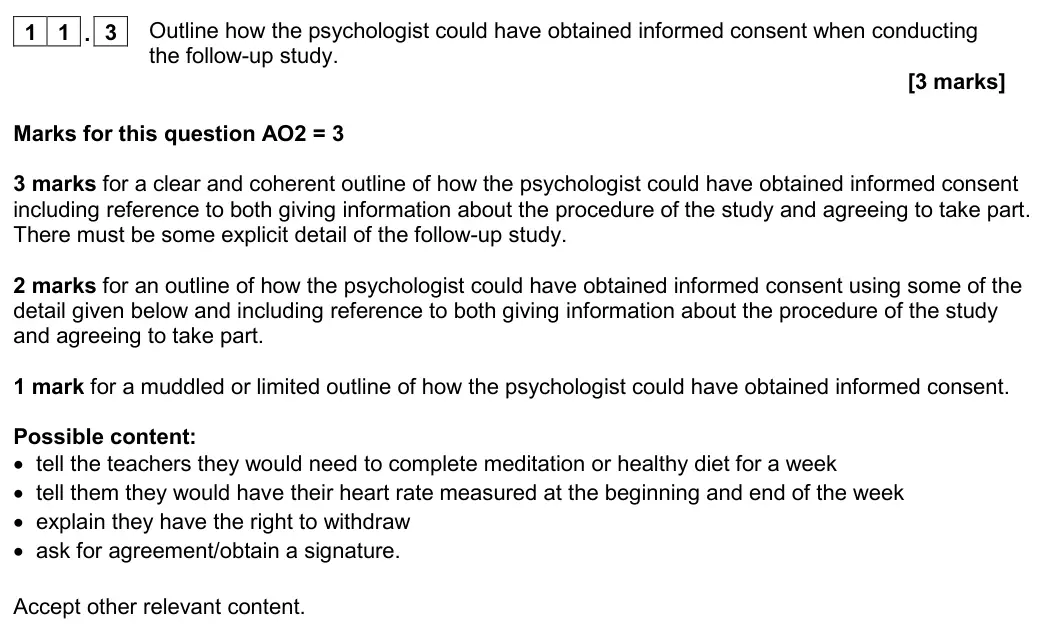
Outline how the psychologist could have obtained informed consent when conducting
the follow-up study.
[3 marks]
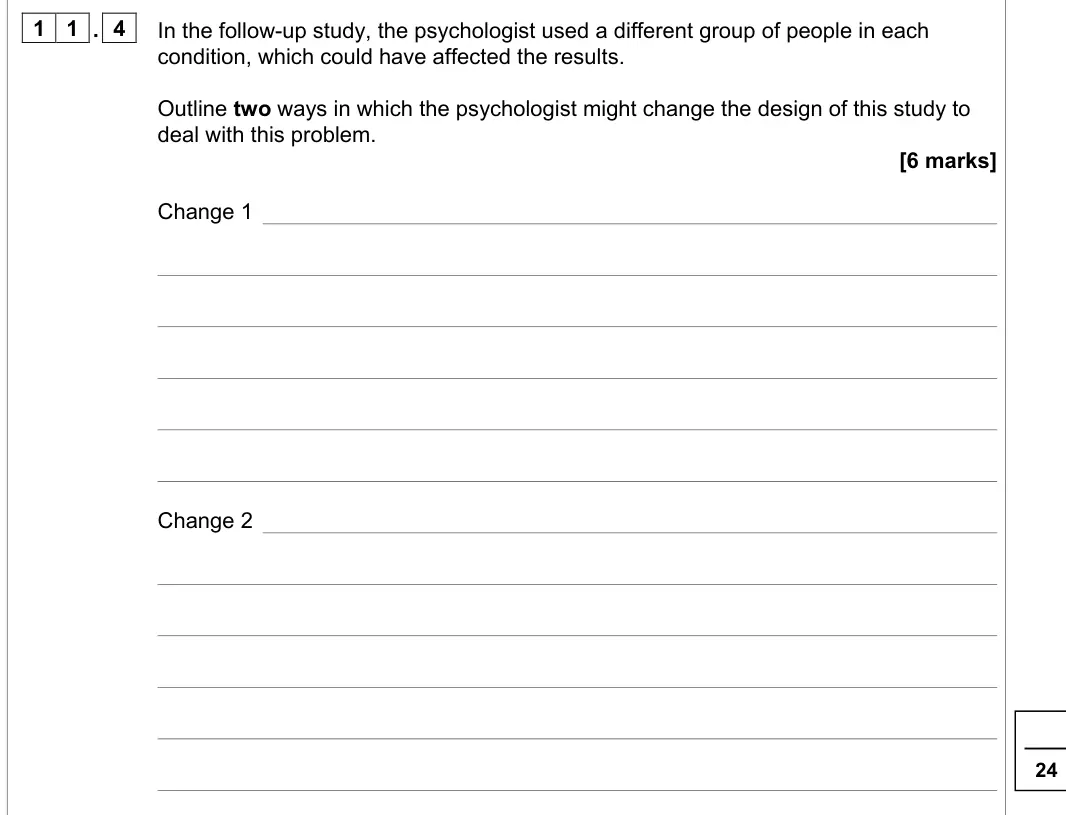
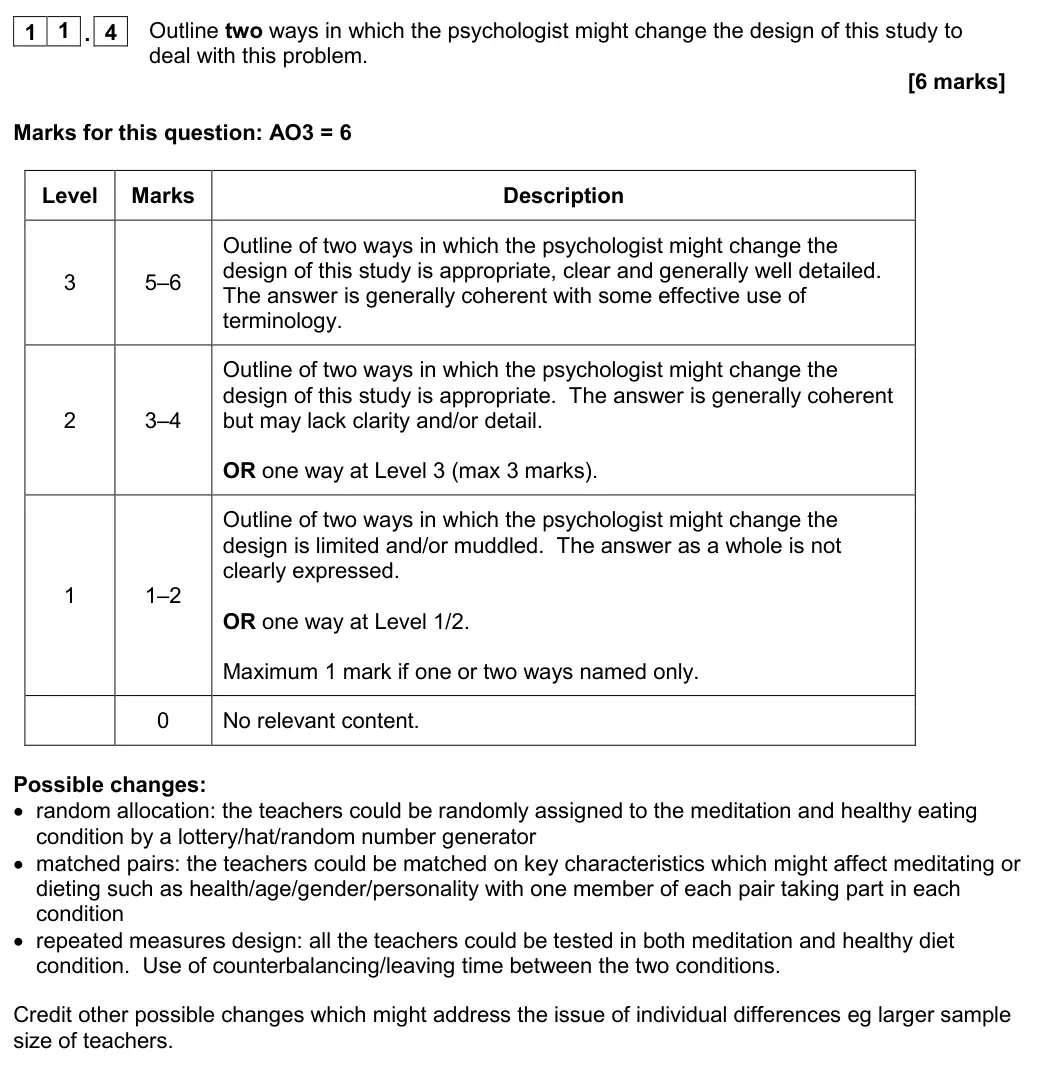
June 2022 · AS Paper 2 · Q11.4 6 marks AO3=6 Research methods scientific processes
1 1 . 4
In the follow-up study, the psychologist used a different group of people in each
condition, which could have affected the results.
Outline two ways in which the psychologist might change the design of this study to
deal with this problem.
[6 marks]
Change 1
Change 2
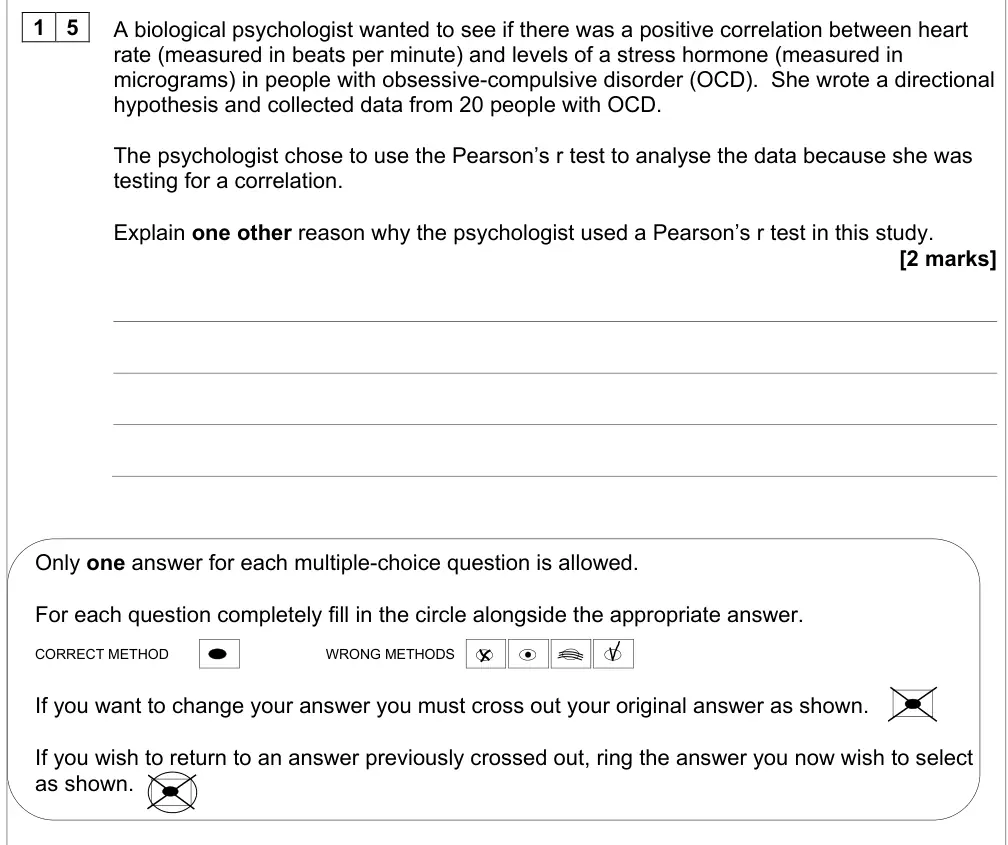
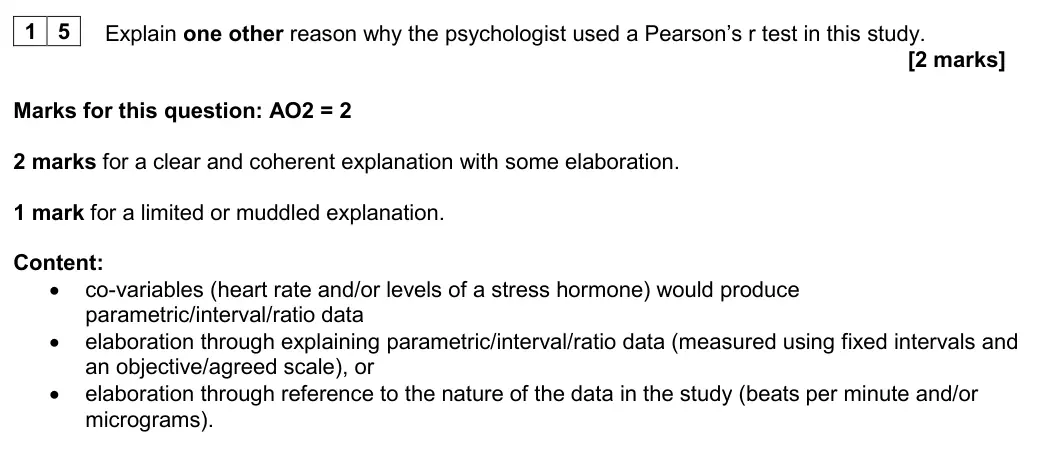
June 2022 · Paper 1 · Q15 2 marks AO2=2 Research methods inferential testingdata handling
1 5
A biological psychologist wanted to see if there was a positive correlation between heart
rate (measured in beats per minute) and levels of a stress hormone (measured in
micrograms) in people with obsessive-compulsive disorder (OCD).  She wrote a directional
hypothesis and collected data from 20 people with OCD.
The psychologist chose to use the Pearson’s r test to analyse the data because she was
testing for a correlation.
Explain one other reason why the psychologist used a Pearson’s r test in this study.
[2 marks]
Only one answer for each multiple-choice question is allowed.
June 2022 · Paper 1 · Q17 4 marks AO2=4 Research methods inferential testingscientific processes
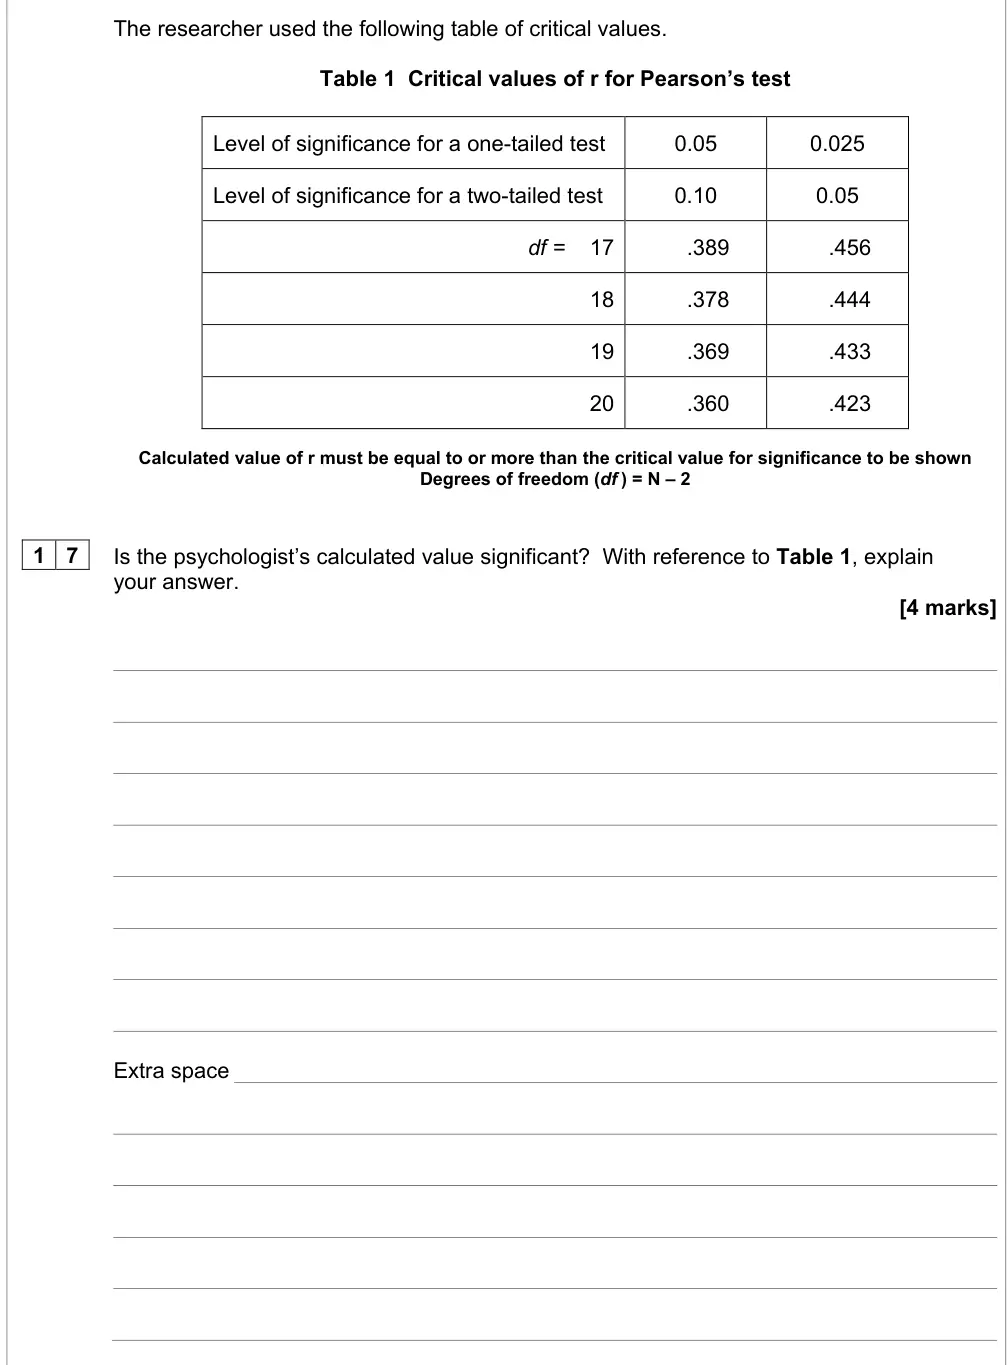
The researcher used the following table of critical values.
Table 1  Critical values of r for Pearson’s test
Level of significance for a one-tailed test
0.05
0.025
Level of significance for a two-tailed test
0.10
0.05
df =    17
.389
.456
18
.378
.444
19
.369
.433
20
.360
.423
Calculated value of r must be equal to or more than the critical value for significance to be shown
Degrees of freedom (df ) = N – 2
1 7
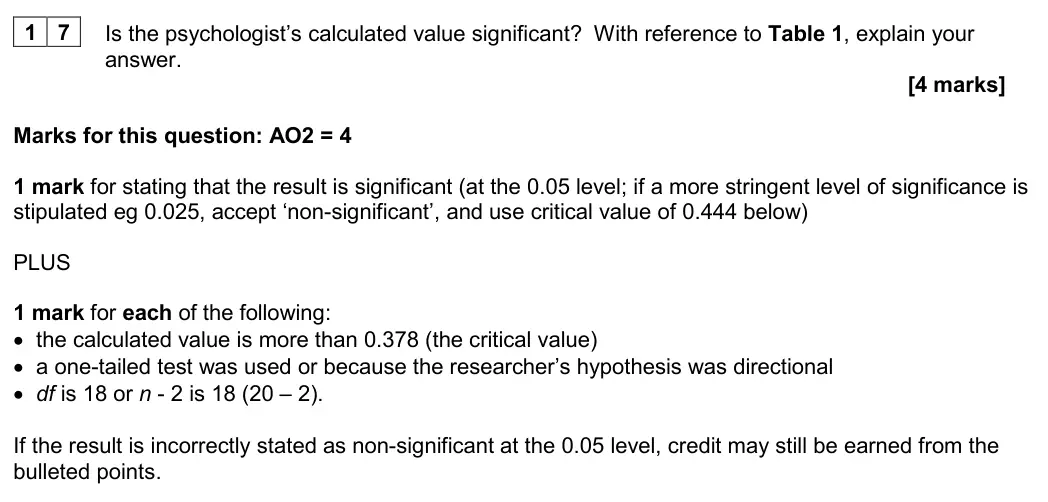
Is the psychologist’s calculated value significant?  With reference to Table 1, explain
your answer.
[4 marks]
Extra space
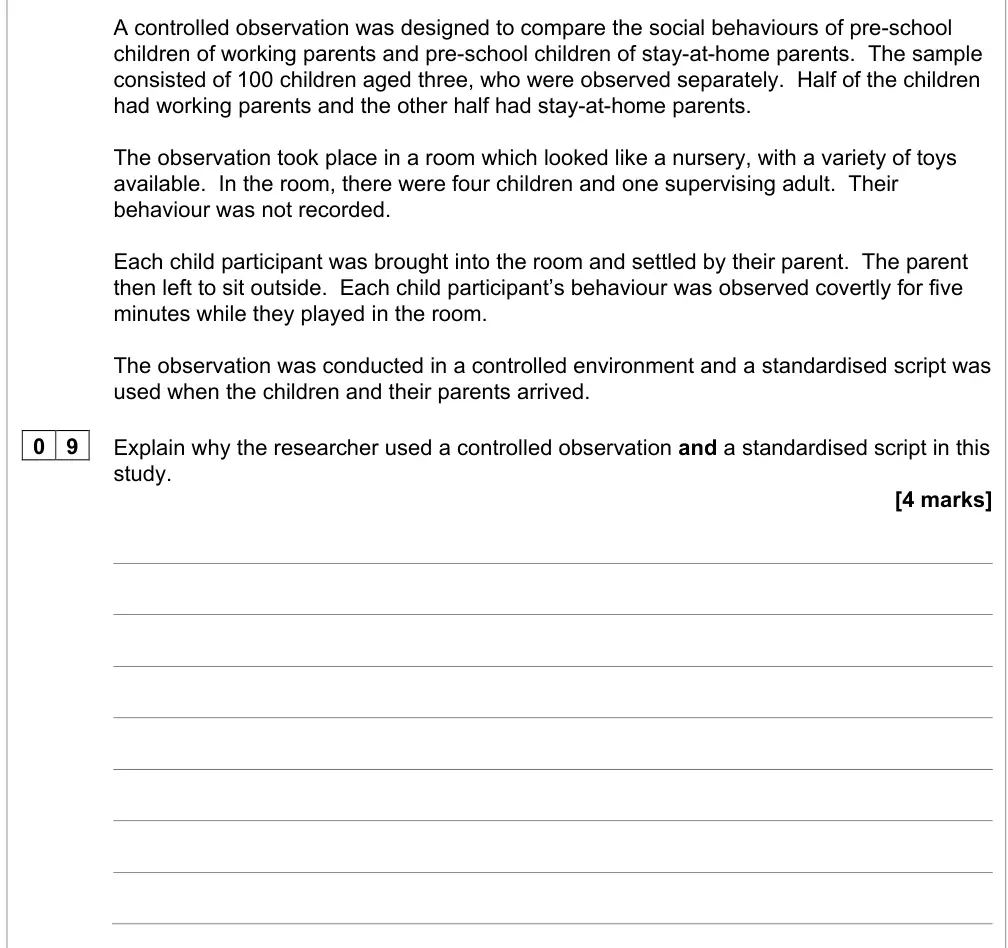
June 2022 · Paper 2 · Q9 4 marks AO2=4 Research methods research methodsscientific processes
A controlled observation was designed to compare the social behaviours of pre-school
children of working parents and pre-school children of stay-at-home parents.  The sample
consisted of 100 children aged three, who were observed separately.  Half of the children
had working parents and the other half had stay-at-home parents.
The observation took place in a room which looked like a nursery, with a variety of toys
available.  In the room, there were four children and one supervising adult.  Their
behaviour was not recorded.
Each child participant was brought into the room and settled by their parent.  The parent
then left to sit outside.  Each child participant’s behaviour was observed covertly for five
minutes while they played in the room.
The observation was conducted in a controlled environment and a standardised script was
used when the children and their parents arrived.
0 9
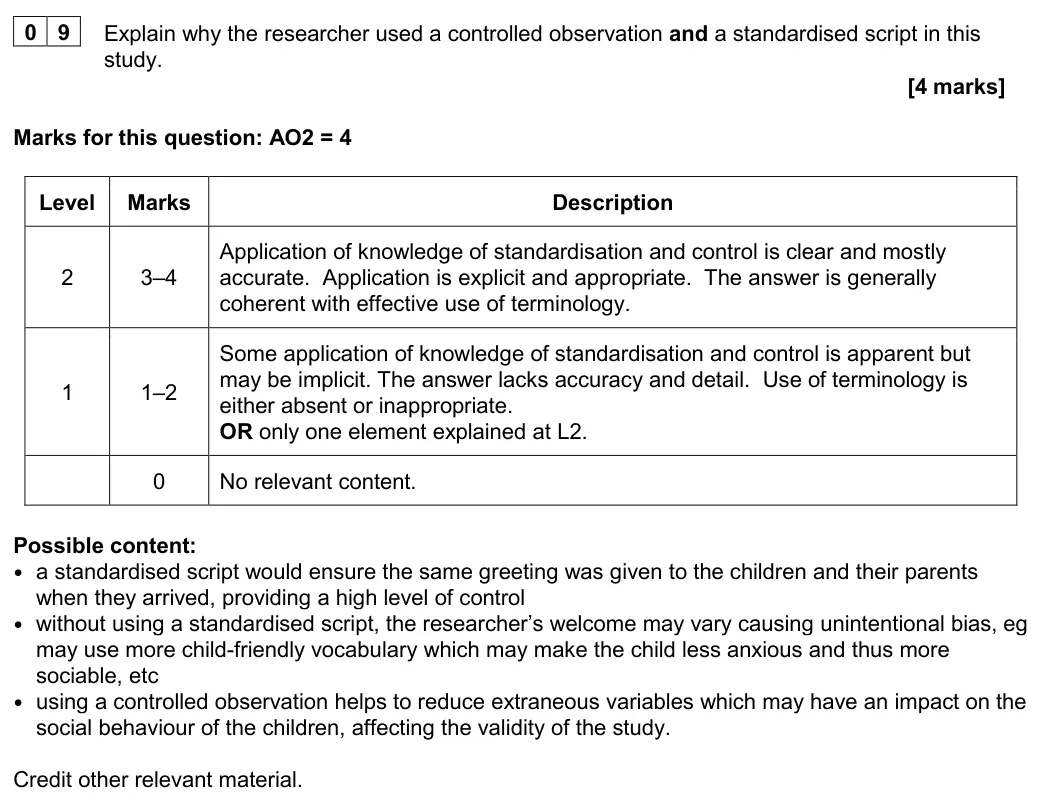
Explain why the researcher used a controlled observation and a standardised script in this
study.
[4 marks]
June 2022 · Paper 2 · Q10 1 mark AO3=1 Research methods research methods
1 0
Identify one limitation of controlled observations.
[1 mark]
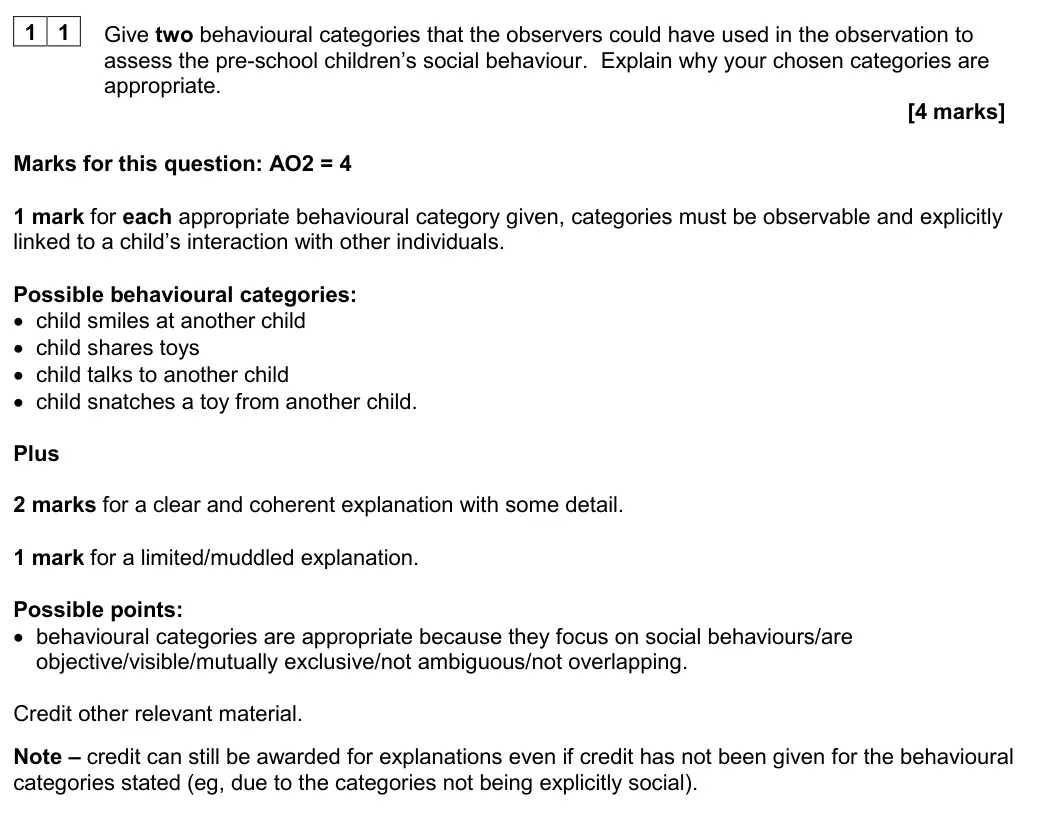
June 2022 · Paper 2 · Q11 4 marks AO2=4 Research methods scientific processes
The researcher used two trained observers to record the social behaviours of each child
during the observation.
1 1
Give two behavioural categories that the observers could have used in the observation to
assess the pre-school children’s social behaviour.  Explain why your chosen categories
are appropriate.
[4 marks]
June 2022 · Paper 2 · Q12 4 marks AO2=4 Research methods scientific processes
1 2
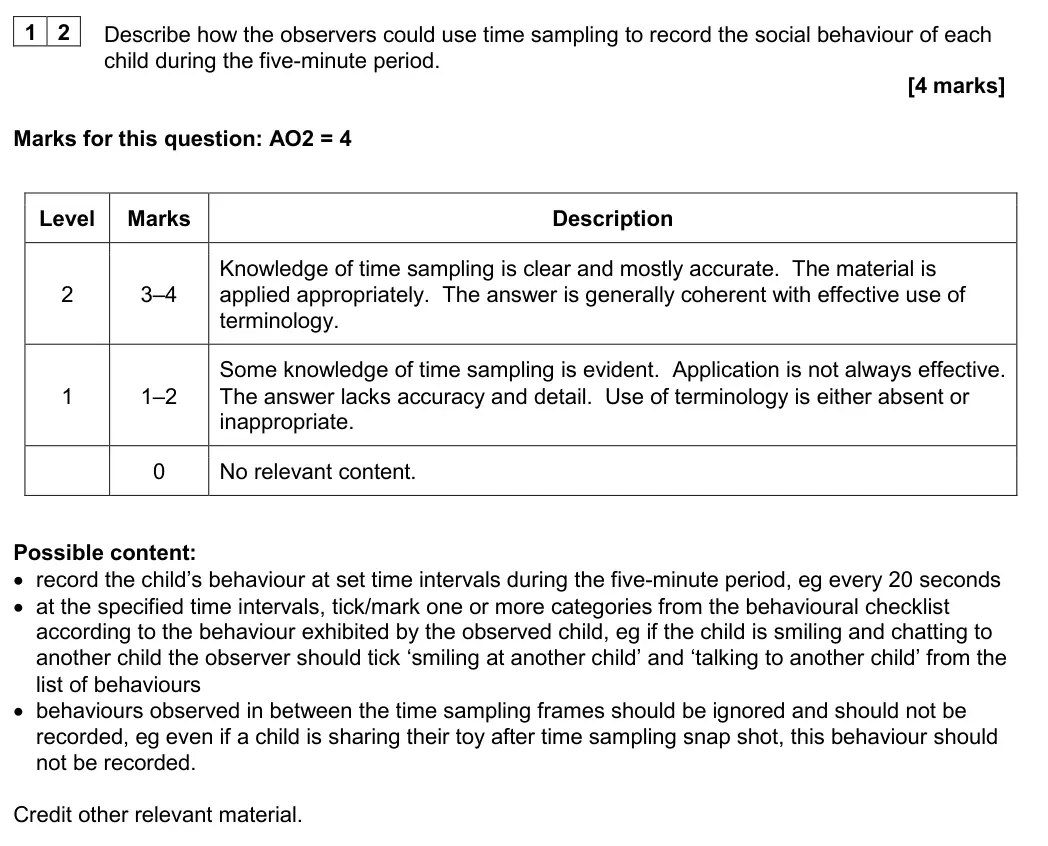
Describe how the observers could use time sampling to record the social behaviour of
each child during the five-minute period.
[4 marks]
June 2022 · Paper 2 · Q13 4 marks AO2=4 Research methods scientific processes
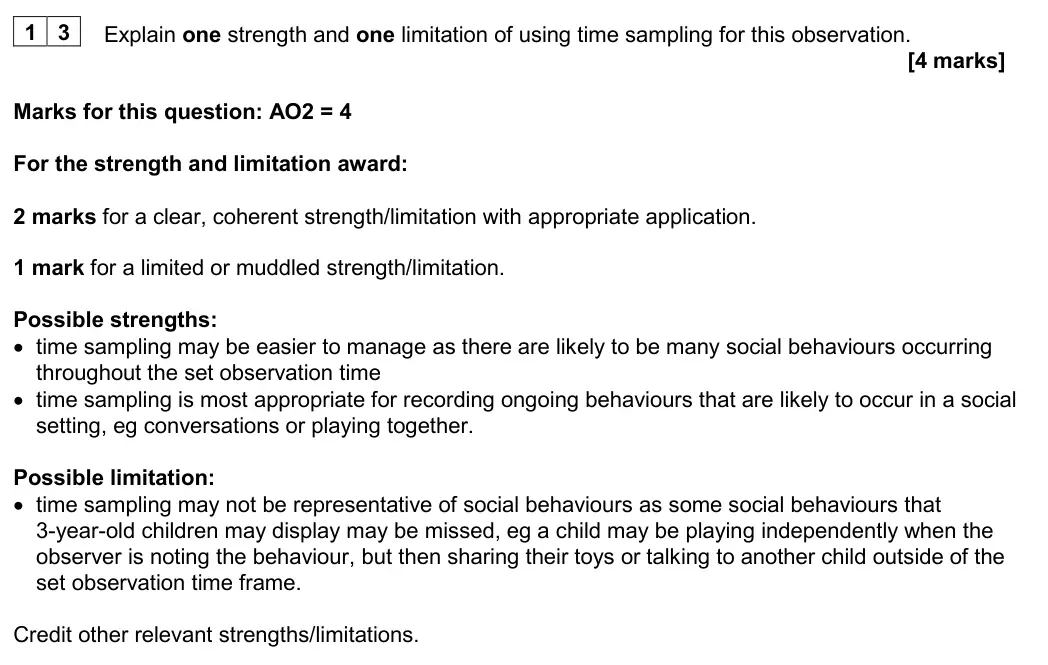
1 3
Explain one strength and one limitation of using time sampling for this observation.
[4 marks]
June 2022 · Paper 2 · Q14 4 marks AO2=4 Research methods scientific processes
1 4
Explain how the reliability of the controlled observation could be assessed through
inter-observer reliability.
[4 marks]
June 2022 · Paper 2 · Q15 7 marks AO2=7 Research methods inferential testingdata handling
The data from the observation was summarised by converting the number of agreed
observations into a total social behaviour score for each child.
The researcher then conducted a statistical test to identify whether there was a significant
difference between the social behaviour scores for the children of stay-at-home parents
and those of working parents.
1 5
Identify an appropriate statistical test that the researcher could use to analyse the social
behaviour scores in this study.  Explain three reasons for your choice in the context of
this study.
[7 marks]
Extra space
June 2022 · Paper 2 · Q16 2 marks AO2=1, AO3=1 Research methods data handlingscientific processes
1 6
Explain one reason why collecting quantitative data could reduce the validity of this study.
[2 marks]
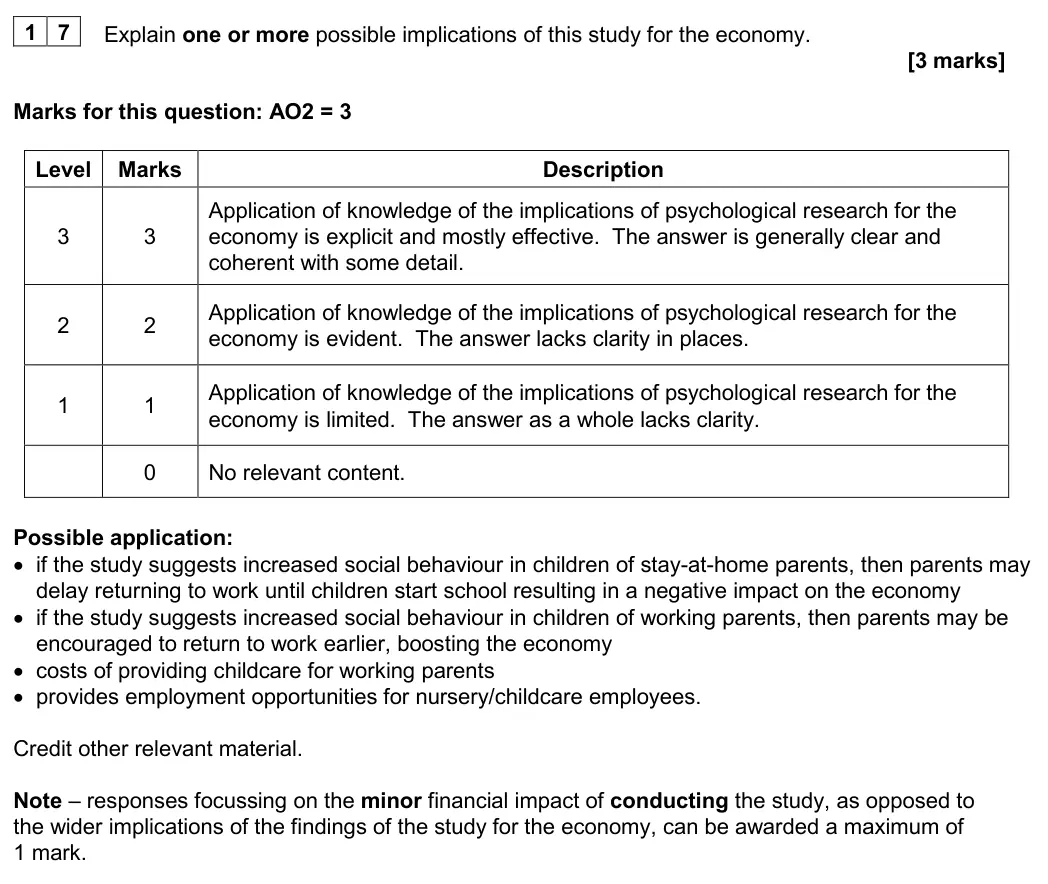
June 2022 · Paper 2 · Q17 3 marks AO2=3 Research methods scientific processes
The findings of this study might have implications for the economy.
1 7
Explain one or more possible implications of this study for the economy.
[3 marks]
June 2022 · Paper 2 · Q18 3 marks AO1=3 Research methods scientific processes
This study was written up as a scientific report.
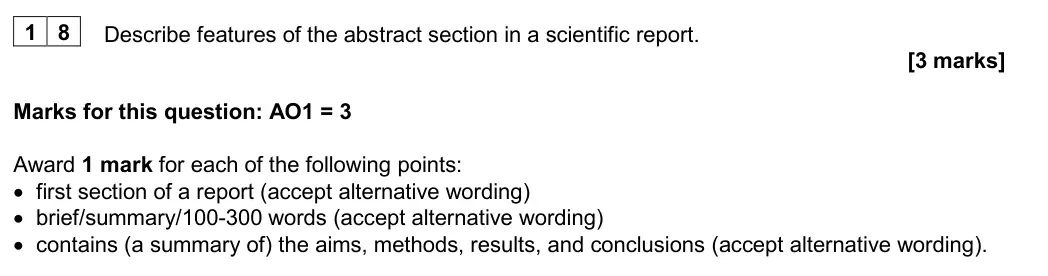
1 8
Describe features of the abstract section in a scientific report.
[3 marks]
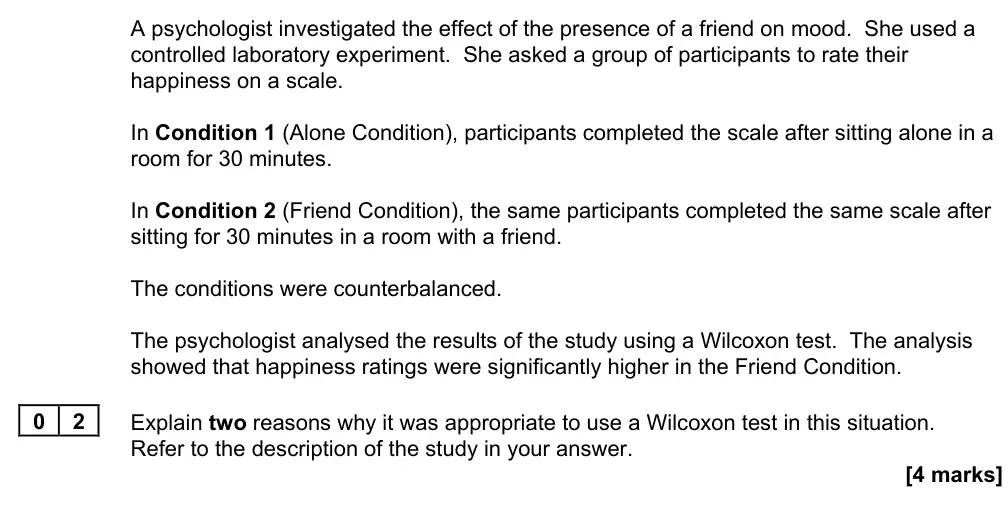
June 2022 · Paper 3 · Q2 4 marks AO2=4 Research methods inferential testingdata handling
A psychologist investigated the effect of the presence of a friend on mood.  She used a
controlled laboratory experiment.  She asked a group of participants to rate their
happiness on a scale.
In Condition 1 (Alone Condition), participants completed the scale after sitting alone in a
room for 30 minutes.
In Condition 2 (Friend Condition), the same participants completed the same scale after
sitting for 30 minutes in a room with a friend.
The conditions were counterbalanced.
The psychologist analysed the results of the study using a Wilcoxon test.  The analysis
showed that happiness ratings were significantly higher in the Friend Condition.
0 2
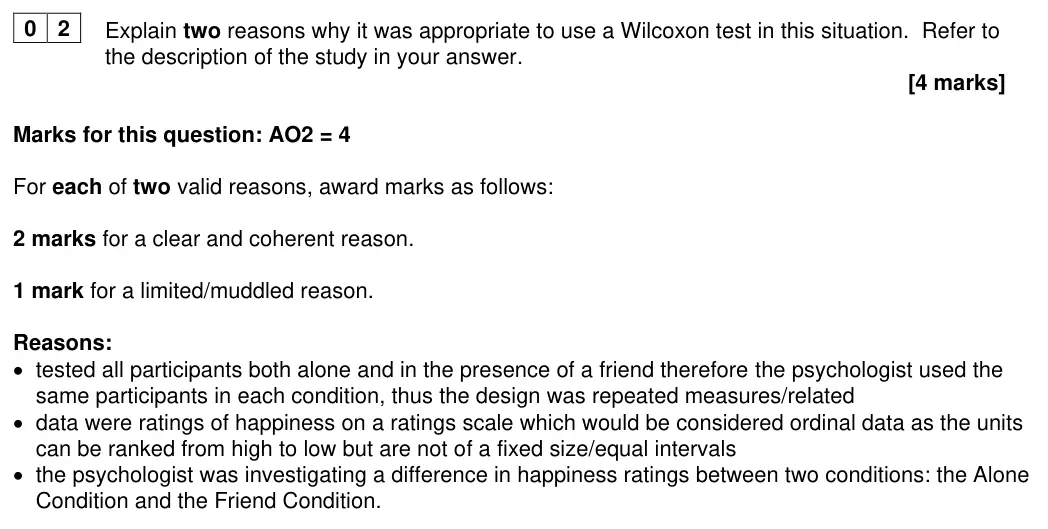
Explain two reasons why it was appropriate to use a Wilcoxon test in this situation.
Refer to the description of the study in your answer.
[4 marks]
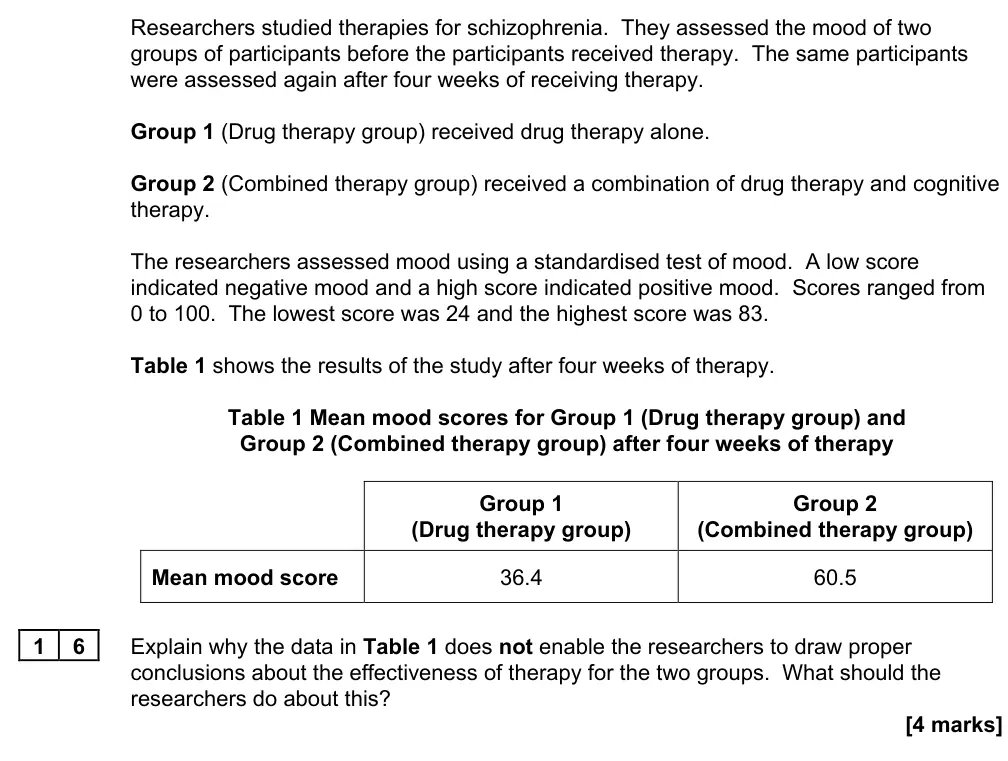
June 2022 · Paper 3 · Q16 4 marks AO3=4 Research methods data handling
Researchers studied therapies for schizophrenia.  They assessed the mood of two
groups of participants before the participants received therapy.  The same participants
were assessed again after four weeks of receiving therapy.
Group 1 (Drug therapy group) received drug therapy alone.
Group 2 (Combined therapy group) received a combination of drug therapy and cognitive
therapy.
The researchers assessed mood using a standardised test of mood.  A low score
indicated negative mood and a high score indicated positive mood.  Scores ranged from
0 to 100.  The lowest score was 24 and the highest score was 83.
Table 1 shows the results of the study after four weeks of therapy.
Table 1 Mean mood scores for Group 1 (Drug therapy group) and
Group 2 (Combined therapy group) after four weeks of therapy
Group 1
Group 2
(Drug therapy group)
(Combined therapy group)
Mean mood score
36.4
60.5
1 6
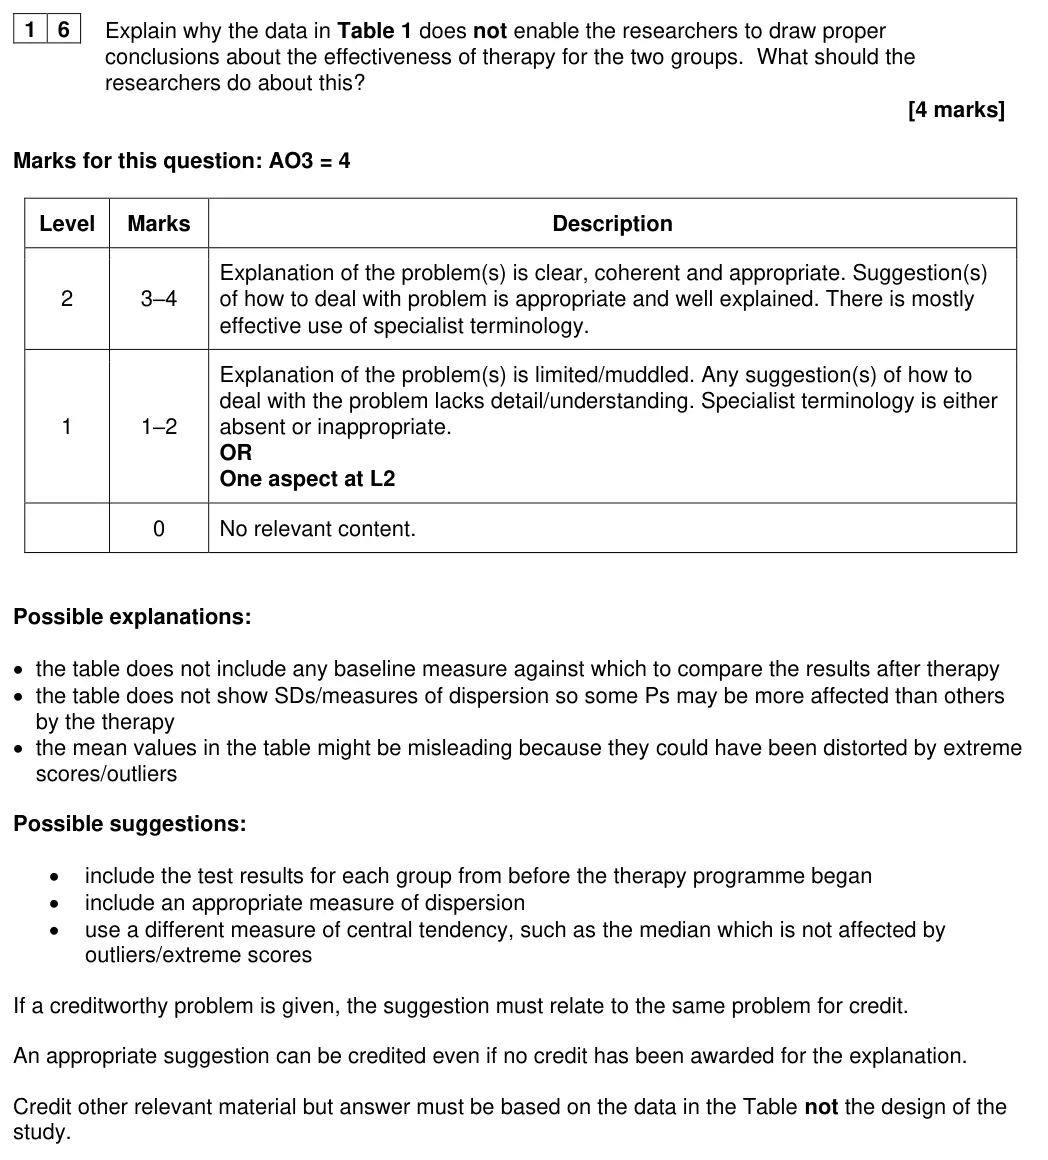
Explain why the data in Table 1 does not enable the researchers to draw proper
conclusions about the effectiveness of therapy for the two groups.  What should the
researchers do about this?
[4 marks]
June 2022 · Paper 3 · Q17 4 marks AO2=4 Research methods data handling
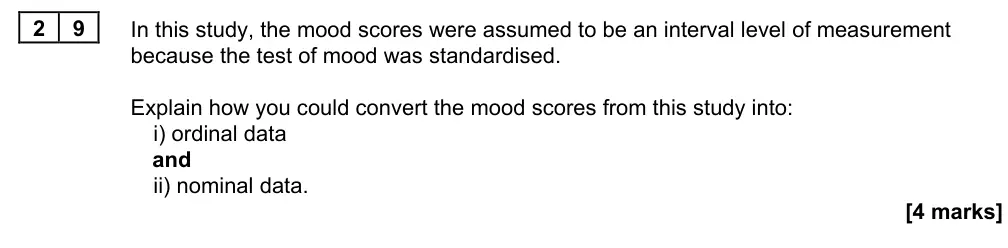
1 7
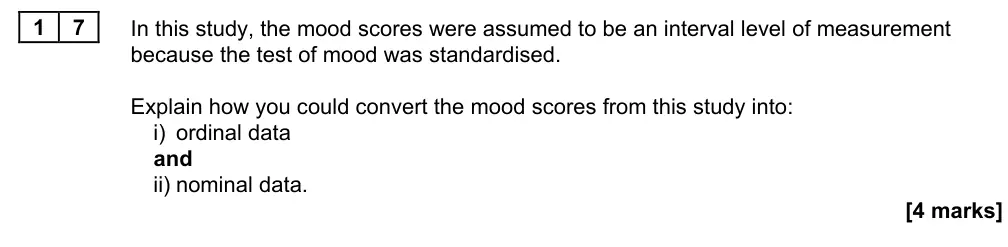
In this study, the mood scores were assumed to be an interval level of measurement
because the test of mood was standardised.
Explain how you could convert the mood scores from this study into:
i) ordinal data
and
ii) nominal data.
[4 marks]
June 2022 · Paper 3 · Q22 4 marks AO3=4 Research methods data handling
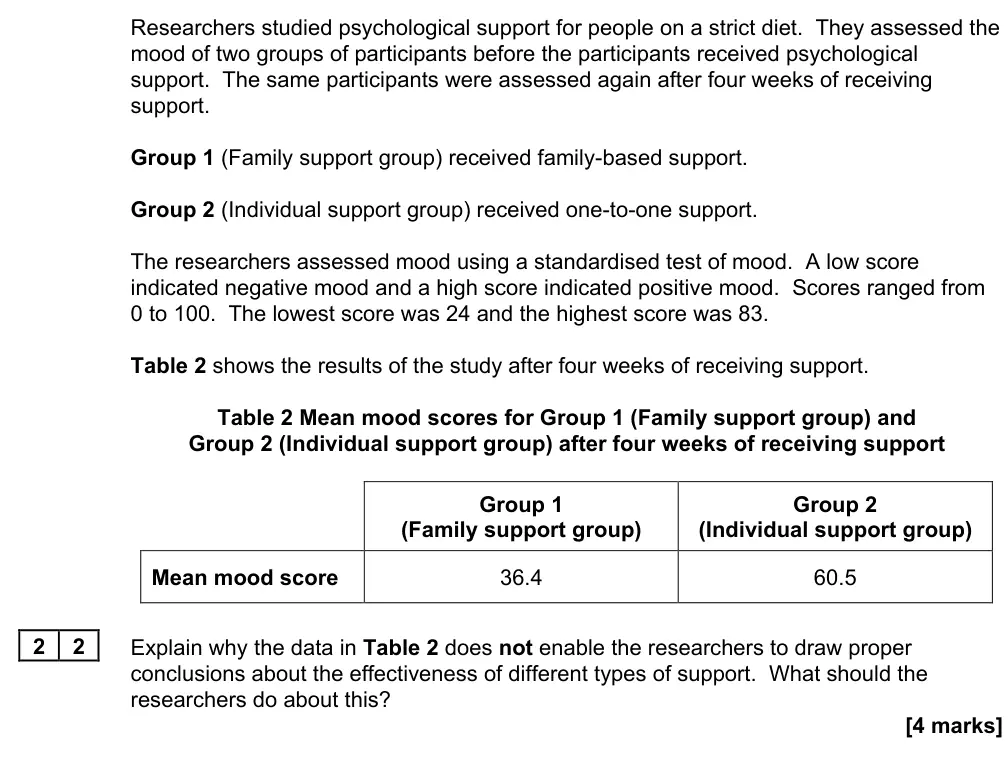
Researchers studied psychological support for people on a strict diet.  They assessed the
mood of two groups of participants before the participants received psychological
support.  The same participants were assessed again after four weeks of receiving
support.
Group 1 (Family support group) received family-based support.
Group 2 (Individual support group) received one-to-one support.
The researchers assessed mood using a standardised test of mood.  A low score
indicated negative mood and a high score indicated positive mood.  Scores ranged from
0 to 100.  The lowest score was 24 and the highest score was 83.
Table 2 shows the results of the study after four weeks of receiving support.
Table 2 Mean mood scores for Group 1 (Family support group) and
Group 2 (Individual support group) after four weeks of receiving support
Group 1
Group 2
(Family support group)
(Individual support group)
Mean mood score
36.4
60.5
2 2
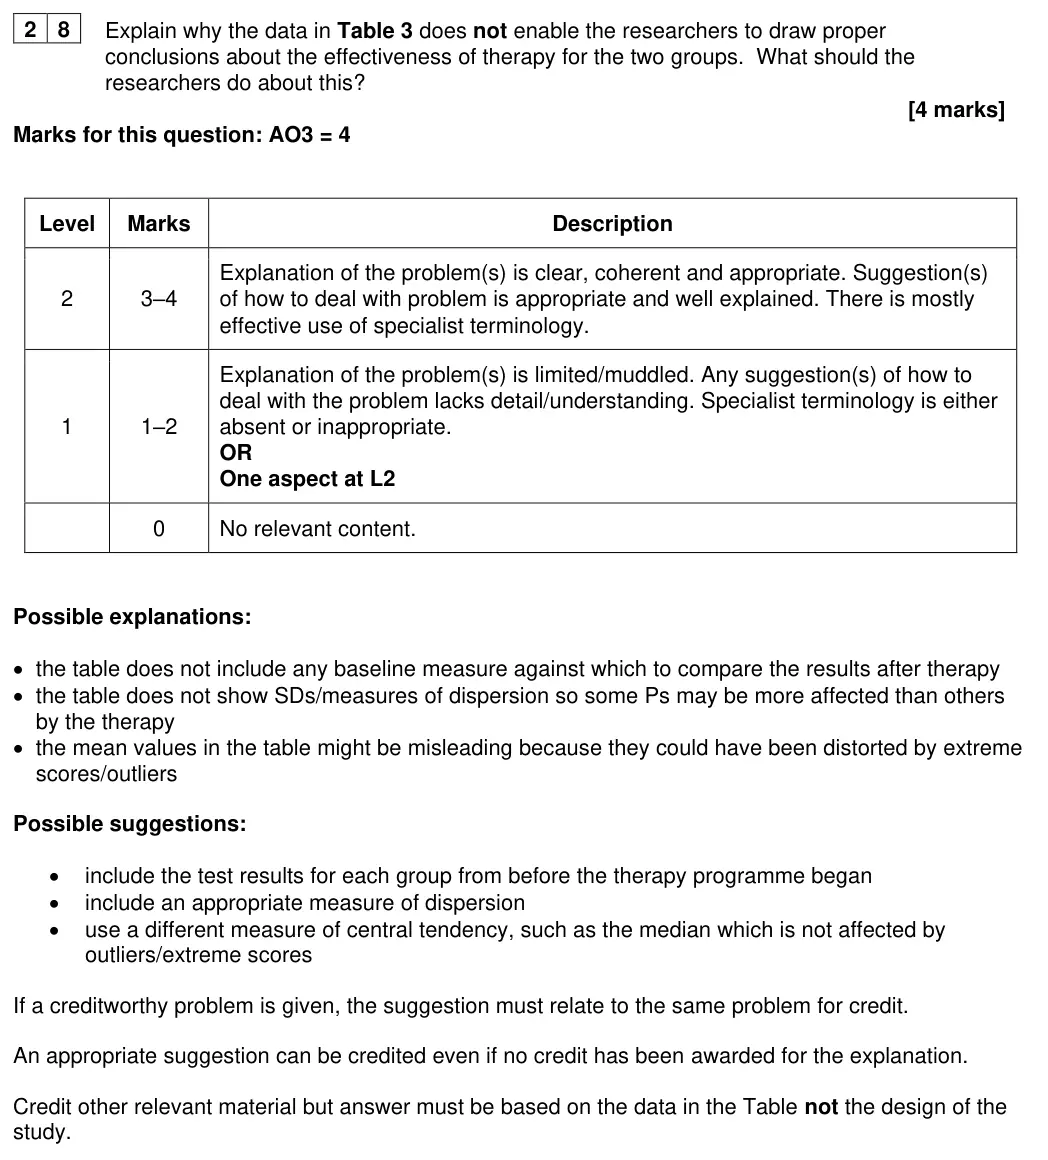
Explain why the data in Table 2 does not enable the researchers to draw proper
conclusions about the effectiveness of different types of support.  What should the
researchers do about this?
[4 marks]
June 2022 · Paper 3 · Q23 4 marks AO2=4 Research methods data handling
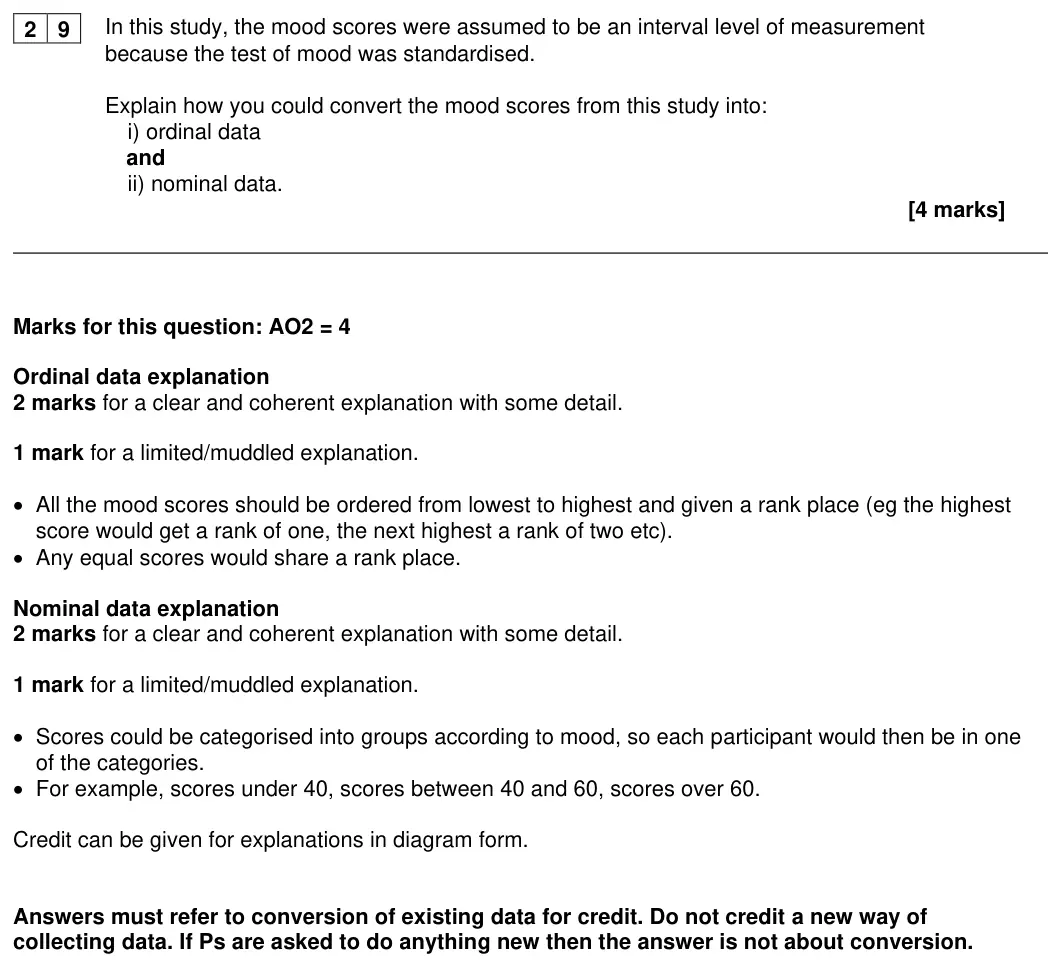
2 3
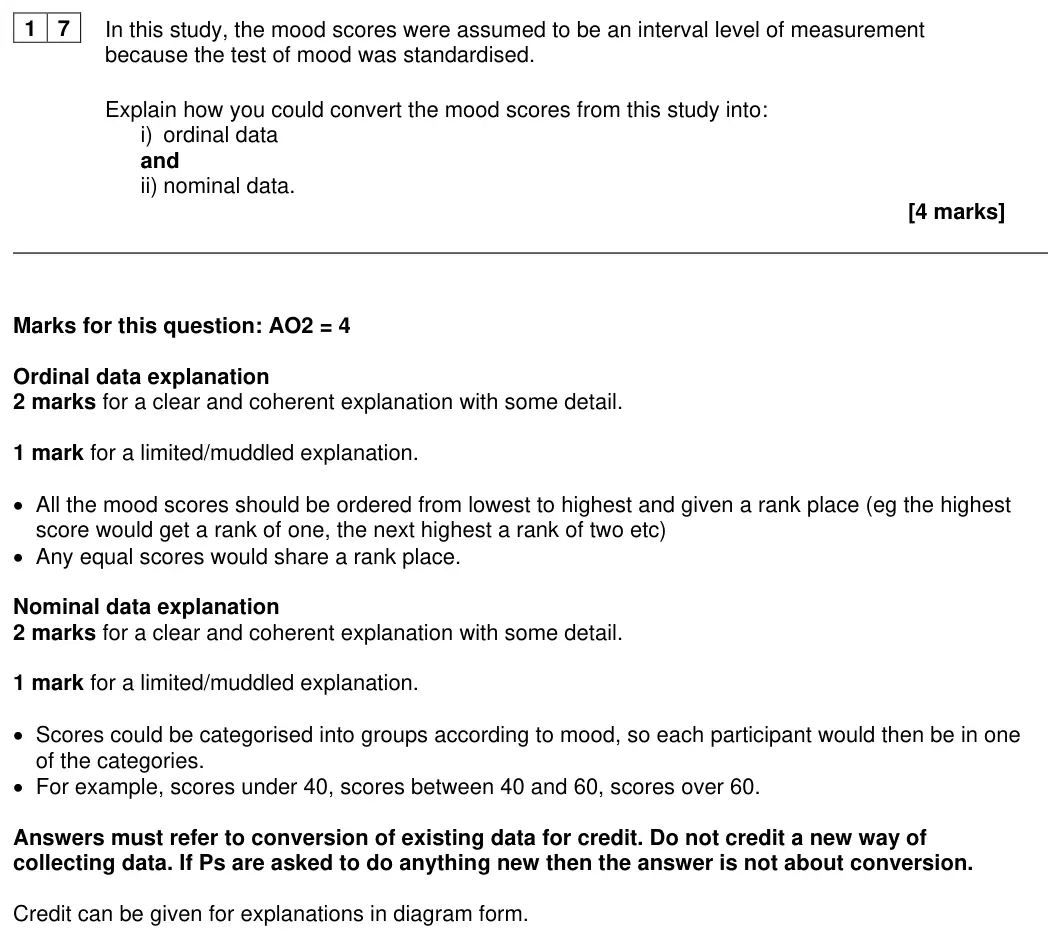
In this study, the mood scores were assumed to be an interval level of measurement
because the test of mood was standardised.
Explain how you could convert the mood scores from this study into:
i) ordinal data
and
ii) nominal data.
[4 marks]
June 2022 · Paper 3 · Q28 4 marks AO3=4 Research methods data handling
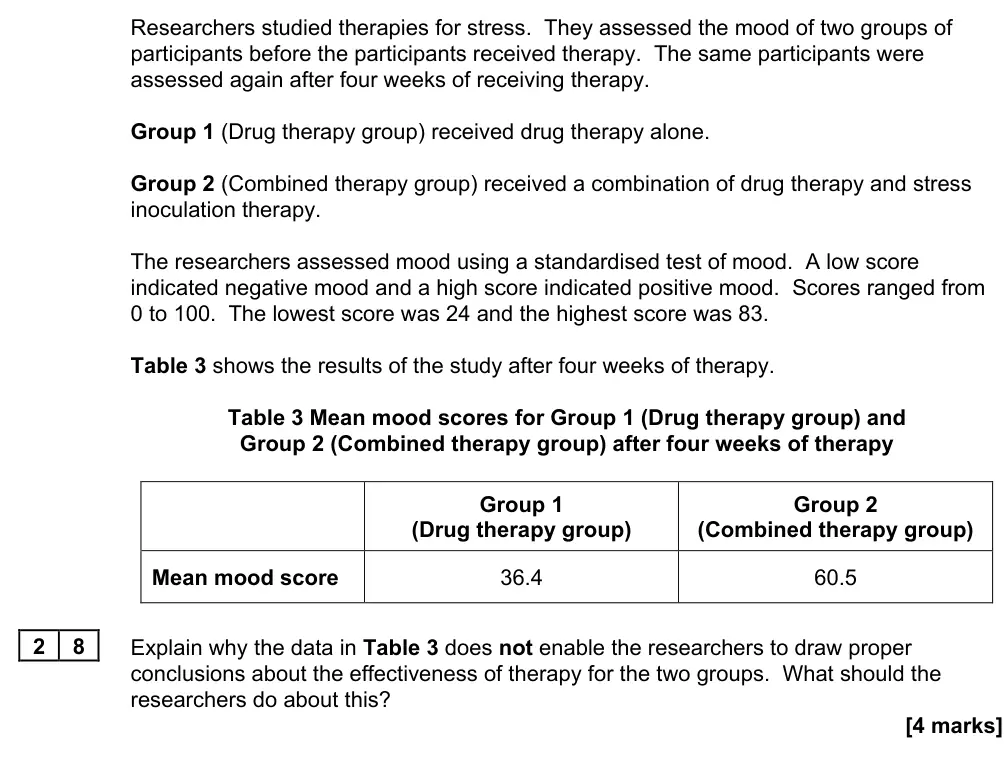
Researchers studied therapies for stress.  They assessed the mood of two groups of
participants before the participants received therapy.  The same participants were
assessed again after four weeks of receiving therapy.
Group 1 (Drug therapy group) received drug therapy alone.
Group 2 (Combined therapy group) received a combination of drug therapy and stress
inoculation therapy.
The researchers assessed mood using a standardised test of mood.  A low score
indicated negative mood and a high score indicated positive mood.  Scores ranged from
0 to 100.  The lowest score was 24 and the highest score was 83.
Table 3 shows the results of the study after four weeks of therapy.
Table 3 Mean mood scores for Group 1 (Drug therapy group) and
Group 2 (Combined therapy group) after four weeks of therapy
Group 1
Group 2
(Drug therapy group)
(Combined therapy group)
Mean mood score
36.4
60.5
2 8
Explain why the data in Table 3 does not enable the researchers to draw proper
conclusions about the effectiveness of therapy for the two groups.  What should the
researchers do about this?
[4 marks]
June 2022 · Paper 3 · Q29 4 marks AO2=4 Research methods data handling
2 9
In this study, the mood scores were assumed to be an interval level of measurement
because the test of mood was standardised.
Explain how you could convert the mood scores from this study into:
i) ordinal data
and
ii) nominal data.
[4 marks]
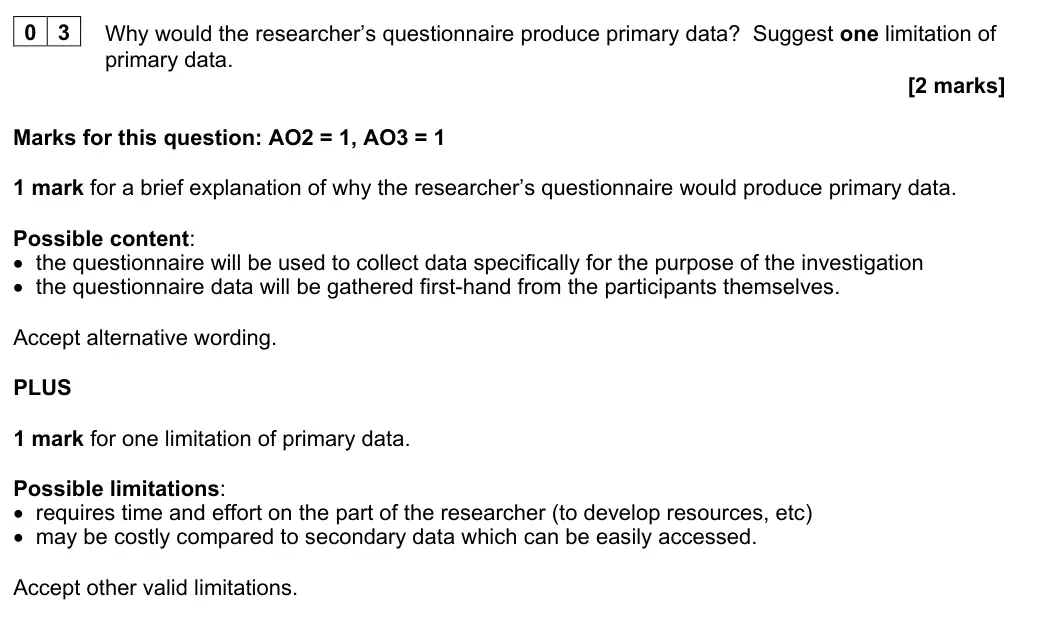
November 2021 · Paper 1 · Q3 2 marks AO2=1, AO3=1 Research methods data handling
0 3
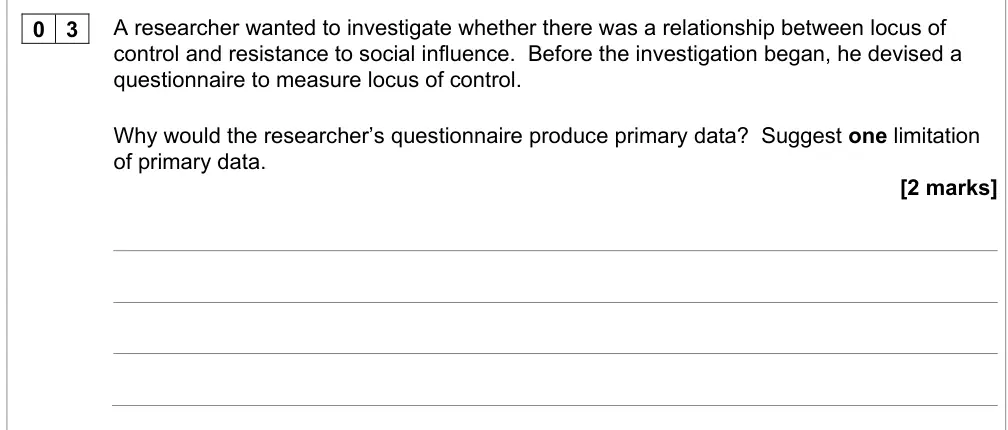
A researcher wanted to investigate whether there was a relationship between locus of
control and resistance to social influence.  Before the investigation began, he devised a
questionnaire to measure locus of control.
Why would the researcher’s questionnaire produce primary data?  Suggest one limitation
of primary data.
[2 marks]
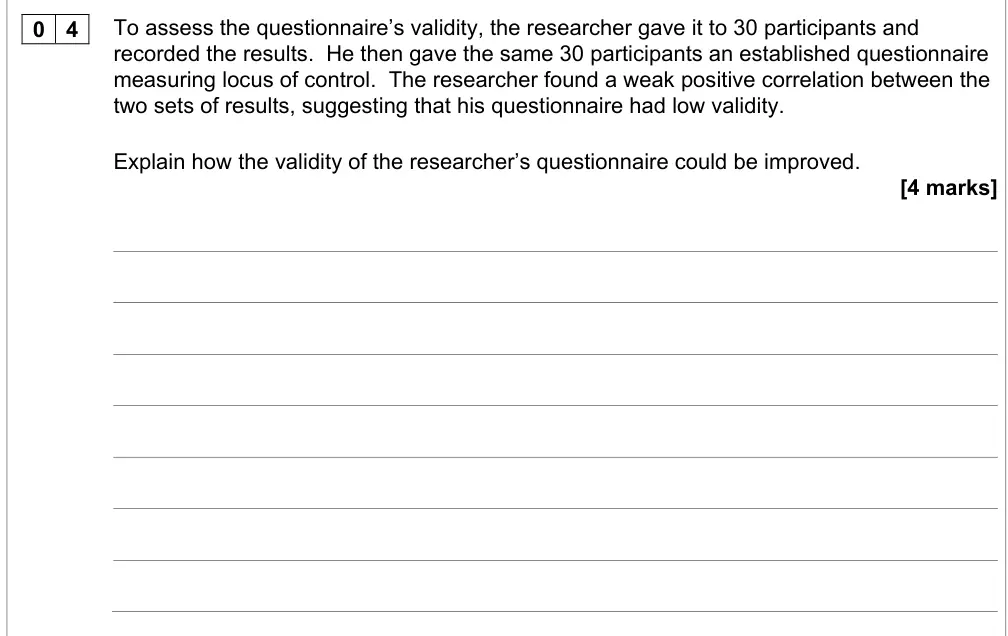
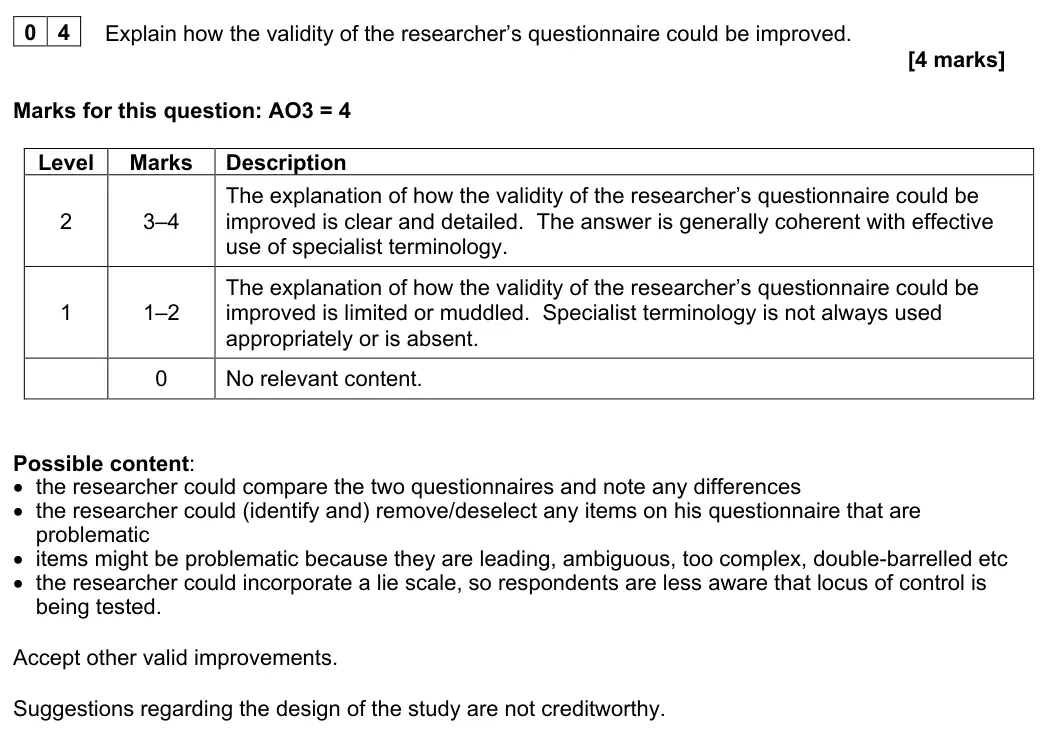
November 2021 · Paper 1 · Q4 4 marks AO3=4 Research methods scientific processes
0 4
To assess the questionnaire’s validity, the researcher gave it to 30 participants and
recorded the results.  He then gave the same 30 participants an established questionnaire
measuring locus of control.  The researcher found a weak positive correlation between the
two sets of results, suggesting that his questionnaire had low validity.
Explain how the validity of the researcher’s questionnaire could be improved.
[4 marks]
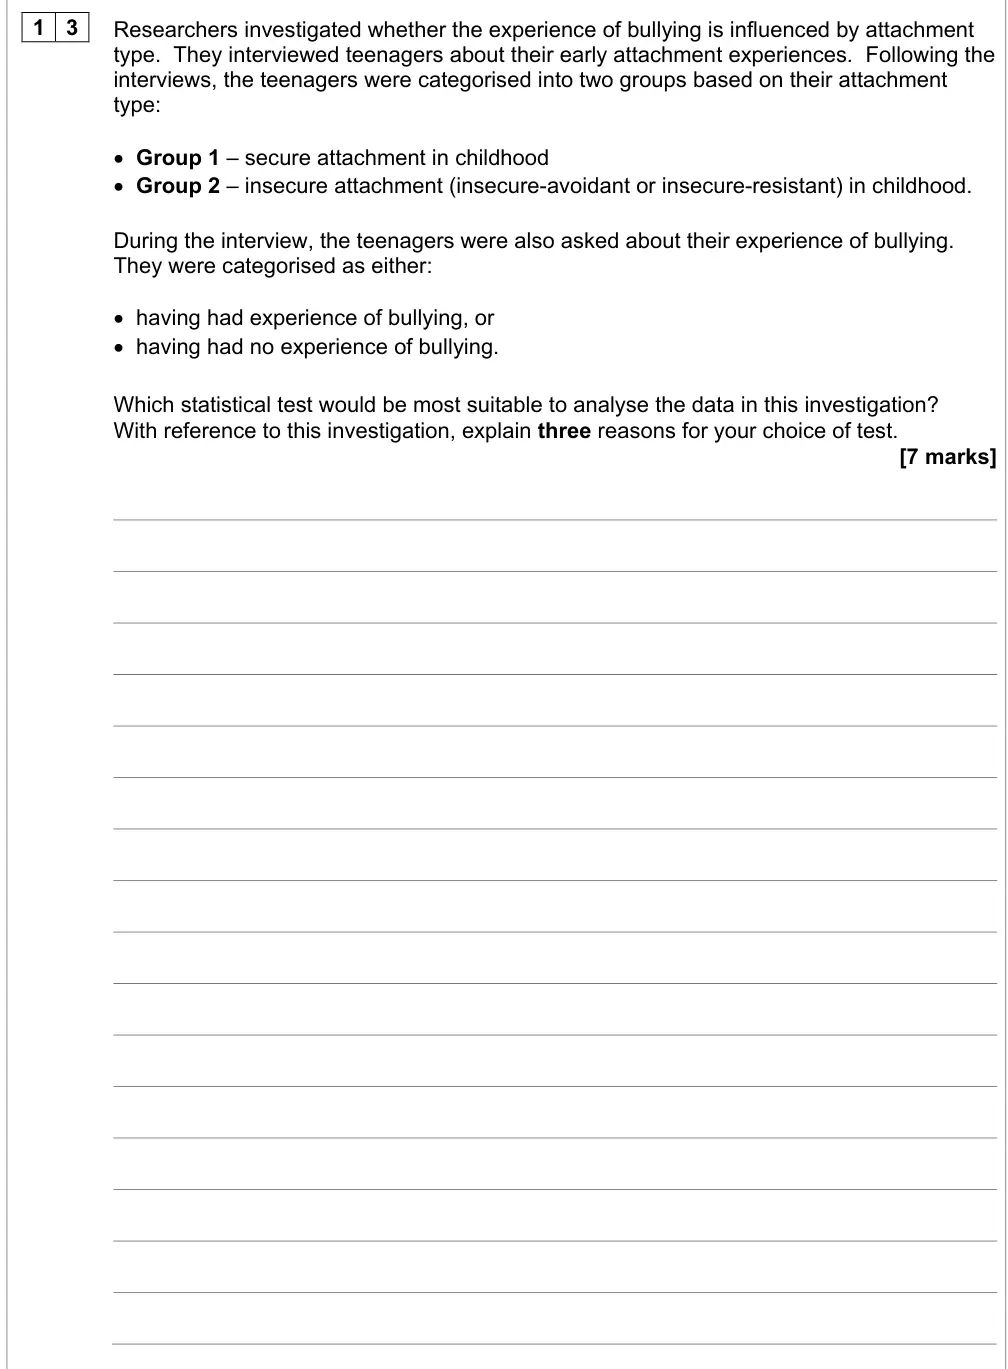
November 2021 · Paper 1 · Q13 7 marks AO2=7 Research methods inferential testingdata handlingscientific processes
1 3
Researchers investigated whether the experience of bullying is influenced by attachment
type.  They interviewed teenagers about their early attachment experiences.  Following the
interviews, the teenagers were categorised into two groups based on their attachment
type:
• Group 1 – secure attachment in childhood
• Group 2 – insecure attachment (insecure-avoidant or insecure-resistant) in childhood.
During the interview, the teenagers were also asked about their experience of bullying.
They were categorised as either:
• having had experience of bullying, or
• having had no experience of bullying.
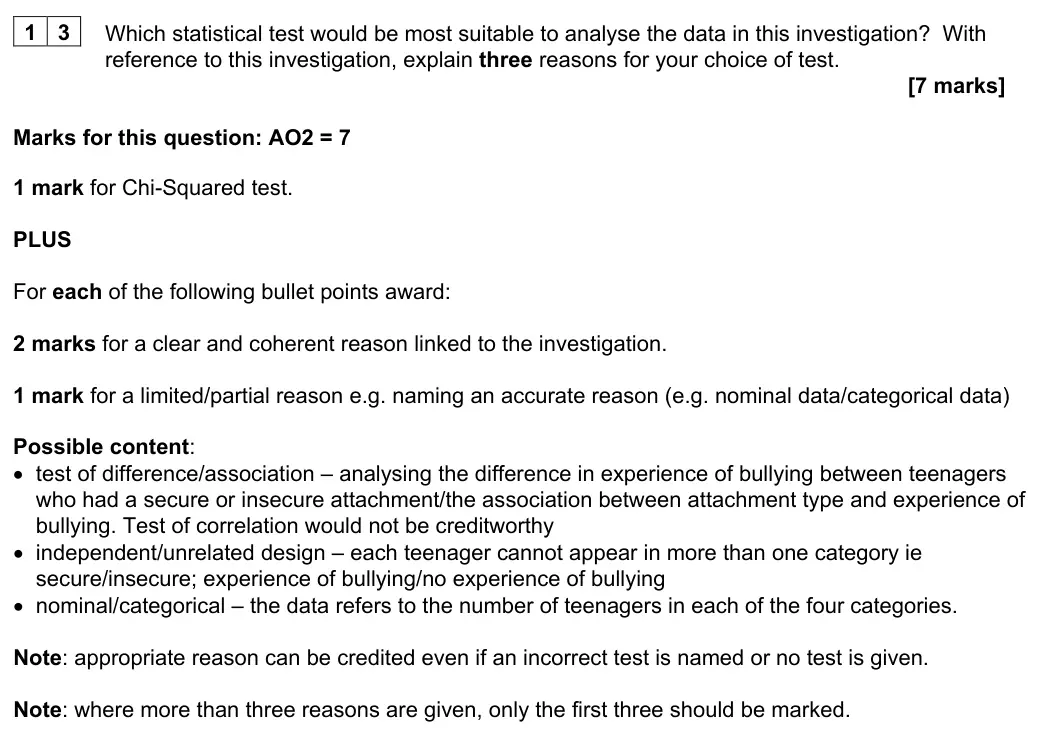
Which statistical test would be most suitable to analyse the data in this investigation?
With reference to this investigation, explain three reasons for your choice of test.
[7 marks]
November 2021 · Paper 2 · Q2 2 marks AO1=2 Research methods scientific processes
0 2
Some critics have said that Pavlov’s studies may lack ecological validity.
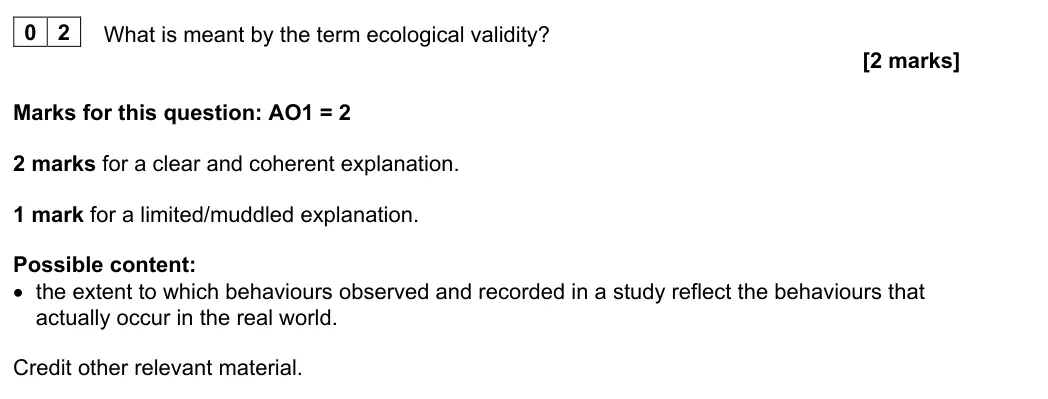
What is meant by the term ecological validity?
[2 marks]
November 2021 · Paper 2 · Q10 3 marks AO2=3 Research methods Medium scientific processes
1 0
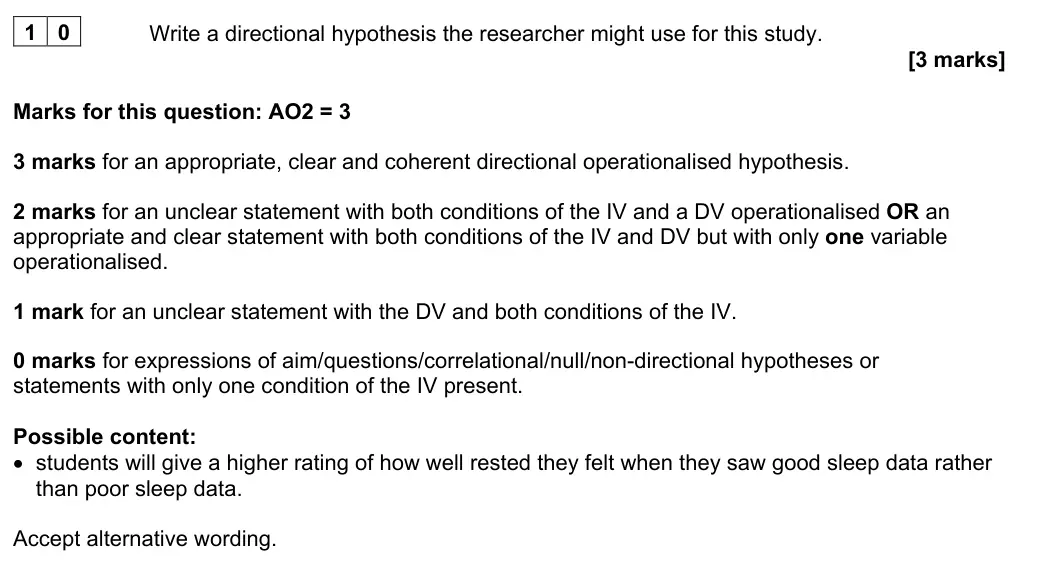
Write a directional hypothesis the researcher might use for this study.
[3 marks]
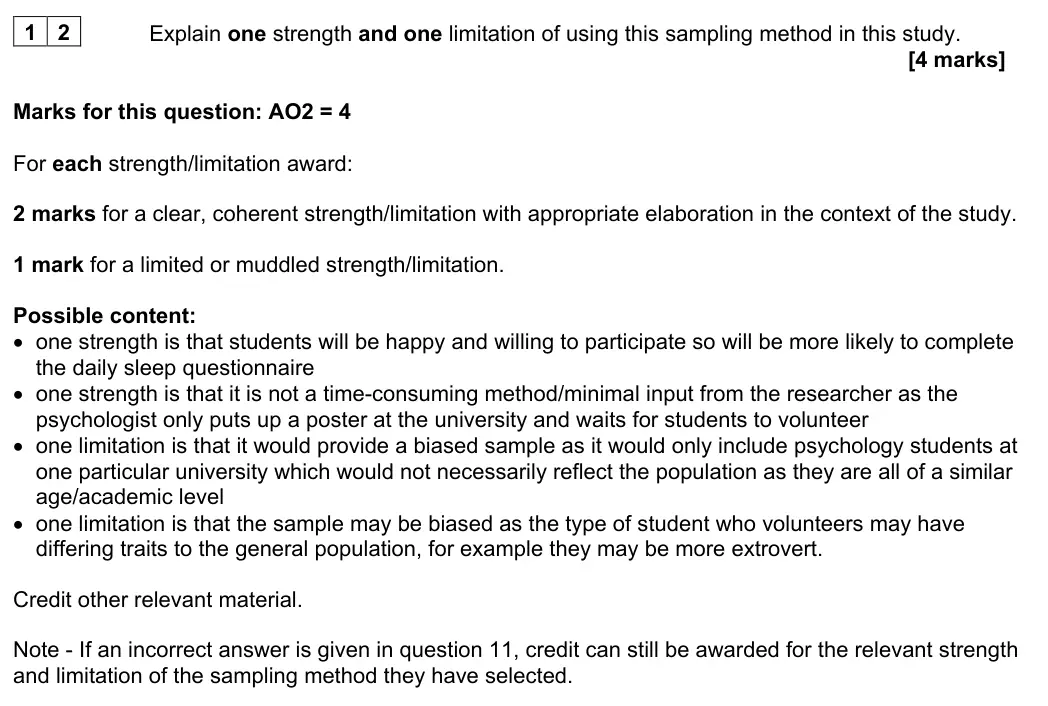
November 2021 · Paper 2 · Q12 4 marks AO2=4 Research methods Medium scientific processes
1 2
Explain one strength and one limitation of using this sampling method in this study.
[4 marks]
November 2021 · Paper 2 · Q13 2 marks AO2=2 Research methods data handling
The researcher collected quantitative data about how well rested the students felt.
1 3
Explain one strength of collecting quantitative data in this study.
[2 marks]
November 2021 · Paper 2 · Q14 2 marks AO2=2 Research methods scientific processes
One ethical issue in this study is deception, as the students were unaware that the sleep
data they could see on their phones had been manipulated by the researcher.
1 4
Explain one way in which the researcher might deal with the deception in this study.
[2 marks]
November 2021 · Paper 2 · Q15 2 marks AO2=2 Research methods scientific processes
Apart from the question about how well rested the students felt, the researcher’s
questionnaire contained nine other questions.  The responses to these questions were not
analysed.
1 5
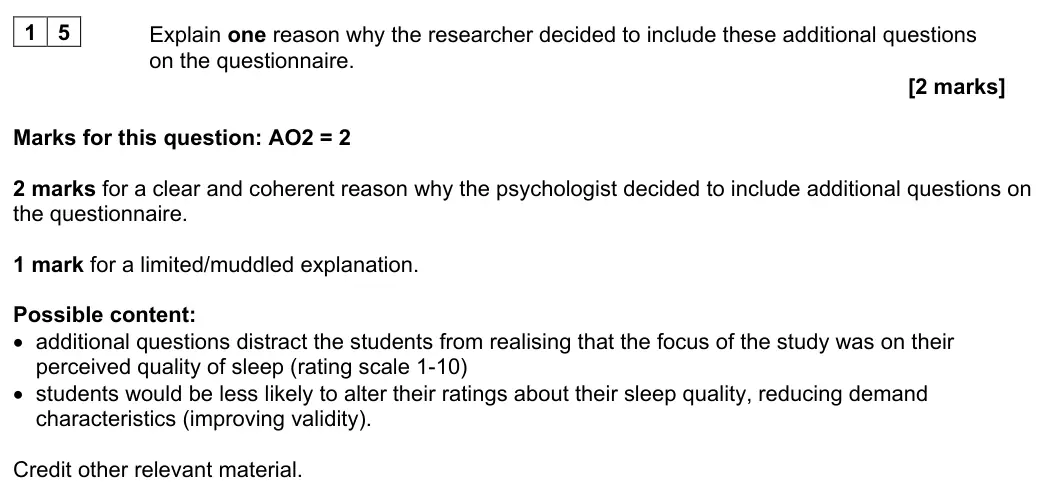
Explain one reason why the researcher decided to include these additional questions on
the questionnaire.
[2 marks]
November 2021 · Paper 2 · Q16 2 marks AO2=2 Research methods scientific processesresearch methods
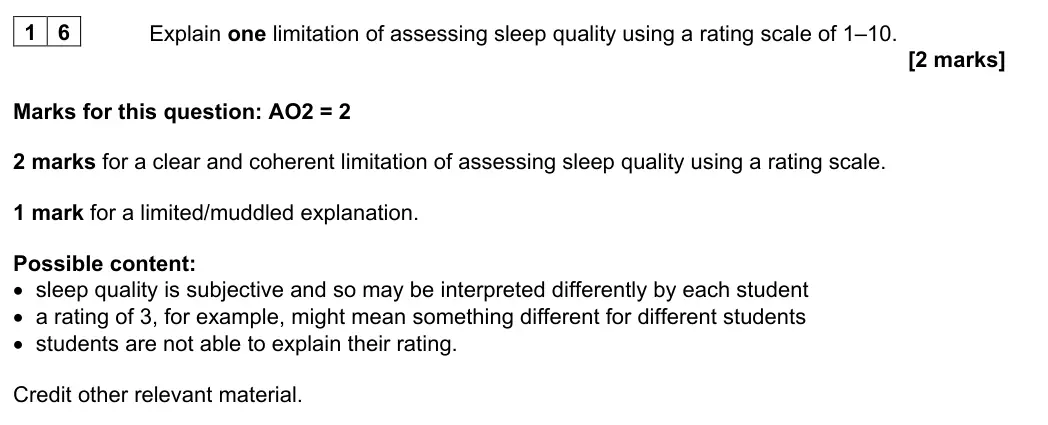
1 6
Explain one limitation of assessing sleep quality using a rating scale of 1–10.
[2 marks]
November 2021 · Paper 2 · Q17 4 marks AO3=4 Research methods Medium scientific processes
The researcher believed that the actual number of hours slept by the students could have
affected the results of the study.
1 7
Suggest one other extraneous variable that could have affected the results of this study.
Explain why it would have been important to control this extraneous variable and how it
could have been controlled in this study.
[4 marks]
Extra space
November 2021 · Paper 2 · Q18 2 marks AO2=2 Research methods Hard research methods
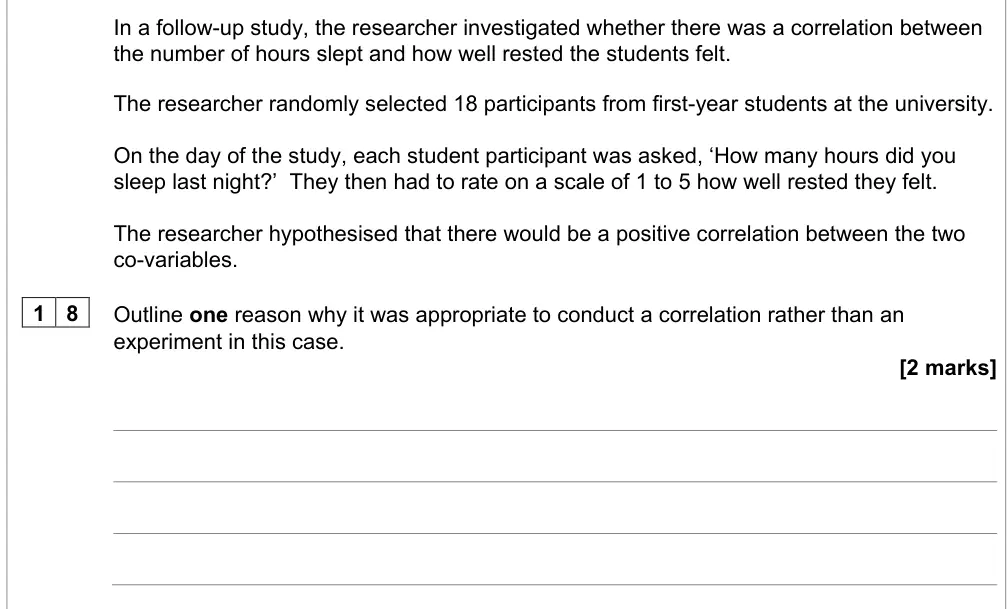
In a follow-up study, the researcher investigated whether there was a correlation between
the number of hours slept and how well rested the students felt.
The researcher randomly selected 18 participants from first-year students at the university.
On the day of the study, each student participant was asked, ‘How many hours did you
sleep last night?’  They then had to rate on a scale of 1 to 5 how well rested they felt.
The researcher hypothesised that there would be a positive correlation between the two
co-variables.
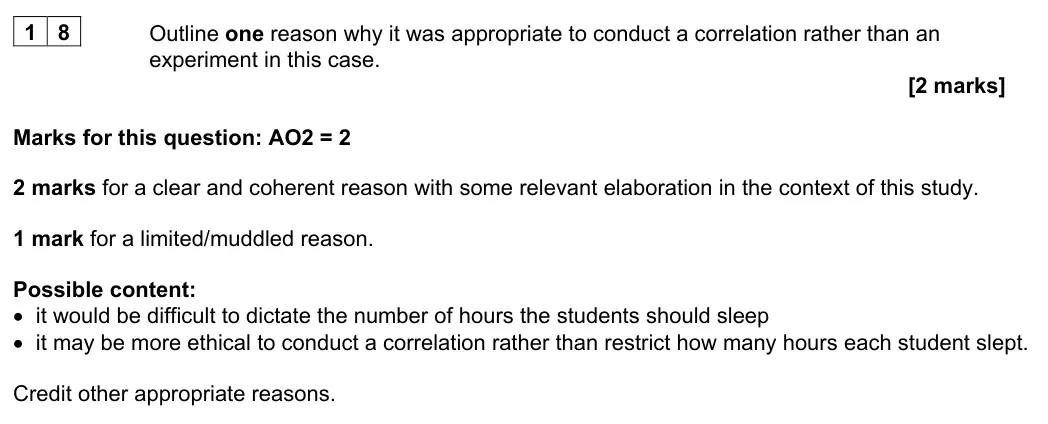
1 8
Outline one reason why it was appropriate to conduct a correlation rather than an
experiment in this case.
[2 marks]
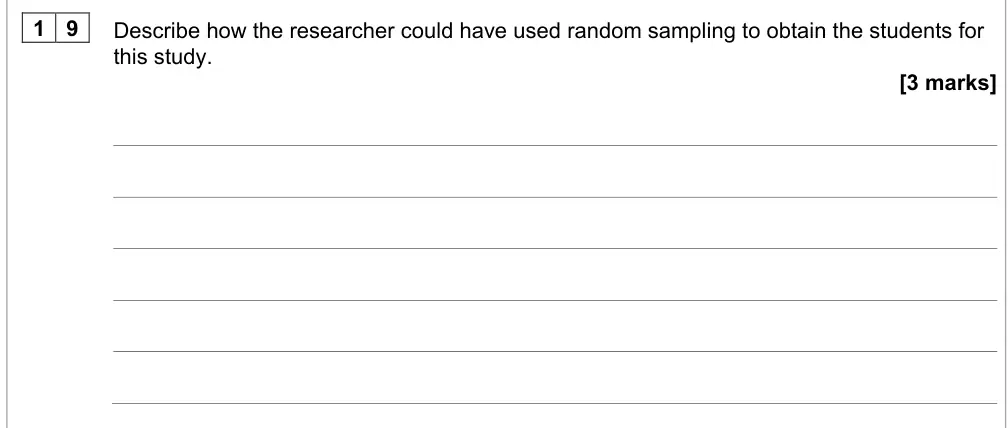
November 2021 · Paper 2 · Q19 3 marks AO2=3 Research methods scientific processes
1 9
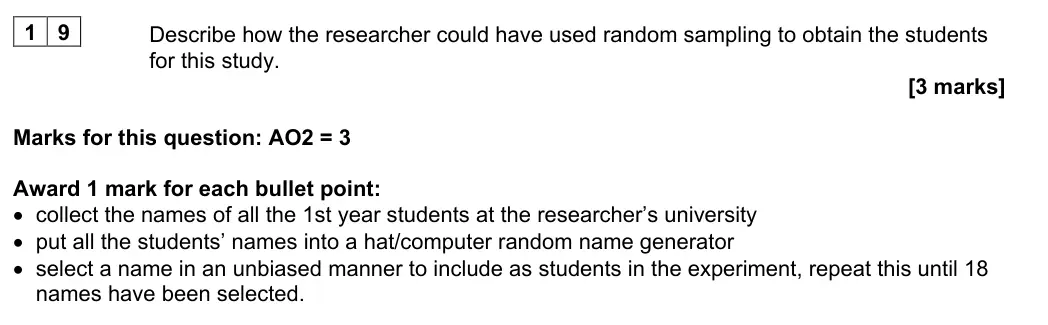
Describe how the researcher could have used random sampling to obtain the students for
this study.
[3 marks]
November 2021 · Paper 2 · Q20 4 marks AO2=4 Research methods inferential testingdata handling
The researcher used Spearman’s rho statistical test to analyse the data from this study.
2 0
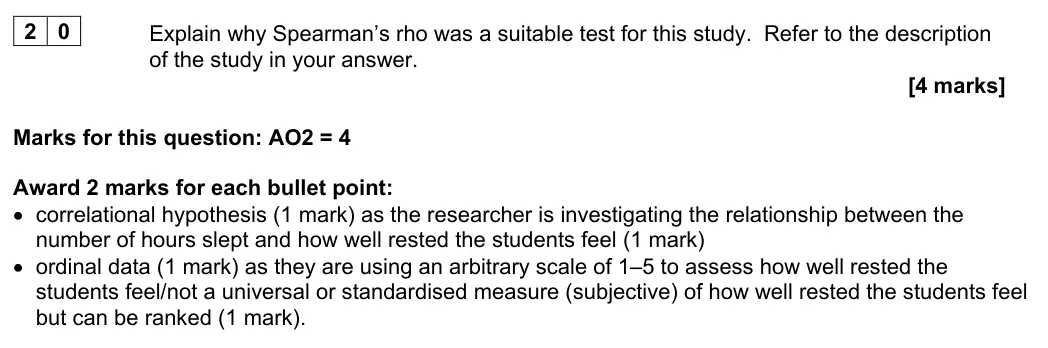
Explain why Spearman’s rho was a suitable test for this study.  Refer to the description of
the study in your answer.
[4 marks]
Extra space
November 2021 · Paper 2 · Q21 4 marks AO2=4 Research methods inferential testing
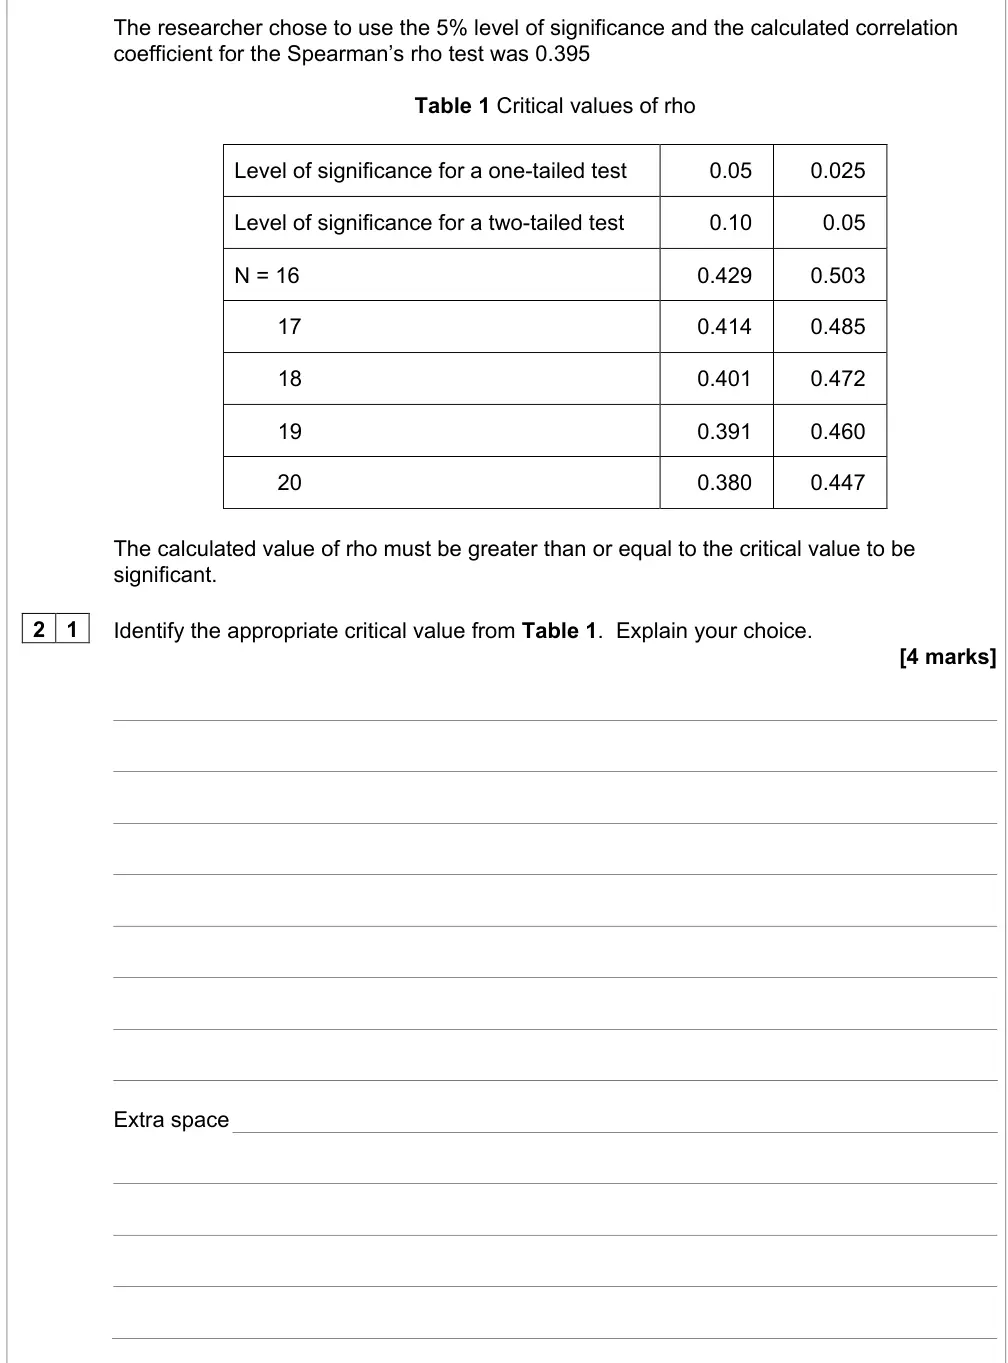
The researcher chose to use the 5% level of significance and the calculated correlation
coefficient for the Spearman’s rho test was 0.395
Table 1 Critical values of rho
Level of significance for a one-tailed test
0.05
0.025
Level of significance for a two-tailed test
0.10
0.05
N = 16
0.429
0.503
17
0.414
0.485
18
0.401
0.472
19
0.391
0.460
20
0.380
0.447
The calculated value of rho must be greater than or equal to the critical value to be
significant.
2 1
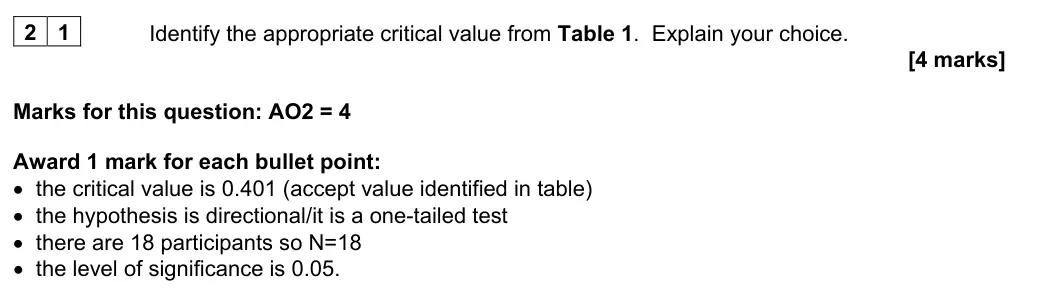
Identify the appropriate critical value from Table 1.  Explain your choice.
[4 marks]
Extra space
November 2021 · Paper 2 · Q22 2 marks AO2=2 Research methods Easy inferential testing
2 2
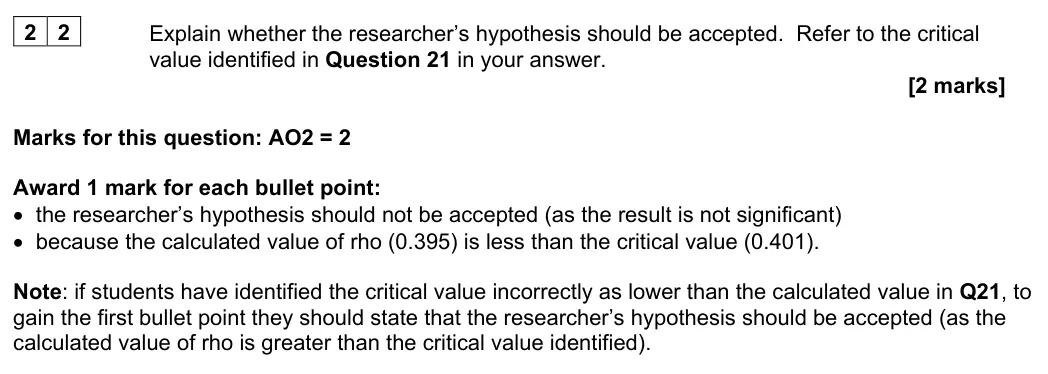
Explain whether the researcher’s hypothesis should be accepted.  Refer to the critical
value identified in Question 21 in your answer.
[2 marks]
November 2021 · Paper 2 · Q23 2 marks AO2=2 Research methods Hard inferential testing
2 3
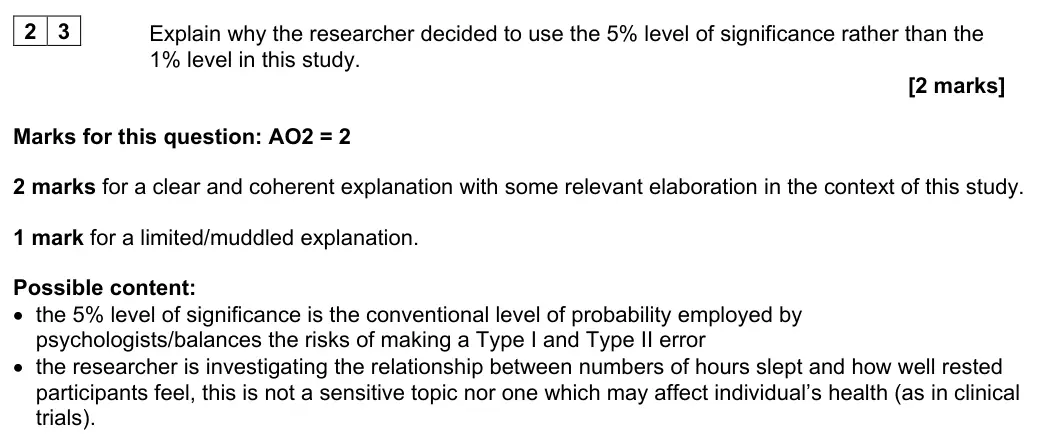
Explain why the researcher decided to use the 5% level of significance rather than the
1% level in this study.
[2 marks]
November 2021 · Paper 2 · Q24 2 marks AO2=2 Research methods inferential testing
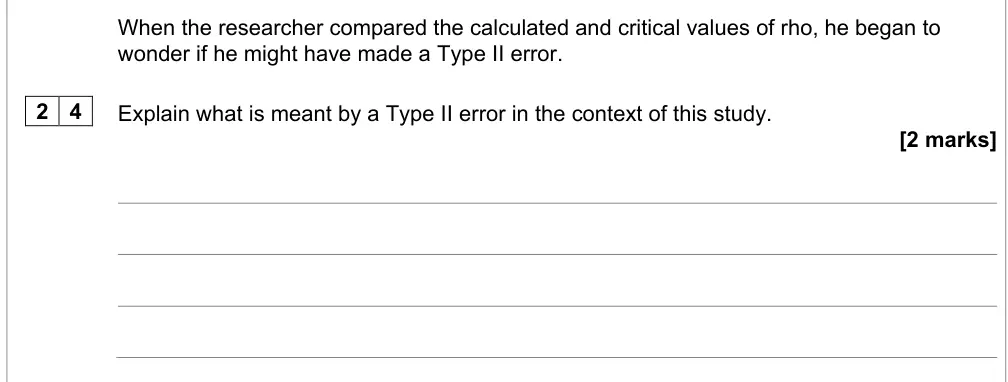
When the researcher compared the calculated and critical values of rho, he began to
wonder if he might have made a Type II error.
2 4
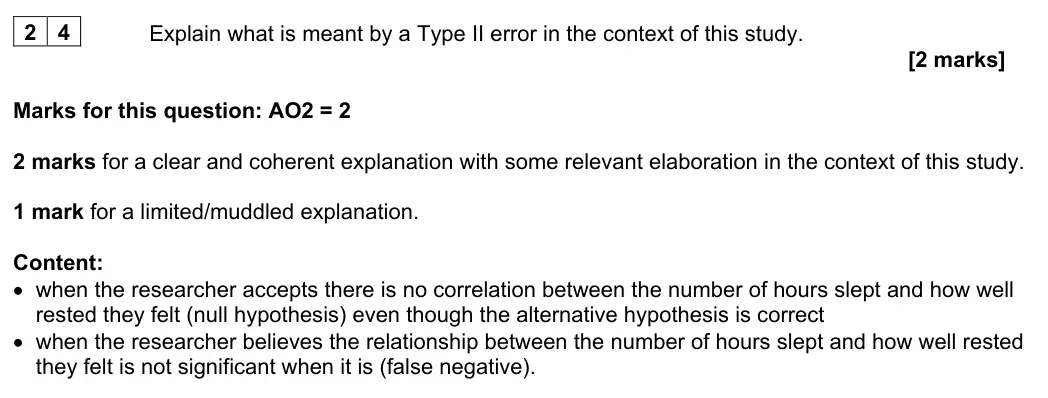
Explain what is meant by a Type II error in the context of this study.
[2 marks]
November 2021 · Paper 3 · Q2 4 marks AO1=2, AO2=2 Research methods scientific processes
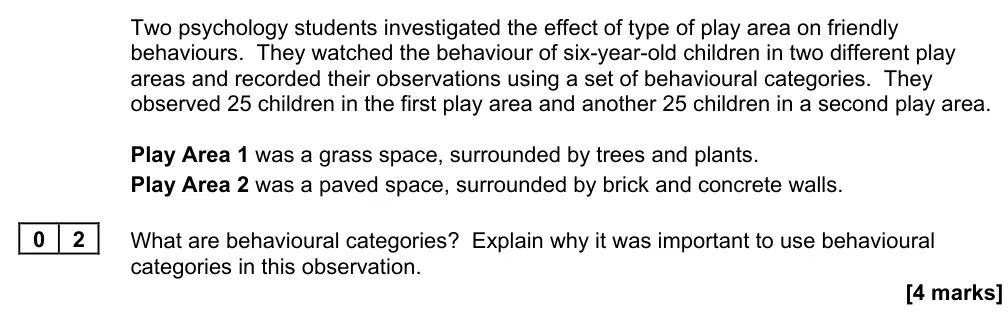
Two psychology students investigated the effect of type of play area on friendly
behaviours.  They watched the behaviour of six-year-old children in two different play
areas and recorded their observations using a set of behavioural categories.  They
observed 25 children in the first play area and another 25 children in a second play area.
Play Area 1 was a grass space, surrounded by trees and plants.
Play Area 2 was a paved space, surrounded by brick and concrete walls.
0 2
What are behavioural categories?  Explain why it was important to use behavioural
categories in this observation.
[4 marks]
November 2021 · Paper 3 · Q3 4 marks AO3=4 Research methods scientific processes
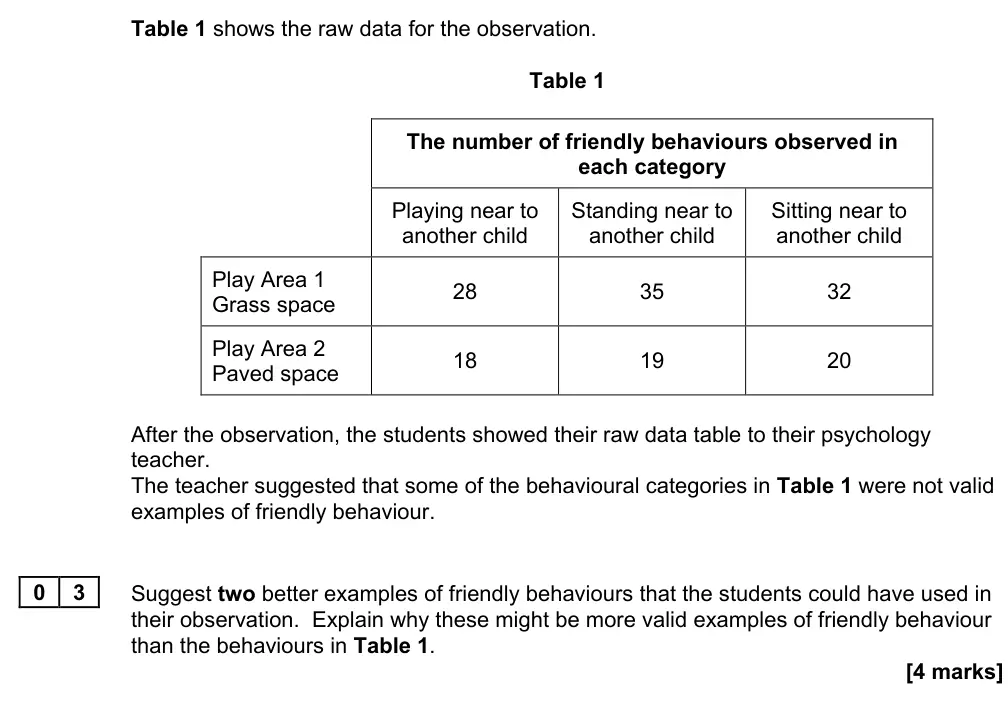
Table 1 shows the raw data for the observation.
Table 1
The number of friendly behaviours observed in
each category
Playing near to
Standing near to
Sitting near to
another child
another child
another child
Play Area 1
28
35
32
Grass space
Play Area 2
18
19
20
Paved space
After the observation, the students showed their raw data table to their psychology
teacher.
The teacher suggested that some of the behavioural categories in Table 1 were not valid
examples of friendly behaviour.
0 3
Suggest two better examples of friendly behaviours that the students could have used in
their observation.  Explain why these might be more valid examples of friendly behaviour
than the behaviours in Table 1.
[4 marks]
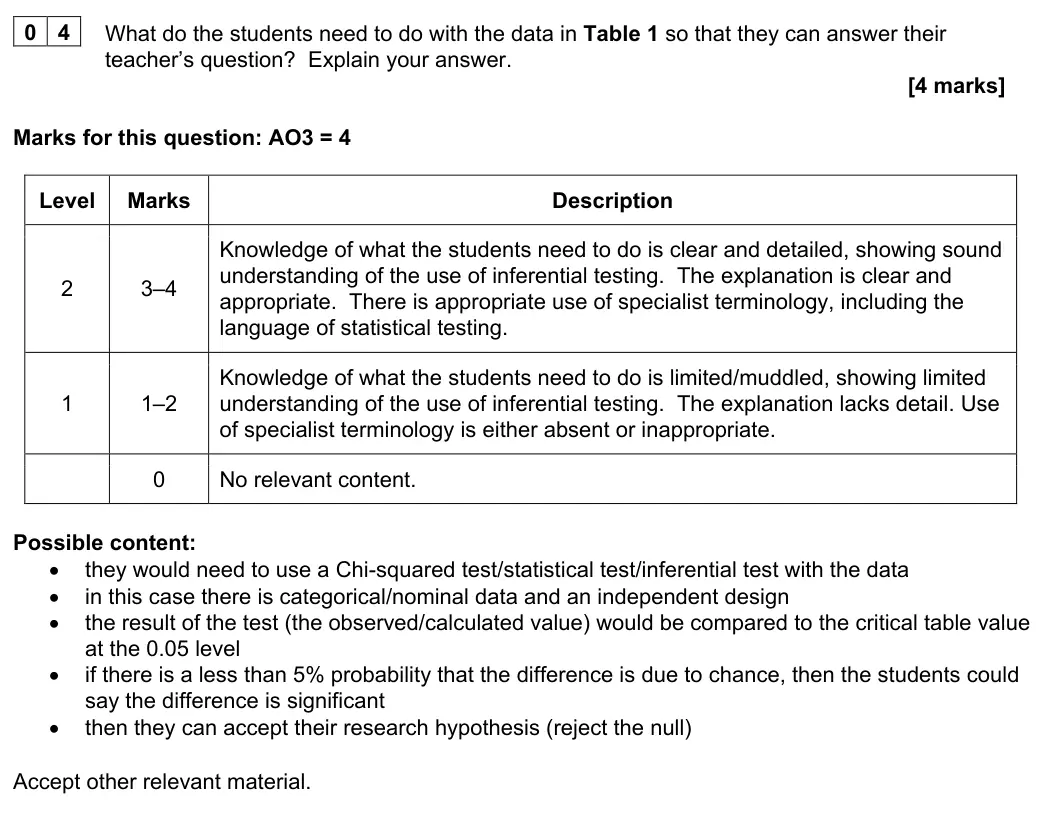
November 2021 · Paper 3 · Q4 4 marks AO3=4 Research methods inferential testing
When she looks at the results in Table 1, the teacher says, “I can see there is a
difference in behaviour between the two conditions, but is the difference significant at the
0.05 level of significance?”
0 4
What do the students need to do with the data in Table 1 so that they can answer their
teacher’s question?  Explain your answer.
[4 marks]
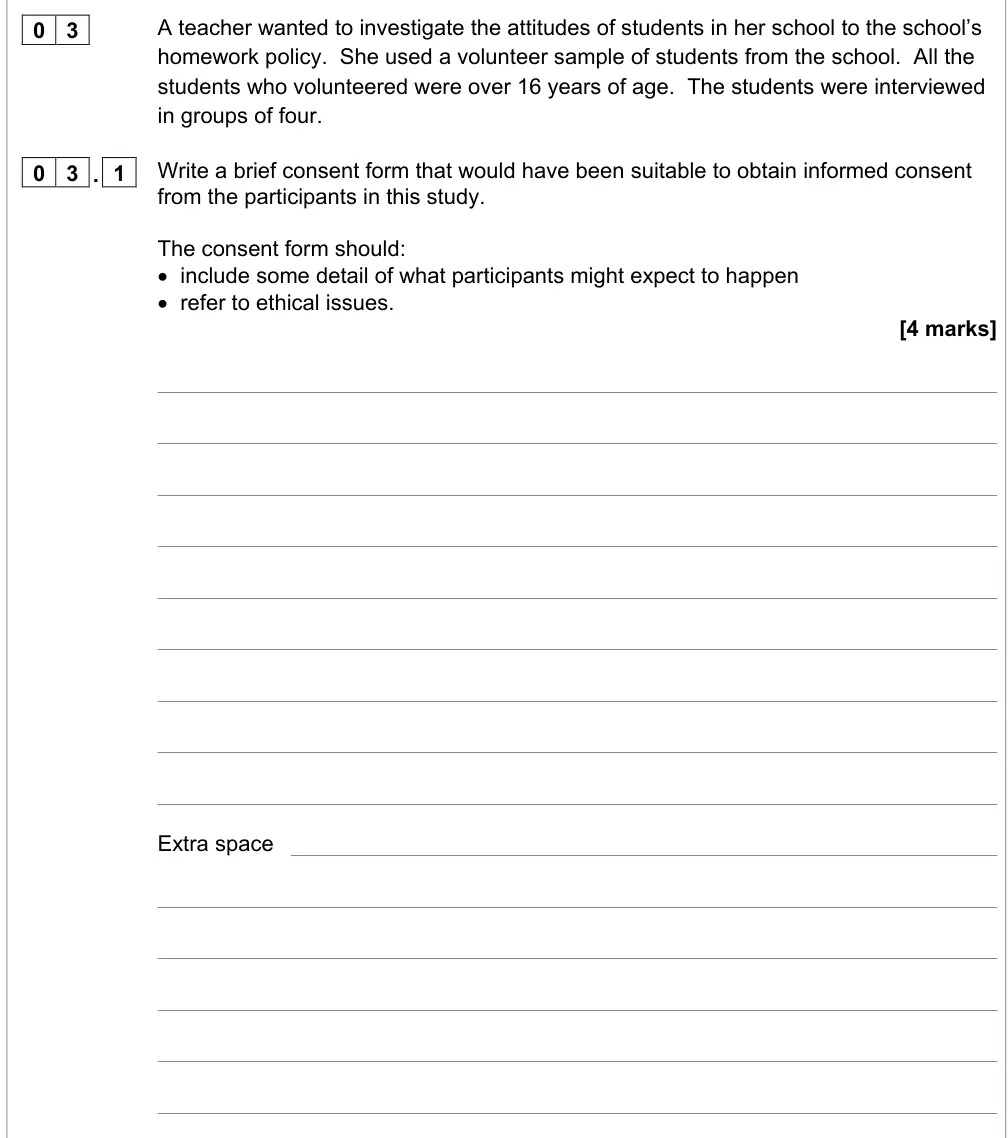
November 2020 · AS Paper 1 · Q3.1 4 marks AO2=4 Research methods scientific processes
0 3
A teacher wanted to investigate the attitudes of students in her school to the school’s
homework policy.  She used a volunteer sample of students from the school.  All the
students who volunteered were over 16 years of age.  The students were interviewed
in groups of four.
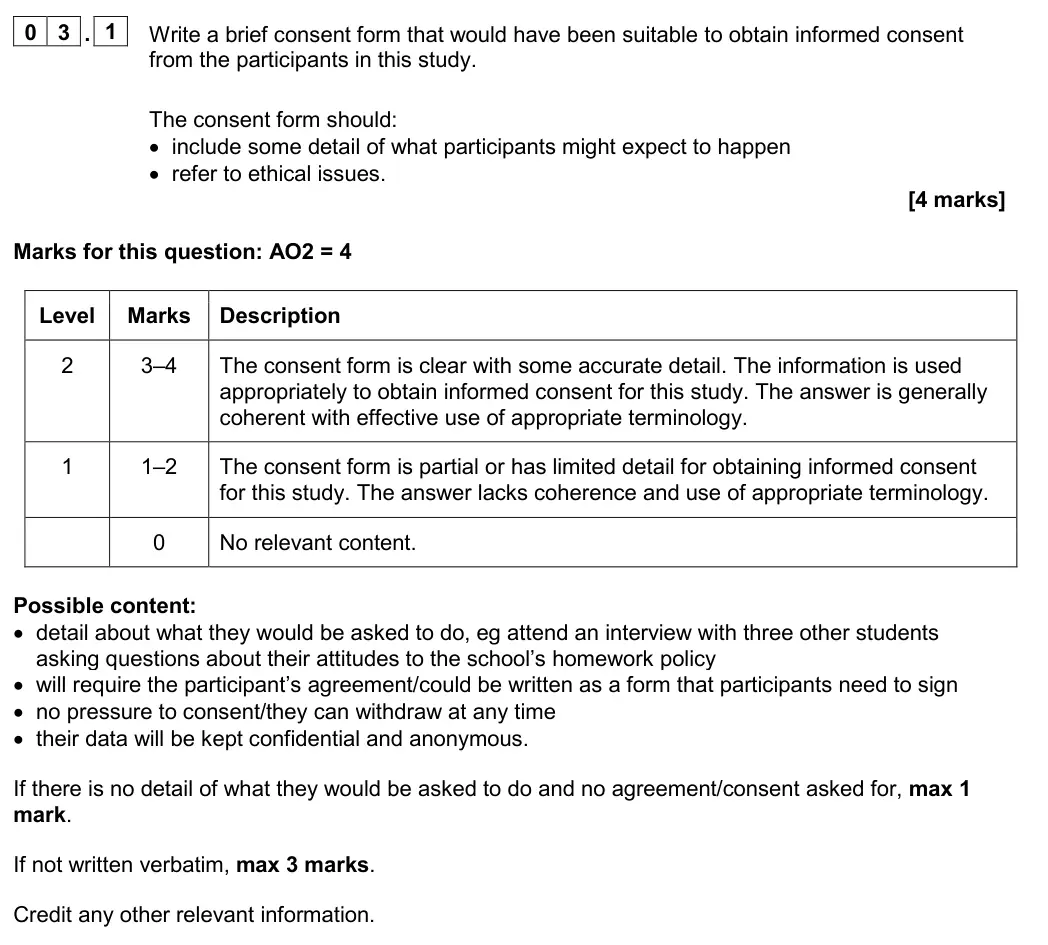
0 3 . 1
Write a brief consent form that would have been suitable to obtain informed consent
from the participants in this study.
The consent form should:
• include some detail of what participants might expect to happen
• refer to ethical issues.
[4 marks]
Extra space
November 2020 · AS Paper 1 · Q3.2 2 marks AO2=2 Research methods scientific processes
0 3 . 2
Explain how using stratified sampling might improve the design of this study.
[2 marks]
November 2020 · AS Paper 1 · Q5.1 2 marks AO2=1, AO3=1 Research methods memorydata handling
0 5
A researcher investigated coding in short-term memory using the same participants in
both conditions.
• In the first condition, he read out a list of 10 different sounding words.
• In the second condition, he read out a list of 10 similar sounding words.
The researcher recorded how many words participants recalled correctly in each
condition.
Table 1 below shows the results of his study.
Table 1 Mean number of words recalled and standard deviations
Different sounding words
Similar sounding words
Mean
7.1
4.6
Standard deviation
1.9
0.6
0 5 . 1
What do the mean values in Table 1 suggest about coding in short-term memory?
Justify your answer.
[2 marks]
November 2020 · AS Paper 1 · Q5.2 2 marks AO2=1, AO3=1 Research methods data handling
0 5 . 2
What do the standard deviation values in Table 1 suggest?  Justify your answer.
[2 marks]
November 2020 · AS Paper 1 · Q5.3 2 marks AO3=2 Research methods scientific processes
0 5 . 3
Explain how using counterbalancing might improve the design of the study.
[2 marks]
November 2020 · AS Paper 2 · Q4.3 2 marks AO3=2 Research methods scientific processes
0 4 . 3
The teacher concluded that smiley stickers may not have been the only thing that
caused the difference in average scores between Group A and Group B.  The
teacher was concerned because the children in each class were different.
Explain one way the teacher could change the experimental design to deal with this
issue.
[2 marks]
November 2020 · AS Paper 2 · Q8 2 marks AO3=2 Research methods research methods
0 8
Researchers discovered a strong positive correlation between the number of therapy
sessions attended by people with obsessive-compulsive disorder and their well-being
ratings.
Explain why it would not be appropriate to conclude that therapy increases well-being
ratings.
[2 marks]
November 2020 · AS Paper 2 · Q12 2 marks AO2=2 Research methods scientific processes
Researchers wanted to see if there was a difference in the number of students
choosing to use various work spaces in the college library.  Previous research findings
on this topic were inconsistent.
There were three types of work space available in the library:
• single desks with a chair
• large tables with chairs
• settees with low tables.
The researchers used CCTV camera recordings of the different work space areas
taken over three days.  From each day, they analysed two hours’ worth of recordings
from the morning and two hours’ worth of recordings from the afternoon.  They noted
down the number of students seen working at each of the three work spaces.
1 2
Should the hypothesis for this observation be directional or non-directional?
Explain your answer.
[2 marks]
November 2020 · AS Paper 2 · Q14 2 marks AO2=2 Research methods scientific processesresearch methods
1 4
Explain why watching students covertly should reduce demand characteristics in this
study.
[2 marks]
November 2020 · AS Paper 2 · Q15 4 marks AO2=2, AO3=2 Research methods data handling
The results of the library study are shown in Table 2.
Table 2 Total number of students working in each work space
Single desks
Large tables
Settees with
with a chair
with chairs
low tables
Morning
34
22
120
Afternoon
37
23
183
1 5
Summarise the findings of this study using the data in Table 2.
[4 marks]
Extra space
November 2020 · AS Paper 2 · Q16 2 marks AO3=2 Research methods scientific processesdata handling
Students who were in the library over the three-day period were asked to complete a
questionnaire about their work space use.
The questionnaire contained only closed questions.
1 6
Explain one way in which using open questions, in addition to closed questions, might
improve the questionnaire.
[2 marks]
November 2020 · AS Paper 2 · Q17 4 marks AO2=2, AO3=2 Research methods research methods
Question 4 on the questionnaire was ‘Which of the following work spaces do you use
most often in the library?’
The results for question 4 are shown in Table 3 below.
Table 3 Responses to question 4
Question 4 options
Total responses
working at a single desk with a chair
310
working at a large table with chairs
78
working on a settee with low tables
31
Table 3 includes only the responses of students whose data was analysed in the first
part of the study.
1 7
Compare the results given in Table 2 with those seen in Table 3.
What conclusion could now be made from these two sets of data?  Explain your
answer.
[4 marks]
November 2020 · AS Paper 2 · Q18 4 marks AO2=4 Research methods scientific processes
1 8
The researchers observed recordings of students in the library and obtained
questionnaire responses from students in their investigations into workspace use.
Briefly explain ethical issues that the researchers involved in these studies of student
behaviour should have considered.
[4 marks]
November 2020 · AS Paper 2 · Q19 4 marks AO1=2, AO3=2 Research methods scientific processes
In a final, follow-up study, the researchers wanted to know if there was a difference in
the type of work students engaged in at each of the three workspaces.  Again, they
conducted an observation study using CCTV recording.
Before the observation could begin the researchers needed to operationalise the
behavioural category ‘type of work’.
1 9
Explain what is meant by operationalisation and suggest two ways in which ‘type of
work’ could be operationalised.
[4 marks]
November 2020 · Paper 1 · Q3 3 marks AO2=3 Research methods scientific processes
0 3
Researchers have identified different features of science, including:
• replicability
• theory construction
• hypothesis testing.
Explain how Asch’s conformity research illustrates one of these features of science.
[3 marks]
November 2020 · Paper 1 · Q6 1 mark AO3=1 Research methods scientific processes
A researcher investigated retrieval failure using an independent groups design.
In Condition A, 10 participants learnt 30 words and recalled them in the same room.
In Condition B, another 10 participants learnt the same 30 words in one room and
recalled them in a different room.
The results for Condition B are shown below.
Table 1
Participant
1
2
3
4
5
6
7
8
9 10
Number of words recalled
9 11
8 28 14 13
9 15 10 12
The researcher decided to use the mean to analyse the results.
0 6
State one advantage of an independent groups design.
[1 mark]
November 2020 · Paper 1 · Q7 3 marks AO3=3 Research methods data handling
0 7
Suggest a more appropriate measure of central tendency for this data set and explain why
it would be more appropriate.
[3 marks]
November 2020 · Paper 1 · Q12 3 marks AO3=3 Research methods research methods
1 2
Studies of attachment often involve naturalistic observations.
Suggest one way in which studies of attachment could be improved by using controlled
observations.
[3 marks]
Extra space
November 2020 · Paper 2 · Q8 2 marks AO2=2 Research methods research methodsscientific processes
0 8
A survey of hospital patients has found that a new drug, Zapurpain, is as effective as other
pain medication.
Explain one limitation of asking hospital patients to self-report the effectiveness of
Zapurpain.
[2 marks]
November 2020 · Paper 2 · Q14 3 marks AO2=3 Research methods data handlingresearch methods
1 4
Identify the type of graph shown in Figure 2 and explain why this is an appropriate graph
to use for the data collected.
[3 marks]
November 2020 · Paper 2 · Q15 2 marks AO2=2 Research methods research methods
1 5
Explain why it would not be appropriate for the researchers to conclude that increased
recreational screen time reduces academic performance.
[2 marks]
November 2020 · Paper 2 · Q16 2 marks AO1=2 Research methods data handling
A psychologist reads a review of a meta-analysis confirming the relationship between
recreational screen time and academic performance.
1 6
What is meant by the term meta-analysis?
[2 marks]
November 2020 · Paper 2 · Q18 1 mark AO2=1 Research methods Medium scientific processes
1 8
Briefly explain why a directional hypothesis would be most suitable for this experiment.
[1 mark]
November 2020 · Paper 2 · Q19 3 marks AO2=3 Research methods scientific processes
1 9
Write an appropriate hypothesis for this experiment.
[3 marks]
November 2020 · Paper 2 · Q20 4 marks AO2=4 Research methods Medium data handling
The results obtained from the experiment are summarised in Table 2.
Table 2 Descriptive statistics for the test performance scores for
Group A and Group B
Group A
Group B
(no screen time)
(unrestricted screen time)
Mean
73.6
66.3
Median
74.0
58.0
Mode
74.0
44.0
Standard deviation
13.2
25.1
2 0
Using the data in Table 2, explain how the distribution of scores in Group A differs from
the distribution of scores in Group B.
[4 marks]
November 2020 · Paper 2 · Q21 4 marks AO2=2, AO3=2 Research methods data handling
2 1
What do the mean and standard deviation values in Table 2 suggest about the effect of
the recreational screen time on test performance?  Justify your answer.
[4 marks]
November 2020 · Paper 2 · Q22 7 marks AO2=7 Research methods inferential testingdata handling
2 2
The psychologist wanted to test the statistical significance of the data.
Identify the most appropriate choice of statistical test for analysing the data collected and
explain three reasons for your choice in the context of this study.
[7 marks]
November 2020 · Paper 2 · Q23 4 marks AO2=4 Research methods scientific processes
2 3
One criticism of the study is that the pupils were not matched on their typical recreational
screen time.
Explain how the psychologist could have matched pupils on their typical recreational
screen time across the experimental conditions.
[4 marks]
Extra space
November 2020 · Paper 2 · Q24 2 marks AO2=2 Research methods scientific processes
2 4
Identify one other variable for which the psychologist could have matched the pupils.
Explain how this might have affected the test performance if it was not controlled.
[2 marks]
November 2020 · Paper 3 · Q6 5 marks AO3=5 Research methods inferential testingdata handling
In a study of filter theory, a psychology student used a group of female participants.
Each participant was shown two descriptions.
• Description 1 described a man with a similar social background to that of the female
participants.
• Description 2 described a man with a different social background to that of the female
participants.
The student asked participants to judge how much they liked each description on a scale
of 1–10.
The student decided to test for a significant difference between the judgements made for
each description.  He proposed using an unrelated t-test to analyse the data.
0 6
Suggest a more appropriate statistical test of difference for the student to use with this
data.  Explain two reasons for your choice based on the description of the study.
[5 marks]
November 2020 · Paper 3 · Q7 2 marks AO3=2 Research methods scientific processes
0 7
The student who carried out the study selected the two descriptions.  He decided himself
which social backgrounds were similar and which social backgrounds were different.
Explain how the study could be improved by selecting the descriptions another way.
[2 marks]
November 2020 · Paper 3 · Q11 5 marks AO3=5 Research methods inferential testingdata handling
In a study of sex-role stereotypes and the understanding of gender, a psychology student
used a group of 7-year-old children.  Each child was shown two pictures.
• Picture 1 showed people carrying out sex-stereotypical activities.
• Picture 2 showed people carrying out non-sex-stereotypical activities.
The student asked the children to say how much they liked each picture on a scale
of 1–10.
The student decided to test for a significant difference between the judgements of the two
pictures.  He proposed using an unrelated t-test to analyse the data.
1 1
Suggest a more appropriate statistical test of difference for the student to use with this
data.  Explain two reasons for your choice based on the description of the study.
[5 marks]
November 2020 · Paper 3 · Q12 2 marks AO3=2 Research methods scientific processes
1 2
The student who carried out the study selected the two pictures.  He decided himself
which were sex-stereotypical activities and which were non-sex-stereotypical activities.
Explain how the study could be improved by selecting the pictures another way.
[2 marks]
November 2020 · Paper 3 · Q16 5 marks AO3=5 Research methods inferential testingdata handling
In a study of perspective-taking, a psychology student used a group of 9-year-old
children.  Each child was shown two pictures.
• Picture 1 showed an older child being unkind to a little boy.
• Picture 2 showed an older child being kind to a little boy.
The student asked the children to judge how sad the little boy would feel in each picture
on a scale of 1–10.
The student decided to test for a significant difference between the judgements of the two
pictures.  He proposed using an unrelated t-test to analyse the data.
1 6
Suggest a more appropriate statistical test of difference for the student to use with this
data.  Explain two reasons for your choice based on the description of the study.
[5 marks]
November 2020 · Paper 3 · Q17 2 marks AO3=2 Research methods scientific processes
1 7
The student who carried out the study selected the two pictures.  He decided himself
which picture showed unkind behaviours and which picture showed kind behaviours.
Explain how the study could be improved by selecting the pictures another way.
[2 marks]
June 2019 · AS Paper 1 · Q4.1 3 marks AO2=3 Research methods scientific processes
0 4
A researcher carried out a study based on Asch’s research to see if task difficulty
affects conformity.
Easy task condition: the standard line was very different from the incorrect
comparison lines.
Difficult task condition: the standard line was very similar to the incorrect comparison
lines.
Participants took part in only one condition and were not matched.  They were asked
to state which comparison line was the same as the standard line.  In both conditions,
four confederates (people working with the researcher) gave the same wrong answer.
The researcher recorded whether each participant did or did not conform.
0 4 . 1
Write a suitable directional hypothesis for this study.
[3 marks]
June 2019 · AS Paper 1 · Q4.2 3 marks AO2=3 Research methods scientific processes
0 4 . 2
Identify the experimental design used in this study.  Explain one advantage of using
this design in this study.
[3 marks]
Extra space
June 2019 · AS Paper 1 · Q5.2 4 marks AO3=4 Research methods scientific processes
0 5 . 2
Explain how the study might have been improved by using a random sample of
students from Year 12.
[4 marks]
Extra space
June 2019 · AS Paper 2 · Q8.1 2 marks AO1=2 Research methods scientific processes
A researcher treating obsessive compulsive disorder (OCD) compares two therapies.
Therapy A requires clients to attend a 20-week course and Therapy B requires a
matched sample of clients to attend a different 20-week course.  The clients are all
females who are 40 years old.
At the beginning and at the end of the 20-week courses, each client gives a
‘satisfaction with life’ rating out of a possible score of 30, where a high score indicates
high satisfaction.
0 8 . 1
What is a matched pairs design?
[2 marks]
Extra space
June 2019 · AS Paper 2 · Q8.2 1 mark AO3=1 Research methods scientific processes
0 8 . 2
How is using a matched pairs design an improvement on an independent groups
design?
[1 mark]
June 2019 · AS Paper 2 · Q9 1 mark AO2=1 Research methods scientific processes
0 9
Identify one other variable on which the clients must be matched in this study.
[1 mark]
June 2019 · AS Paper 2 · Q10 4 marks AO2=4 Research methods data handling
At the end of the 20-week therapy courses the median ratings for each group are as
follows:
Table 1 Median satisfaction with life ratings for Therapy A and Therapy B at the
beginning and the end of the 20-week courses
Median
Median
satisfaction
satisfaction
with life ratings
with life ratings
for Therapy A
for Therapy B
At the beginning of the
12.5
13
course
At the end of the course
17
22.5
1 0
What do the median values in Table 1 suggest?
Justify your answer.
[4 marks]
Extra space
June 2019 · AS Paper 2 · Q11 2 marks AO2=2 Research methods data handling
1 1
Explain why collecting qualitative data in this study might have been a more useful
way of assessing the effectiveness of the two therapies.
[2 marks]
June 2019 · AS Paper 2 · Q15 2 marks AO2=2 Research methods scientific processes
1 5
Identify the operationalised dependent variable in this study.
[2 marks]
June 2019 · AS Paper 2 · Q16 3 marks AO2=3 Research methods scientific processes
1 6
In order to produce the two word lists, a set of 50 words was identified.  These were
allocated to two word lists of equal length by a process of randomisation.
Explain how randomisation could be used to produce Word list A and Word list B.
[3 marks]
Extra space
June 2019 · AS Paper 2 · Q17 2 marks AO2=2 Research methods scientific processes
1 7
Explain the benefit of using randomisation to produce the word lists for this study.
[2 marks]
June 2019 · AS Paper 2 · Q18 2 marks AO3=2 Research methods Medium scientific processes
1 8
The 50 words used to make Word list A and Word list B were not standardised in
any way.
Explain how the words that were used to make the two lists should be matched in
order to improve the study.
[2 marks]
Extra space
June 2019 · AS Paper 2 · Q19 4 marks AO2=2, AO3=2 Research methods data handling
The results of the study are given in Table 2 below.
Table 2 Mean number of words recalled in the two conditions and the standard
deviation for both conditions
Condition 1
Condition 2
(same location)
(different locations)
Mean number of words
19.3
14.6
recalled
Standard deviation
2.43
2.41
1 9
What conclusions might be drawn from the data in Table 2?  Refer to the means and
standard deviations in your answer.
[4 marks]
Extra space
June 2019 · AS Paper 2 · Q20 3 marks AO2=3 Research methods data handling
2 0
Initially, the researcher had calculated the ranges for both conditions.  However, one
participant in Condition 1 had remembered all of the words when recalling Word list
A.
Given the information above, explain why it was more appropriate to use the standard
deviation rather than the range.
[3 marks]
Extra space
June 2019 · AS Paper 2 · Q21 3 marks AO2=3 Research methods data handling
2 1
Name an appropriate graph that could be used to display the means shown in
Table 2.
Suggest appropriate X and Y axis labels for your choice of graph.
[3 marks]
Name of graph:
X axis
Y axis:
Extra space
June 2019 · AS Paper 2 · Q22 3 marks AO3=3 Research methods scientific processes
2 2
The participants all gave their consent before taking part in the study.
Identify one other ethical issue that should have been addressed in this study.
Explain why it should have been addressed and how it could have been dealt with.
[3 marks]
Extra space
June 2019 · Paper 1 · Q3 4 marks AO2=4 Research methods inferential testingdata handlingscientific processes
0 3
Which statistical test should be used to calculate whether there is a significant difference in
reported smoking behaviour between the two surveys?  Give three reasons for your
answer.
[4 marks]
June 2019 · Paper 1 · Q15 4 marks AO3=4 Research methods research methods
A researcher wanted to investigate agoraphobia by studying Patient X.  The researcher
designed a questionnaire to find out about Patient X’s experiences.  However, a colleague
suggested that the researcher might do better to conduct a case study.
1 5
Explain one or more reasons why it might be better to conduct a case study than a
questionnaire.
[4 marks]
Extra space
June 2019 · Paper 2 · Q15 1 mark AO1=1 Research methods scientific processes
1 5
Give one reason why it is important for scientific reports to include a referencing section?
[1 mark]
June 2019 · Paper 2 · Q17 2 marks AO2=2 Research methods scientific processes
1 7
Would a directional or non-directional hypothesis be more suitable for the researcher to
use?  Explain your answer.
[2 marks]
Extra space
June 2019 · Paper 2 · Q18 3 marks AO2=3 Research methods scientific processes
1 8
Write a suitable hypothesis for this experiment.
[3 marks]
Extra space
June 2019 · Paper 2 · Q19 3 marks AO2=3 Research methods scientific processes
1 9
Identify the type of sampling method used in this experiment.  Explain one limitation of
using this sampling method in this study.
[3 marks]
Extra space
June 2019 · Paper 2 · Q20 4 marks AO2=4 Research methods scientific processes
2 0
Identify one variable on which participants should be matched in this matched-pairs
design.  Explain how the researcher could assign matched participants to either Group A
or Group B.
[4 marks]
Extra space
June 2019 · Paper 2 · Q21 2 marks AO3=2 Research methods scientific processes
2 1
Explain one strength of using a matched-pairs design rather than a repeated-measures
design.
[2 marks]
Extra space
June 2019 · Paper 2 · Q23 2 marks AO2=2 Research methods inferential testing
Table 3  Table of critical values of the sign test (S)
Level of significance for a two-tailed test
N
0.10
0.05
0.01
7
0
0
8
1
0
0
9
1
1
0
10
1
1
0
11
2
1
0
12
2
2
1
Significance is shown if the calculated value of S is equal to or less than the critical
value.
2 3
Explain whether or not there was a significant difference in the improvement in the scores
between the two groups.  Use your answer to Question 22 and Table 3.
[2 marks]
June 2019 · Paper 2 · Q24 2 marks AO1=2 Research methods Hard scientific processes
The validity of the data was questioned when the researcher presented his results.  The
researcher explained that he chose to use the happiness questionnaire because it had
high concurrent validity.
2 4
Explain what it means for a test to have high concurrent validity.
[2 marks]
Extra space
June 2019 · Paper 2 · Q25 4 marks AO2=4 Research methods scientific processes
2 5
The questionnaire had high concurrent validity.
Validity was still a concern because the researcher knew which participants were in each
experimental group.
Explain how this could have affected the validity of the study.
[4 marks]
Extra space
June 2019 · Paper 2 · Q26 4 marks AO2=2, AO3=2 Research methods scientific processes
2 6
Using your answer to Question 25, suggest one way in which the researcher could
modify the study to improve the internal validity of the study?  Justify your answer.
[4 marks]
Extra space
June 2019 · Paper 2 · Q27 4 marks AO2=2, AO3=2 Research methods inferential testingdata handling
A psychology teacher read the researcher’s study on sport and happiness.  She
considered whether setting group tasks could improve her students’ level of happiness.
She decided to conduct an independent groups experiment with 30 students taking
A-level Psychology using the same happiness questionnaire.
2 7
Suggest an appropriate statistical test the psychology teacher could use to analyse the
data.  Justify your choice of test.
[4 marks]
June 2019 · Paper 3 · Q12 2 marks AO2=2 Research methods inferential testing
In a study of communication, researchers used a language rating scale to compare two
groups of participants.  Participants in Group A were a volunteer sample of people from a
self-help group for people with schizophrenia.  Participants in Group B, the control group,
were a volunteer sample of people who attended a community centre.
The researchers used an inferential statistical test to see if there was a significant
difference in language rating between the two groups.
1 2
Explain why a Mann-Whitney test is an appropriate choice of statistical test in this
situation and a Spearman’s test is not.
[2 marks]
June 2019 · Paper 3 · Q13 4 marks AO2=2, AO3=2 Research methods scientific processes
1 3
Explain one reason why there might be a problem of bias and generalisation in this study.
How could the researchers modify their study to deal with this problem?
[4 marks]
June 2019 · Paper 3 · Q16 2 marks AO2=2 Research methods inferential testing
In a study of body image, researchers used a body image rating scale to compare two
groups of participants.  Participants in Group A were a volunteer sample of people who
attended a self-help group for people with eating disorders.  Participants in Group B, the
control group, were a volunteer sample of people who attended a community centre.
The researchers used an inferential statistical test to see if there was a significant
difference in body image rating between the two groups.
1 6
Explain why a Mann-Whitney test is an appropriate choice of statistical test in this
situation and a Spearman’s test is not.
[2 marks]
June 2019 · Paper 3 · Q17 4 marks AO2=2, AO3=2 Research methods scientific processes
1 7
Explain one reason why there might be a problem of bias and generalisation in this study.
How could the researchers modify their study to deal with this problem?
[4 marks]
June 2019 · Paper 3 · Q20 2 marks AO2=2 Research methods inferential testing
In a study of stress, researchers used a stress rating scale to compare two groups of
participants.  Participants in Group A were a volunteer sample of people who attended a
self-help group for people with stress.  Participants in Group B, the control group, were a
volunteer sample of people who attended a community centre.
The researchers used an inferential statistical test to see if there was a significant
difference in stress rating between the two groups.
2 0
Explain why a Mann-Whitney test is an appropriate choice of statistical test in this
situation and a Spearman’s test is not.
[2 marks]
June 2019 · Paper 3 · Q21 4 marks AO2=2, AO3=2 Research methods scientific processes
2 1
Explain one reason why there might be a problem of bias and generalisation in this study.
How could the researchers modify their study to deal with this problem?
[4 marks]
June 2019 · Paper 3 · Q23 4 marks AO3=4 Research methods scientific processes
A psychologist used a set of negative images to assess violent attitudes before and after
participants played a 30-minute computer game.  In a repeated measures design, 15
participants were tested before and after playing the game using a single set of images.
2 3
Explain how two sets of images could be used in this study and why this would be an
improvement.
[4 marks]
June 2019 · Paper 3 · Q27 4 marks AO3=4 Research methods scientific processes
A psychologist used a set of negative images to assess angry attitudes before and after
participants took part in a 30-minute anger management session.  In a repeated
measures design, 15 participants were tested before and after the session using a single
set of images.
2 7
Explain how two sets of images could be used in this study and why this would be an
improvement.
[4 marks]
June 2019 · Paper 3 · Q31 4 marks AO3=4 Research methods scientific processes
A psychologist used a set of negative images to assess attitudes to smoking before and
after participants took part in a 30-minute covert sensitisation session.  In a repeated
measures design, 15 participants were tested before and after the session using a single
set of images.
3 1
Explain how two sets of images could be used in this study and why this would be an
improvement.
[4 marks]
June 2018 · AS Paper 1 · Q3.1 2 marks AO2=2 Research methods research methods
0 3
A head teacher wanted to increase recycling in his school.  He arranged for the
canteen to have three bins, one for cardboard, one for plastic and one for food waste.
A month later, a psychology teacher decided to see if the students were recycling.
One lunch break she watched different students going to the bins.  Each time, she
wrote down which of the three types of waste they recycled.  She positioned herself
so that the students could not see her but so that she had a clear view of the bins.
0 3 . 1
Identify one type of observation being used in this investigation.
Justify your answer.
[2 marks]
June 2018 · AS Paper 1 · Q3.2 2 marks AO2=2 Research methods scientific processes
0 3 . 2
Explain the sampling technique the teacher used to record her observations.
[2 marks]
June 2018 · AS Paper 1 · Q3.3 4 marks AO3=4 Research methods data handling
As the different year groups had lunch at different times, the teacher was able to
present her results as three year groups, as shown in Table 1 below.
Table 1:  The number of items each year group recycled
Year group
Cardboard
Plastic
Food
7-9
20
35
10
10-11
18
25
7
12-13
12
15
5
0 3 . 3
What do the results in Table 1 suggest about the recycling initiative?
Refer to the data in Table 1 in your answer.
[4 marks]
Extra space
June 2018 · AS Paper 1 · Q3.4 2 marks AO3=2 Research methods scientific processes
0 3 . 4
Explain one way in which the design of this observation could have been improved.
[2 marks]
Extra space
June 2018 · AS Paper 1 · Q9.2 2 marks AO2=2 Research methods data handling
0 9 . 2
Identify one type of data the psychologist collected in this study.
Explain your answer.
[2 marks]
June 2018 · AS Paper 1 · Q9.3 2 marks AO3=2 Research methods scientific processes
0 9 . 3
Investigator effects may influence this study.  Explain how the investigation might be
modified to reduce these effects.
[2 marks]
June 2018 · AS Paper 1 · Q9.4 2 marks AO2=2 Research methods scientific processes
0 9 . 4
The psychologist submitted a report of her investigation to a journal for peer review.
What would she expect the process to involve?
[2 marks]
June 2018 · AS Paper 2 · Q5 3 marks AO3=3 Research methods research methods
0 5
Briefly discuss one way in which a covert observation of children might be more
beneficial than an overt observation.
[3 marks]
Extra space
June 2018 · AS Paper 2 · Q6 4 marks AO2=4 Research methods inferential testing
At the end of the observation study the researcher used a sign test to see if the
behaviour of the children was more helpful, less helpful or the same after seeing the
film than it was before they had seen the film.
0 6
Explain why the researcher decided the sign test would be an appropriate statistical
test to use on the data from this study.
[4 marks]
Extra space
June 2018 · AS Paper 2 · Q13 2 marks AO2=2 Research methods scientific processes
A researcher was interested in the relationship between the number of hours a course
was taught using a computer program and the satisfaction of the students on the
course.
As part of his research he conducted a pilot study as follows.  A topic from a business
studies course was divided into 10 equal one-hour sessions.
Eleven students who were matched for their high level of interest in business studies
took part in the study.
All 11 students completed all 10 hours of the topic.  They were taught either
completely online, with a combination of online teaching and classroom teaching, or
just in a classroom.
Each student was allocated a letter, from A to K randomly.  This determined the
number of hours they studied online and the number of hours they studied in a
classroom.  The combinations are shown in Table 1 below.
Table 1:  The numbers of hours each student (labelled A – K) studied the topic
online and in a classroom with a teacher
A
B
C
D
E
F
G
H
I
J
K
Number of online hours
10
9
8
7
6
5
4
3
2
1
0
Number of classroom hours
0
1
2
3
4
5
6
7
8
9
10
1 3
Explain why it was important to match the students on their high level of interest in
business studies.
[2 marks]
June 2018 · AS Paper 2 · Q14 2 marks AO2=2 Research methods scientific processes
1 4
Suggest one other variable for which the researcher should have matched the
students.  Explain how this might have affected the satisfaction scores if it was not
controlled.
[2 marks]
June 2018 · AS Paper 2 · Q15 2 marks AO2=2 Research methods scientific processes
1 5
Outline one benefit of allocating the students randomly to the different numbers of
online hours and classroom hours as seen in Table 1.
[2 marks]
Extra space
June 2018 · AS Paper 2 · Q16 3 marks AO3=3 Research methods scientific processes
1 6
The sample used in this pilot study was an opportunity sample.  Briefly explain how
using a stratified sample when the final study is conducted might be an improvement
to the design.
[3 marks]
Extra space
June 2018 · AS Paper 2 · Q17 1 mark AO2=1 Research methods data handlingscientific processes
1 7
The researcher designed a questionnaire to collect data from the students about how
satisfied they felt when they had completed the course.
Give an example of an appropriate question that the researcher might use to collect
qualitative data on the questionnaire.
[1 mark]
June 2018 · AS Paper 2 · Q18 2 marks AO2=2 Research methods data handling
1 8
Briefly explain one problem the researcher might have in analysing the qualitative data
collected from the questionnaires.
[2 marks]
June 2018 · AS Paper 2 · Q19 1 mark AO2=1 Research methods scientific processes
1 9
Outline one ethical issue that should have been taken into account when carrying out the
questionnaire.
[1 mark]
June 2018 · AS Paper 2 · Q20 4 marks AO2=4 Research methods data handlingresearch methods
In order to analyse all the responses to the questionnaire, each response was given a
score by the researcher.  The maximum score on the questionnaire was 20, where a
score of 0 meant dissatisfied and a score of 20 meant very satisfied.
The following data was collected by the researcher.
Table 2: The numbers of hours each student (labelled A – K) studied the topic
online and the satisfaction scores of each student.
A
B
C
D
E
F
G
H
I
J
K
Number of online hours
10
9
8
7
6
5
4
3
2
1
0
Satisfaction scores
5
6
8
7
10 12
13
15
17
19
19
2 0
Using the data in Table 2 and the graph paper provided below, draw an appropriate
scattergram.  Fully label your display.
[4 marks]
June 2018 · AS Paper 2 · Q21 2 marks AO2=2 Research methods research methodsdata handling
2 1
What conclusion might the researcher draw, based on the results of the study?
[2 marks]
June 2018 · AS Paper 2 · Q23 2 marks AO2=2 Research methods data handling
2 3
Explain why the median would be more suitable than the mode to represent the
average score for satisfaction for the students.
[2 marks]
June 2018 · Paper 1 · Q5 4 marks AO3=4 Research methods scientific processesresearch methods
0 5
Briefly explain two ways in which the working memory experiment described above could
be improved.
[4 marks]
Extra space
June 2018 · Paper 1 · Q14 4 marks AO2=4 Research methods data handlingresearch methods
1 4
Draw a suitable graphical display to represent the data in Table 1.  Label your graph
appropriately.
[4 marks]
Title:
June 2018 · Paper 1 · Q15 2 marks AO2=2 Research methods inferential testingdata handling
The researcher analysed the data in Table 1 using a Spearman’s rho statistical test.
1 5
With reference to level of measurement, explain why Spearman’s rho is an appropriate
statistical test for this data.
[2 marks]
June 2018 · Paper 2 · Q11 2 marks AO2=2 Research methods Medium data handling
1 1
Explain one reason why the mean is the most appropriate measure of central tendency for
this set of data.
[2 marks]
June 2018 · Paper 2 · Q13 3 marks AO1=1, AO2=2 Research methods Medium scientific processes
The psychologist was interested in finding out whether dream themes differed between
males and females, particularly in terms of social interaction.  She decided to conduct a
pilot study.  Twenty undergraduate students (8 male and 12 female) volunteered for the
study.  For a six-week period the students were interviewed at 9 am each morning when
they arrived at university.  Interviewers, who did not know the purpose of the study, carried
out and recorded the dream interviews.
1 3
What is meant by a pilot study?  Explain one possible reason why the psychologist
decided to conduct a pilot study for this investigation.
[3 marks]
Extra space
June 2018 · Paper 2 · Q14 2 marks AO1=1, AO2=1 Research methods data handling
1 4
The interviews produced qualitative data.
What is meant by qualitative data?  Give one strength of collecting qualitative data in this
study.
[2 marks]
Extra space
June 2018 · Paper 2 · Q15 3 marks AO1=1, AO3=2 Research methods Hard scientific processes
1 5
What are investigator effects?  Suggest one way in which they could have been minimised
during the dream interviews.
[3 marks]
Extra space
June 2018 · Paper 2 · Q16 4 marks AO2=4 Research methods Medium research methodsdata handling
1 6
Another researcher, who did not know the purpose of the study, carried out a content
analysis of the interview data.
Explain how this content analysis could have been conducted.
[4 marks]
Extra space
June 2018 · Paper 2 · Q17 4 marks AO3=4 Research methods scientific processes
1 7
The psychologist wanted to assess the reliability of the content analysis.
Explain how the reliability of the content analysis could be assessed.
[4 marks]
Extra space
June 2018 · Paper 2 · Q19 4 marks AO2=4 Research methods Easy data handling
1 9
Draw a suitable graphical display to represent the data in Table 2.  Label your graph
appropriately.
[4 marks]
Title
June 2018 · Paper 2 · Q20 6 marks AO2=6 Research methods scientific processes
The psychologist decided to conduct an experiment to investigate the effect of watching
horror films before going to bed.
A volunteer sample of 50 university students consented to take part in the experiment.
The 50 students were randomly split into two groups.  Group 1 watched a horror film
before going to bed each night for the first week then a romantic comedy before going to
bed each night for the second week.  Group 2 watched the romantic comedy in the first
week and the horror film in the second week.
When the students woke up each morning, each student received a text message that
asked if they had had a nightmare during the night.  They could respond ‘yes’ or ‘no’.
2 0
Write a brief consent form that would have been suitable for use in this experiment.
The consent form should:
•
include some detail of what participants might expect to happen
•
refer to ethical issues
•
be in an appropriate format/style.
[6 marks]
Extra space
June 2018 · Paper 2 · Q21 3 marks AO2=3 Research methods scientific processes
2 1
The psychologist proposed a directional hypothesis.
Write a directional hypothesis for this experiment.
[3 marks]
June 2018 · Paper 2 · Q22 2 marks AO2=2 Research methods scientific processes
2 2
The psychologist used a repeated measures design in this experiment.
Explain why it was important to use a repeated measures design in this case.
[2 marks]
June 2018 · Paper 2 · Q23 2 marks AO1=1, AO2=1 Research methods Hard scientific processes
2 3
The psychologist used counterbalancing in this experiment.
Explain why it was appropriate to use counterbalancing in this experiment.
[2 marks]
June 2018 · Paper 2 · Q24 3 marks AO2=3 Research methods Easy scientific processes
2 4
Explain how the psychologist could have randomly split the sample of 50 students into the
two groups.
[3 marks]
June 2018 · Paper 2 · Q25 4 marks AO2=2, AO3=2 Research methods data handling
The psychologist collated the responses of all the participants over the two-week period
and calculated the mean and standard deviation for each condition.
Table 3   Mean number of nightmares reported and the standard deviation for each
condition
Mean number of nightmares in
Standard deviation
7 days
Horror films
2.18
1.48
Romantic comedies
0.30
0.61
2 5
What do the mean and standard deviation values in Table 3 suggest about the effect of
the type of film watched on the occurrence of nightmares?  Justify your answer.
[4 marks]
Extra space
June 2018 · Paper 2 · Q26 2 marks AO2=2 Research methods inferential testing
2 6
The psychologist found that the difference in the number of nightmares reported in the two
conditions was significant at p<0.05.
Explain what is meant by ‘significant at p<0.05’ in the context of this experiment.
[2 marks]
Extra space
June 2018 · Paper 2 · Q27 3 marks AO2=1, AO3=2 Research methods scientific processes
2 7
The psychologist was concerned about the validity of the experiment.
Suggest one possible modification to the design of the experiment and explain how this
might improve validity.
[3 marks]
Extra space
June 2018 · Paper 3 · Q4 4 marks AO3=4 Research methods research methods
0 4
Outline two non-biological ways of measuring excitement that the student could also use
in this situation.
[4 marks]
June 2018 · Paper 3 · Q9 4 marks AO2=4 Research methods scientific processes
Researchers wished to study the link between attachment and parasocial relationships.
They surveyed a stratified sample of 100 18-year-old students from four different schools.
Some schools had a large number of students and others had a smaller number of
students.  The students were asked questions about their childhood, their feelings
towards celebrities and about their friendships at school.
0 9
Explain how the researchers could have obtained a stratified sample from the four
different schools.
[4 marks]
June 2018 · Paper 3 · Q10 4 marks AO3=4 Research methods scientific processes
At the end of the survey, researchers wished to treat the students ethically.  They used
the following statement in their debriefing:
‘Thank you for taking part in the survey.  Your data will be very useful.  Have you any
questions?’
1 0
Suggest two additional points that could be added to the debriefing statement to better
ensure ethical treatment of the students.
[4 marks]
June 2018 · Paper 3 · Q14 4 marks AO2=4 Research methods scientific processes
Researchers wished to study the link between androgyny and psychological health.  They
surveyed a stratified sample of 100 18-year-old students from four different schools.
Some schools had a large number of students and others had a smaller number of
students.  The students were asked to rate themselves on an androgyny scale and then
answered a series of questions.  The questions focused on students’ self-esteem and
how they felt about their relationships with others.
1 4
Explain how the researchers could have obtained a stratified sample from the four
different schools.
[4 marks]
June 2018 · Paper 3 · Q15 4 marks AO3=4 Research methods scientific processes
At the end of the survey, the researchers wished to treat the students ethically.  They
used the following statement in their debriefing:
‘Thank you for taking part in the survey.  Your data will be very useful.  Have you any
questions?’
1 5
Suggest two additional points that could be added to the debriefing statement to better
ensure ethical treatment of the students.
[4 marks]
June 2018 · Paper 3 · Q19 4 marks AO2=4 Research methods scientific processes
Researchers wished to study the effects of scaffolding on learning.  They surveyed a
stratified sample of 100 18-year-old students from four different schools.  Some schools
had a large number of students and others had a smaller number of students.  The
students were asked questions about how they learn, different teaching and classroom
activities, and what helps them learn.
1 9
Explain how the researchers could have obtained a stratified sample from the four
different schools.
[4 marks]
June 2018 · Paper 3 · Q20 4 marks AO3=4 Research methods scientific processes
At the end of the survey, the researchers wished to treat the students ethically.  They
used the following statement in their debriefing:
‘Thank you for taking part in the survey.  Your data will be very useful.  Have you any
questions?’
2 0
Suggest two additional points that could be added to the debriefing statement to better
ensure ethical treatment of the students.
[4 marks]
June 2018 · Paper 3 · Q24 4 marks AO2=4 Research methods data handling
A psychologist investigated cognitive processing in two groups of people with
schizophrenia.  People in Group A showed positive symptoms of schizophrenia and
people in Group B showed negative symptoms of schizophrenia.  Each person
completed a cognitive task and was given an overall score.  The psychologist then
calculated average scores for each group.  The results are shown in Table 2 below.
Table 2
Measure of central
Group A scores
Group B scores
tendency
Mean
22.4
26
Median
22.5
22.5
Mode
22
16
2 4
Using the data in Table 2, explain how the distribution of scores in Group A differs from
the distribution of scores in Group B.
[4 marks]
June 2018 · Paper 3 · Q28 4 marks AO2=4 Research methods data handling
A psychologist investigated perception of foods in two groups of people.  People in
Group A were on a calorie-counting diet and people in Group B were on a low-fat diet.
Each person completed a perception task and was given an overall score.  The
psychologist then calculated average scores for each group.  The results are shown in
Table 3 below.
Table 3
Measure of central
Group A scores
Group B scores
tendency
Mean
22.4
26
Median
22.5
22.5
Mode
22
16
2 8
Using the data in Table 3, explain how the distribution of scores in Group A differs from
the distribution of scores in Group B.
[4 marks]
June 2018 · Paper 3 · Q32 4 marks AO2=4 Research methods data handling
A psychologist investigated workplace stress in two groups of people.  People in
Group A were employed by a company and people in Group B were self-employed.
Each person completed a stress test and was given an overall score.  The psychologist
then calculated average scores for each group. The results are shown in Table 4 below.
Table 4
Measure of central
Group A scores
Group B scores
tendency
Mean
22.4
26
Median
22.5
22.5
Mode
22
16
3 2
Using the data in Table 4, explain how the distribution of scores in Group A differs from
the distribution of scores in Group B.
[4 marks]
June 2017 · AS Paper 1 · Q8 4 marks AO3=4 Research methods scientific processesresearch methods
0 8
Memory studies are sometimes criticised for being unrealistic. Briefly explain two
ways that this criticism could be addressed in memory research.
[4 marks]
Extra space
June 2017 · AS Paper 1 · Q10 2 marks AO2=2 Research methods Easy scientific processes
1 0
A psychologist decided to interview both Zina and Amanda five months later to see if
they could still remember the same level of detail about the incident.
Explain one ethical issue the psychologist must consider before interviewing Zina
and Amanda.
[2 marks]
Extra space
June 2017 · AS Paper 1 · Q15 4 marks AO2=4 Research methods data handling
1 5
The researcher collected quantitative data using the ‘Strange Situation’.  He then
decided to collect qualitative data by conducting interviews with some of the parents
of the infants.
Describe two differences between these types of data.
[4 marks]
Extra space
June 2017 · AS Paper 2 · Q12 2 marks AO2=2 Research methods scientific processes
1 2
Explain how findings of psychological research into the treatment of depression
could have implications for the economy.
[2 marks]
Extra space
June 2017 · AS Paper 2 · Q14 2 marks AO2=2 Research methods scientific processes
Students often claim that listening to music helps them to concentrate.  A
psychologist was not aware of any previous research in this area.  She decided to
investigate this claim.
Forty students from a nearby sixth form centre volunteered to take part in her
study.  They each answered the following question:
‘Do you think that you concentrate on your work ‘better’, ‘worse’ or ‘the same’  if
you listen to music while working?’
She obtained the results in Table 1.
Table 1: Responses to question - ‘Do you think that you concentrate on your
work ‘better’, ‘worse’ or ‘the same’  if you listen to music while working?’
Better
Worse
The same
22
8
10
1 4
Should the hypothesis for this study be directional?  Explain your answer.
[2 marks]
Extra space
June 2017 · AS Paper 2 · Q16 2 marks AO3=2 Research methods scientific processes
1 6
Explain why using stratified sampling might improve this study.
[2 marks]
Extra space
June 2017 · AS Paper 2 · Q17 2 marks AO1=2 Research methods data handling
1 7
The data collected in this study is primary data.
Explain what is meant by ‘primary data’.
[2 marks]
Extra space
June 2017 · AS Paper 2 · Q18 2 marks AO2=2 Research methods data handling
In a follow-up study, the psychologist obtained a volunteer sample of 10 students
aged 17 years from a different sixth form centre. Using a repeated measures
design, participants were asked to complete two puzzle tasks as quickly as
possible.
Task A was to find 10 differences in a ‘spot the difference’ puzzle while working in
silence.
Task B was to find 10 differences in another ‘spot the difference’ puzzle while
listening to music through headphones.
The tasks were counterbalanced and the time taken to complete each task was
recorded for each student.
Table 2: Times taken (in seconds) to complete Task A (silence) and Task B
(music)
Participant Task A (silence)
Task B (music)
1
67
82
2
45
70
3
58
60
4
43
59
5
72
77
6
90
105
7
101
90
8
37
59
9
54
83
10
63
89
1 8
Explain one reason why the mean would be the most appropriate measure of
central tendency to summarise the data in Table 2.
[2 marks]
June 2017 · AS Paper 2 · Q20 3 marks AO3=3 Research methods scientific processes
2 0
The psychologist used counterbalancing in the follow-up study.
Discuss the purpose of counterbalancing.
[3 marks]
Extra space
June 2017 · AS Paper 2 · Q21 3 marks AO2=3 Research methods Medium scientific processes
2 1
Identify one possible extraneous variable that the psychologist should have
controlled in this follow-up study. Explain how this variable might have affected the
results of the study if it was not controlled.
[3 marks]
Extra space
June 2017 · AS Paper 2 · Q22 4 marks AO3=4 Research methods research methods
2 2
Explain how the follow-up study could be said to be an improvement on the
original study.
[4 marks]
Extra space
June 2017 · Paper 1 · Q1 2 marks AO2=2 Research methods data handling
In an experiment, researchers arranged for participants to complete a very personal and
embarrassing questionnaire in a room with other people.  Each participant was tested
individually.  The other people were confederates of the experimenter.
In condition 1: the confederates completed the questionnaire.
In condition 2: the confederates refused to complete the questionnaire and asked to leave
the experiment.
The researchers tested 15 participants in condition 1, and 15 different participants in
condition 2.
The researchers recorded the number of participants who completed the questionnaire in
each condition.
0 1
Identify the type of data in this experiment.  Explain your answer.
[2 marks]
June 2017 · Paper 1 · Q3 4 marks AO3=4 Research methods scientific processes
For this study, the researchers had to use different participants in each condition and this
could have affected the results.
0 3
Outline one way in which the researchers could have addressed this issue.
[4 marks]
Extra space
June 2017 · Paper 1 · Q4 2 marks AO2=2 Research methods inferential testing
In order to analyse the difference in the number of participants who completed the
questionnaire in each condition, the researchers used a chi-squared test.
0 4
Apart from reference to the level of measurement, give two reasons why the researchers
used the chi-squared test.
[2 marks]
Extra space
June 2017 · Paper 1 · Q5 2 marks AO2=2 Research methods inferential testing
The calculated value of chi-squared in the experiment described on page 2 is 3.97
Table 1:  Critical values for the chi-squared test
Level of significance
df
0.1
0.05
0.02
0.01
1
2.71
3.84
5.41
6.64
The calculated value of chi-squared should be equal to or greater than the critical value to
be statistically significant.
0 5
With reference to the critical values in Table 1, explain whether or not the calculated
value of chi-squared is significant at the 5% level.
[2 marks]
June 2017 · Paper 2 · Q7 2 marks AO2=2 Research methods data handling
A researcher wants to investigate the effectiveness of physiotherapy in the
recovery of stroke patients with brain damage.  Carers of stroke patients will be
sent questionnaires to produce quantitative data.
0 7
Explain one disadvantage of obtaining quantitative data in this study.
[2 marks]
June 2017 · Paper 2 · Q8 2 marks AO2=2 Research methods scientific processesdata handling
0 8
Write one question that could be used in the researcher’s questionnaire to
produce quantitative data and one question that could be used in the
researcher’s questionnaire to produce qualitative data.
[2 marks]
Quantitative question:
Qualitative question:
June 2017 · Paper 2 · Q11 2 marks AO2=2 Research methods scientific processes
1 1
Identify the operationalised dependent variable in this study.
[2 marks]
June 2017 · Paper 2 · Q12 2 marks AO2=2 Research methods Hard data handling
The results of the study are given in Table 1 below.
Table 1 Mean number of seconds taken to complete the 400m run and the
standard deviation for both conditions
Condition A
Condition B
(without music)
(with music)
Mean 400m time (s)
123
117
Standard deviation
9.97
14.5
1 2
Explain why a histogram would not be an appropriate way of displaying the
means shown in Table 1.
[2 marks]
Extra space
June 2017 · Paper 2 · Q13 3 marks AO3=3 Research methods data handling
1 3
Name a more appropriate graph to display the means shown in Table 1.
Suggest appropriate X (horizontal) and Y (vertical) axis labels for your graph
choice.
[3 marks]
Name of graph:
X axis label:
Y axis label:
June 2017 · Paper 2 · Q14 4 marks AO2=2, AO3=2 Research methods data handling
1 4
What do the mean and standard deviation values in Table 1 suggest about the
participants’ performances with and without music?  Justify your answer.
[4 marks]
Extra space
June 2017 · Paper 2 · Q16 5 marks AO2=5 Research methods Easy inferential testingdata handlingscientific processes
1 6
The researcher used a directional hypothesis and analysed the data using a
related t-test.  The calculated value of t where degrees of freedom (df) = 9 was
1.4377.  He decided to use the 5% level of significance.
Table 2 Table of critical values of t
Level of significance for
0.05
0.025
a one-tailed test
Level of significance for
0.10
0.05
a two-tailed test
df =                             1
6.314
12.706
2
2.920
4.303
3
2.353
3.182
4
2.132
2.776
5
2.015
2.571
6
1.943
2.447
7
1.895
2.365
8
1.860
2.306
9
1.833
2.262
10
1.812
2.228
Calculated value of t must be equal to or greater than the critical value in this table for
significance to be shown.
Give three reasons why the researcher used a related t-test in this study and,
using Table 2, explain whether or not the results are significant.
[5 marks]
June 2017 · Paper 2 · Q17 3 marks AO1=3 Research methods inferential testing
1 7
What is meant by a Type II error?  Explain why psychologists normally use the
5% level of significance in their research.
[3 marks]
Extra space
June 2017 · Paper 2 · Q18 3 marks AO2=2, AO3=1 Research methods Medium scientific processes
1 8
Identify one extraneous variable that could have affected the results of this
study.  Suggest why it would have been important to control this extraneous
variable and how it could have been controlled in this study.
[3 marks]
Extra space
June 2017 · Paper 2 · Q19 6 marks AO1=6 Research methods scientific processes
1 9
The report was submitted for peer review and a number of recommendations
were advised.
Describe the process and purposes of peer review.
[6 marks]
Extra space
June 2017 · Paper 2 · Q20 3 marks AO2=3 Research methods Easy research methodsscientific processes
People’s perception of how they spend their time at the gym is often not very
accurate.  Some spend more time chatting than on the treadmill.  A psychologist
decides to observe the actual behaviour of an opportunity sample of gym users
at a local gym.
2 0
Explain why it is more appropriate for the psychologist to use an observation
than a questionnaire in this case.
[3 marks]
Extra space
June 2017 · Paper 3 · Q5 3 marks AO3=3 Research methods scientific processesresearch methods
0 5
Explain one problem with the method used to determine the number of miles
walked in the week.  Suggest an alternative measure that would overcome this
problem.
[3 marks]
June 2017 · Paper 3 · Q8 2 marks AO3=2 Research methods scientific processes
0 8
In 1992, a book about human relationships was published in London.  The book
was written by Steve Duck from the University of Iowa.  The title was ‘Human
Relationships’.  The book was published by Sage.
A researcher needs to modify the above information to include Duck’s book in the
references section of a scientific report.
Write the full reference for this book as it should appear in the reference section
of the researcher’s report.
[2 marks]
June 2017 · Paper 3 · Q12 2 marks AO3=2 Research methods scientific processes
1 2
In 1993, a book about gender was published in New Haven. The book was written
by Sandra L Bem from Cornell University. The title was ‘The lenses of gender:
transforming the debate on sexual inequality’. The book was published by Yale
University Press.
A researcher needs to modify the above information to include Bem’s book in the
references section of a scientific report.
Write the full reference for this book as it should appear in the reference section of
the researcher’s report.
[2 marks]
June 2017 · Paper 3 · Q16 2 marks AO3=2 Research methods scientific processes
1 6
In 1980, a book about social cognition was published in New York.  The book was
written by Robert L. Selman from Harvard University.  The title was ‘The growth of
interpersonal understanding: developmental and clinical analyses’.  The book was
published by Academic Press.
A researcher needs to modify the above information to include Selman’s book in the
references section of a scientific report.
Write the full reference for this book as it should appear in the reference section of
the researcher’s report.
[2 marks]
June 2017 · Paper 3 · Q35 4 marks AO2=4 Research methods data handling
A psychologist is investigating causes of aggressive behaviour.  She interviews
teenagers who have been in trouble at school.  She asks them to describe their
family and early childhood, recording everything that they say.  She also looks at
information in the teenagers’ school reports.
3 5
Referring to this investigation, explain the difference between primary and
secondary data.
[4 marks]
June 2017 · Paper 3 · Q39 4 marks AO2=4 Research methods data handling
A psychologist is investigating causes of offending.  She interviews offenders who
are in prison for violent crime.  She asks them to describe their family and early
childhood, recording everything that they say.  She also looks at information in the
offenders’ court and prison reports.
3 9
Referring to this investigation, explain the difference between primary and
secondary data.
[4 marks]
June 2017 · Paper 3 · Q43 4 marks AO2=4 Research methods data handling
A psychologist is investigating causes of addiction to gambling.  She interviews
people attending debt counselling for problem gamblers.  She asks them to
describe their family and early childhood, recording everything that they say.  She
also looks at information in the gamblers’ debt counsellor reports.
4 3
Referring to this investigation, explain the difference between primary and
secondary data.
[4 marks]
June 2016 · AS Paper 1 · Q2.3 4 marks AO3=4 Research methods data handling
0 2 . 3
The mode is one type of descriptive statistic.
Identify two other descriptive statistics that could be used to further analyse the
data in Table 1. In each case, explain how the descriptive statistics you have
identified could be calculated.
[4 marks]
June 2016 · AS Paper 1 · Q3 3 marks AO1=3 Research methods research methods
0 3
The study in question 02 involves self-report.
Outline what is involved in self-report.
[3 marks]
June 2016 · AS Paper 2 · Q11.1 2 marks AO2=2 Research methods scientific processes
1 1
A researcher wanted to compare the effectiveness of two therapies for young
offenders who had been identified as having anger management issues.
Offenders, who were all sentenced to two years in a Young Offenders’ Institution,
were asked to volunteer to take part in an anger management programme. Fifty
volunteers were randomly allocated to Group 1 (Therapy A) or
Group 2 (Therapy B).
Each participant’s anger was assessed before and after therapy. For the
pre-therapy anger score they completed an Anger Scale questionnaire and their
responses were scored. A high score indicated extreme anger and a low score
indicated mild anger.
For the next eight weeks, participants attended weekly sessions for either
Therapy A or Therapy B.
For the post-therapy anger score, at the end of the treatment period,
participants completed the same Anger Scale questionnaire.
The data obtained are shown in Figure 1 below.
Figure 1   Median anger scores before and after therapy for
Group 1 (Therapy A) and Group 2 (Therapy B)
1 1 . 1
The researcher used volunteers for this study. Outline one disadvantage of
using volunteers to take part in this study.
[2 marks]
June 2016 · AS Paper 2 · Q11.2 3 marks AO2=3 Research methods scientific processes
1 1 . 2
Explain how the researcher could allocate the volunteers randomly to the
conditions of the experiment.
[3 marks]
June 2016 · AS Paper 2 · Q11.3 3 marks AO2=3 Research methods scientific processes
1 1 . 3
Write a suitable hypothesis for this study.
[3 marks]
June 2016 · AS Paper 2 · Q11.4 3 marks AO3=3 Research methods data handling
1 1 . 4
What do the data in Figure 1 seem to suggest?
[3 marks]
June 2016 · AS Paper 2 · Q11.5 4 marks AO3=4 Research methods scientific processes
1 1 . 5
Explain how the study might be improved by using a matched pairs design.
[4 marks]
June 2016 · AS Paper 2 · Q11.6 4 marks AO2=2, AO3=2 Research methods scientific processes
1 1 . 6
Outline one ethical issue that might have occurred in this study and explain how
the researcher could have dealt with this issue.
[4 marks]
June 2016 · AS Paper 2 · Q11.7 1 mark AO2=1 Research methods data handling
1 1 . 7
Give one disadvantage of using median values as seen in Figure 1 to represent
the anger scores of participants.
[1 mark]
June 2016 · AS Paper 2 · Q11.8 2 marks AO2=2 Research methods scientific processes
1 1 . 8
Explain how demand characteristics might have occurred in this study.
[2 marks]
June 2016 · AS Paper 2 · Q11.9 2 marks AO3=2 Research methods research methods
1 1 . 9
The researcher used a questionnaire to assess the anger scores of the
offenders. Briefly discuss one strength of using questionnaires in research.
[2 marks]
24
Specimen set 2 · Paper 1 · Q12 4 marks AO2=4 Research methods inferential testingscientific processesdata handling
A researcher wanted to see whether cognitive behaviour therapy was an effective
treatment for depression. Twenty depressed patients who had all recently completed a
course of cognitive behaviour therapy were involved in the investigation. From their
employment records, the researcher kept a record of the number of absences from
work each patient had in the year following their treatment. This was compared with
the number of absences from work each patient had in the year prior to their
treatment.
Those patients who had fewer absences from work in the year following their
treatment than in the year prior to their treatment were classified as ‘improved’ (+).
Those patients who had more absences were classified as ‘deteriorated’ (-). Those
patients who had the same number of absences were classified as ‘neither’ (0).
The results of the investigation are included in Table 1 below.
Table 1
Patient
Improved
Deteriorated
Neither
1
+
2
0
3
-
4
+
5
+
6
+
7
-
8
-
9
0
10
+
11
-
12
+
13
+
14
+
15
+
16
-
17
+
18
+
19
+
20
0
The researcher decided to use the sign test to analyse the data.
1 2
Explain two factors that the researcher had to take into account when deciding to use
the sign test. Refer to the investigation on the previous page in your answer.
[4 marks]
Specimen set 2 · Paper 1 · Q14 2 marks AO2=2 Research methods inferential testing
Table 2:  Critical values for the sign test
n
0.005 (one
0.01 (one
0.025 (one
0.05 (one
tailed)
tailed)
tailed)
tailed)
0.01 (two
0.02 (two
0.05 (two
0.10 (two
tailed)
tailed)
tailed)
tailed)
16
2
2
3
4
17
2
3
4
4
18
3
3
4
5
For significance, the value of the less frequent sign is equal to or less than the value of the table.
1 4
With reference to the critical values in Table 2, explain whether or not the value of s
that you calculated in response to question 13 is significant at the 0.05 level for a
two tailed test.
[2 marks]
Specimen set 2 · Paper 1 · Q15 3 marks AO3=3 Research methods data handling
1 5
The investigation above is based on secondary data.
In what ways would the use of primary data have improved this investigation?
[3 marks]
Specimen set 2 · Paper 1 · Q16 5 marks AO1=3, AO2=2 Research methods scientific processes
1 6
Outline the implications of psychological research for the economy. Refer to the
investigation above in your answer.
[5 marks]
Specimen set 2 · Paper 2 · Q8 4 marks AO3=4 Research methods scientific processes
A psychologist wanted to test the effects of biological rhythms on the ability to
solve maths problems. She used random sampling to form two groups each of
20 students.
She tested one group on one set of maths problems at 3 am in the morning. The
other group were tested on another set of maths problems at 3 pm in the
afternoon. She found that performance of the group tested at 3 pm was
significantly better than the group tested at 3 am.
When submitted for peer review the paper was rejected because of serious
design problems.
0 8
Explain one problem with the design of this study and suggest ways of
dealing with this problem.
[4 marks]
Specimen set 2 · Paper 2 · Q9 2 marks AO2=2 Research methods scientific processes
Read the item and then answer the questions that follow.
Researchers were interested in the spatial awareness skills of motorists. They
decided to investigate a possible relationship between different aspects of spatial
awareness. Motorists who had between ten and twelve years of driving
experience and held a clean driving licence with no penalty points were asked to
complete two sets of tasks.
Set 1: To follow a series of instructions and using a map, to identify various
locations correctly. This provided a map reading score for each motorist with a
maximum score of 20.
Set 2: To complete a series of practical driving tasks accurately. This involved
tasks such as driving between cones, driving within lines and parking inside
designated spaces. Each motorist was observed completing the Set 2 tasks by a
single trained observer who rated each performance by giving the driver a rating
out of 10.
The following results were obtained.
Table 1: The map reading scores and driver ratings of motorists
Participant driver
Map reading score
Driver rating
1
17
9
2
8
4
3
15
7
4
12
6
5
3
2
6
4
4
7
6
8
8
14
6
9
19
10
0 9
Should the hypothesis be directional? Explain your answer.
[2 marks]
Specimen set 2 · Paper 2 · Q10 3 marks AO2=3 Research methods scientific processes
1 0
Write a suitable hypothesis for this investigation.
.
[3 marks]
Specimen set 2 · Paper 2 · Q11 2 marks AO2=2 Research methods data handling
1 1
Identify a suitable graphical display for the data in Table 1 and briefly explain
why this display would be appropriate.
[2 marks]
Specimen set 2 · Paper 2 · Q12 3 marks AO2=3 Research methods data handlingresearch methods
1 2
Using the data in Table 1, comment on the relationship between the map
reading scores and the driver rating scores of the participants.
[3 marks]
Specimen set 2 · Paper 2 · Q13 6 marks AO2=2, AO3=4 Research methods scientific processes
1 3
Briefly outline one problem of using a single trained observer to rate the
participants’ driving skills in the practical task.  Briefly discuss how this data
collection method could be modified to improve the reliability of the data
collected.
[6 marks]
Specimen set 2 · Paper 2 · Q14 3 marks AO2=3 Research methods inferential testingdata handling
1 4
The researchers decided to analyse the data using a Spearman’s rho test.
Explain why this is a suitable choice of test for this investigation.
[3 marks]
Specimen set 2 · Paper 2 · Q15 4 marks AO2=2, AO3=2 Research methods inferential testingdata handling
Table 2: Table of critical values for a Spearman’s rho test
Level of significance for a two-tailed test
0.10
0.05
0.02
0.01
Level of significance for a one-tailed test
0.05
0.025
0.01
0.005
N=
8
0.643
0.738
0.833
0.881
9
0.600
0.700
0.783
0.833
10
0.564
0.648
0.745
0.794
Calculated rs must EQUAL or EXCEED the critical value for significance at the
level shown.
1 5
After analysis of the data the researchers obtained a calculated value of
rs= 0.808.
Using the information in Table 2 above, what conclusion can the researchers
draw about the relationship between the map reading and driving skills of the
motorists?  Explain your answer.
[4 marks]
Specimen set 2 · Paper 2 · Q16 4 marks AO1=4 Research methods inferential testing
1 6
Distinguish between a Type I error and a Type II error.
[4 marks]
Specimen set 2 · Paper 2 · Q17 4 marks AO2=2, AO3=2 Research methods data handling
When the researchers looked at the data collected more closely they noticed
possible gender differences in the results.
Results table of means and standard deviations for the map reading scores
of male and female motorists.
Map reading scores
Males
Females
Mean
15.4
5.25
Sd
2.70
2.22
1 7
What do the mean and standard deviation values suggest about the male and
female performances in the investigation?
[4 marks]
Specimen set 2 · Paper 2 · Q19 2 marks AO2=2 Research methods data handling
1 9
Using your answers to both question 17 and question 18, comment on the
performances of the male and the female participants in this study.
[2 marks]
Specimen set 2 · Paper 2 · Q20 2 marks AO1=2 Research methods scientific processes
2 0
Briefly explain one reason why it is important for research to be replicated.
[2 marks]
Specimen set 2 · Paper 3 · Q3.2 1 mark AO2=1 Research methods data handling
0 3 . 2
What level of measurement is being used in this study?
[1 mark]
Specimen set 2 · Paper 3 · Q3.3 2 marks AO3=2 Research methods data handling
0 3 . 3
Explain one limitation of the level of measurement you have identified in your
answer to 03.2.
[2 marks]
Specimen set 1 · AS Paper 1 · Q6.1 6 marks AO2=6 Research methods data handling
0 6
Read the item and then answer the questions that follow.
Participants in an experiment were shown a film of a robbery.  The participants
were then divided into two groups.  One group was interviewed using a standard
interview technique and the other group was interviewed using the cognitive
interview technique.  All participants were then given an ‘accuracy score’ (out of
20) based on how closely their recall matched the events in the film
(20 = completely accurate, 0 = not at all accurate).
The results of the experiment are shown in Table 1.
Table 1: The median accuracy score for the standard interview and the
cognitive interview
Standard interview
Cognitive interview
Median
10
15
0 6 . 1
Sketch an appropriate graphical display to show the median accuracy scores in
Table 1.
[6 marks]
Specimen set 1 · AS Paper 1 · Q6.2 4 marks AO3=4 Research methods scientific processes
0 6 . 2
The experiment used an independent groups design.
Explain how this study could have been modified by using a matched pairs design.
[4 marks]
Specimen set 1 · AS Paper 1 · Q10.2 4 marks AO3=4 Research methods scientific processes
1 0 . 2
Read the item and then answer the question that follows.
Studies of attachment often involve observation of interactions between mother
and baby pairs like Tasneem and Aisha.  Researchers sometimes write down
everything that happens as it takes place, including their own interpretation of the
events.
Explain how such observational research might be refined through the use of
behavioural categories.
[4 marks]
Specimen set 1 · AS Paper 2 · Q12.1 3 marks AO1=1, AO3=2 Research methods scientific processes
1 2
Read the item and then answer the questions that follow.
A psychologist wanted to see if creativity is affected by the presence of other
people.  To test this he arranged for 30 people to participate in a study that
involved generating ideas for raising funds for a local youth club.  Participants
were randomly allocated to one of two conditions.
Condition A: there were 15 participants in this condition.  Each participant was
placed separately in a room and was given 40 minutes to think of as many ideas
as possible for raising funds for a local youth club.  The participant was told to
write down his or her ideas and these were collected in by the psychologist at the
end of the 40 minutes.
Condition B: there were 15 participants in this condition.  The participants were
randomly allocated to 5 groups of equal size.  Each group was given 40 minutes
to think of as many ideas as possible for raising funds for a local youth club.  Each
group was told to write down their ideas and these were collected by the
psychologist at the end of the 40 minutes.
The psychologist counted the number of ideas generated by the participants in
both conditions and calculated the total number of ideas for each condition.
Table 2: Total number of ideas generated in Condition A (when working
alone) and in Condition B (when working in a group)
Condition A
Condition B
Working alone
Working in a group
Total number of
110
75
ideas generated
1 2 . 1
Identify the experimental design used in this study and outline one advantage of this
experimental design.
[3 marks]
Specimen set 1 · AS Paper 2 · Q12.2 2 marks AO1=2 Research methods scientific processes
1 2 . 2
Describe one other experimental design that researchers use in psychology.
[2 marks]
Specimen set 1 · AS Paper 2 · Q12.3 2 marks AO3=2 Research methods scientific processes
1 2 . 3
Apart from using random allocation, suggest one way in which the psychologist might
have improved this study by controlling for the effects of extraneous variables.  Justify
your answer.
[2 marks]
Specimen set 1 · AS Paper 2 · Q12.4 3 marks AO2=3 Research methods scientific processes
1 2 . 4
Write a suitable hypothesis for this study.
[3 marks]
Specimen set 1 · AS Paper 2 · Q12.6 1 mark AO1=1 Research methods data handling
1 2
Read the item and then answer the questions that follow.
The psychologist noticed that the number of ideas generated by each of the
individual participants in Condition A varied enormously whereas there was little
variation in performance between the 5 groups in Condition B.  He decided to
calculate a measure of dispersion for each condition.
1 2 . 6
Name a measure of dispersion the psychologist could use.
[1 mark]
Specimen set 1 · AS Paper 2 · Q12.7 1 mark AO2=1 Research methods data handling
1 2 . 7
The psychologist uses the measure of dispersion you have named in your answer to
question 12.6.  State how the result for each condition would differ.
[1 mark]
Specimen set 1 · AS Paper 2 · Q12.8 3 marks AO2=3 Research methods scientific processes
1 2 . 8
Explain how the psychologist could have used random allocation to assign the
15 participants in Condition B into the 5 groups.
[3 marks]
Specimen set 1 · AS Paper 2 · Q12.9 2 marks AO3=2 Research methods data handling
1 2
Read the item and then answer the questions that follow.
This is a repeat of information given on page 12.
Table 2: Total number of ideas generated in Condition A (when working
alone) and in Condition B (when working in a group)
Condition A
Condition B
Working alone
Working in a group
Total number of
ideas generated
110
75
1 2 . 9
Using the information given in Table 2, explain how the psychologist could further
analyse the data using percentages.
[2 marks]
Specimen set 1 · AS Paper 2 · Q12.10 6 marks AO2=6 Research methods scientific processes
1 2 . 10
At the end of the study the psychologist debriefed each participant.  Write a debriefing
that the psychologist could read out to the participants in Condition A.
[6 marks]
Extra space
Specimen set 1 · Paper 1 · Q4.1 2 marks AO2=2 Research methods data handling
0 4
Read the item and then answer the questions that follow.
An experiment was carried out to test the effects of learning similar and dissimilar
information on participants’ ability to remember.
In Stage 1 of the experiment, 10 participants in Group A, the ‘similar’ condition,
were given a list of 20 place names in the UK.  They were given two minutes to
learn the list.  10 different participants in Group B, the ‘dissimilar’ condition, were
given the same list of 20 place names in the UK.  They were also given two
minutes to learn the list.
In Stage 2 of the experiment, participants in Group A were given a different list of
20 more place names in the UK, and were given a further two minutes to learn it.
Participants in Group B were given a list of 20 boys’ names, and were given a
further two minutes to learn it.
In Stage 3 of the experiment, all participants were given five minutes to recall as
many of the 20 place names in the UK, from the list in Stage 1, as they could.  The
raw data from the two groups is below.
Table 1:
Number of place names recalled from the list in Stage 1
Group A
Group B
5
11
6
10
4
11
7
13
8
12
4
14
5
15
4
11
6
14
7
14
0 4 . 1
What is the most appropriate measure of central tendency for calculating the average
of the scores, from Table 1, in each of the two groups?  Justify your answer.
[2 marks]
Specimen set 1 · Paper 1 · Q9 2 marks AO1=2 Research methods scientific processes
0 9
Read the item and then answer the question that follows.
A group of researchers used ‘event sampling’ to observe children’s friendships
over a period of three weeks at break times and lunchtimes during the school day.
Explain what is meant by ‘event sampling’.
[2 marks]
Specimen set 1 · Paper 1 · Q10 4 marks AO3=4 Research methods research methodsscientific processes
1 0
The investigation in question 09 is an example of a ‘naturalistic observation’.
Briefly discuss how observational research might be improved by conducting
observations in a controlled environment.
[4 marks]
Specimen set 1 · Paper 1 · Q15.1 2 marks AO3=2 Research methods research methodsdata handling
1 5
Read the item and then answer the questions that follow.
Twenty depressed patients were treated using cognitive behavioural therapy.
Over the course of the six-week treatment, each patient’s mood was monitored
every week using a self-report mood scale (where a score of 20 = extremely
positive mood and a score of 0 = extremely negative mood).  Each week they
also completed a quality of sleep questionnaire which was scored from
10 = excellent sleep to 0 = very poor sleep.
At the end of the study the researchers correlated each patient’s final mood score
with his or her final sleep score.  The results are shown in Figure 1 below.
Figure 1:   Scattergram to show the relationship between final mood scores
and final sleep scores for 20 patients at the end of therapy
Final
mood
score
Final sleep score
1 5 . 1
Outline the type of relationship shown in Figure 1 above and suggest why it would not
be appropriate for the researchers to conclude that better sleep improves mood.
[2 marks]
Specimen set 1 · Paper 1 · Q15.2 2 marks AO3=2 Research methods scientific processes
1 5 . 2
Outline one way in which the researchers should have dealt with ethical issues in this
study.
[2 marks]
Specimen set 1 · Paper 1 · Q15.3 4 marks AO3=4 Research methods scientific processesdata handlinginferential testing
1 5 . 3
The sleep questionnaire used by the researchers had not been checked to see
whether or not it was a reliable measure of sleep quality.
Explain how this study could be modified by checking the sleep questionnaire for
test-retest reliability.
[4 marks]
Specimen set 1 · Paper 2 · Q12 2 marks AO2=2 Research methods scientific processes
Read the item and then answer the questions that follow.
A psychologist wanted to see if verbal fluency is affected by whether people think
they are presenting information to a small group of people or to a large group of
people.
The psychologist needed a stratified sample of 20 people.  She obtained the
sample from a company employing 60 men and 40 women.
The participants were told that they would be placed in a booth where they
would read out an article about the life of a famous author to an audience.
Participants were also told that the audience would not be present, but would
only be able to hear them and would not be able to interact with them.
There were two conditions in the study, Condition A and Condition B.
Condition A: 10 participants were told the audience consisted of 5 listeners.
Condition B: the other 10 participants were told the audience consisted of
100 listeners.
Each participant completed the study individually.  The psychologist recorded
each presentation and then counted the number of verbal errors made by each
participant.
1 2
Identify the dependent variable in this study.
[2 marks]
Specimen set 1 · Paper 2 · Q13 3 marks AO2=3 Research methods scientific processes
1 3
Write a suitable hypothesis for this study.
[3 marks]
Specimen set 1 · Paper 2 · Q14 3 marks AO2=3 Research methods scientific processes
1 4
Identify one extraneous variable that the psychologist should have controlled in the
study and explain why it should have been controlled.
[3 marks]
Specimen set 1 · Paper 2 · Q15 2 marks AO2=2 Research methods scientific processes
1 5
Explain one advantage of using a stratified sample of participants in this study.
[2 marks]
Specimen set 1 · Paper 2 · Q17 4 marks AO2=4 Research methods scientific processes
1 7
The psychologist wanted to randomly allocate the 20 people in her stratified sample to
the two conditions.  She needed an equal number of males in each condition and an
equal number of females in each condition.  Explain how she would have done this.
[4 marks]
Specimen set 1 · Paper 2 · Q18 6 marks AO2=2, AO3=4 Research methods data handling
1 8
Read the item and then answer the questions that follow.
The results of the study are given in Table 1.
Table 1: Mean number of verbal errors and standard deviations for both
conditions
Condition A
Condition B
(believed audience of
(believed audience
5 listeners)
of 100 listeners)
Mean
11.1
17.2
Standard
deviation
1.30
3.54
What conclusions might the psychologist draw from the data in Table 1?  Refer to the
means and standard deviations in your answer.
[6 marks]
Extra space
Specimen set 1 · Paper 2 · Q19 3 marks AO3=3 Research methods data handling
1 9
Read the item and then answer the question that follows.
The psychologist had initially intended to use the range as a measure of
dispersion in this study but found that one person in Condition A had made an
exceptionally low number of verbal errors.
Explain how using the standard deviation rather than the range in this situation, would
improve the study.
[3 marks]
Specimen set 1 · Paper 2 · Q20 4 marks AO2=4 Research methods inferential testingdata handlingscientific processes
2 0
Name an appropriate statistical test that could be used to analyse the number of
verbal errors in Table 1.  Explain why the test you have chosen would be a suitable
test in this case.
[4 marks]
Specimen set 1 · Paper 2 · Q21 2 marks AO1=2 Research methods inferential testing
2 1
The psychologist found the results were significant at p<0.05.  What is meant by ‘the
results were significant at p<0.05’?
[2 marks]
Specimen set 1 · Paper 2 · Q22 2 marks AO2=2 Research methods scientific processes
2 2
Briefly explain one method the psychologist could use to check the validity of the data
she collected in this study.
[2 marks]
Specimen set 1 · Paper 2 · Q23 2 marks AO3=2 Research methods scientific processes
2 3
Briefly explain one reason why it is important for research to undergo a peer review
process.
[2 marks]
Specimen set 1 · Paper 3 · Q6.2 4 marks AO2=4 Research methods scientific processesinferential testingdata handling
0 6 . 2
Some ways of establishing validity involve the use of a statistical test.
Outline how these researchers could have used a statistical test to establish
concurrent validity of the mathematical reasoning ability test.
[4 marks]
Specimen set 1 · Paper 3 · Q8.1 3 marks AO2=3 Research methods data handling
0 8
Read the item and then answer the questions that follow.
A psychologist investigating the investment model of relationships, devised a
self-report Investment Scale for use with a group of 100 female
participants. The scale gave an investment score for each participant on a
scale of 0–20, with
0 representing no investment in relationships and 20 representing
extreme investment in relationships.
The psychologist calculated measures of central tendency for the
investment scores. He found that the mean investment score was 8.6,
the median investment score was 9.5 and the mode investment score
was 13.
0 8 . 1
Sketch a graph to show the most likely distribution curve for the investment
scores in this study. Label the axes of your graph and mark on it the positions of
the mean, median and mode.
[3 marks]
Specimen set 1 · Paper 3 · Q8.2 1 mark AO2=1 Research methods data handling
0 8 . 2
What sort of distribution does your graph show?
[1 mark]
Specimen set 1 · Paper 3 · Q9 2 marks AO3=2 Research methods research methods
0 9
What is meant by the ‘nature-nurture debate’ in psychology?
[2 marks]
Specimen set 1 · Paper 3 · Q13.1 3 marks AO2=3 Research methods data handling
1 3
Read the item and then answer the questions that follow.
In a study of androgyny, a group of 100 18-year-old students completed a
self-report sex-role inventory. The inventory gave two sets of scores: a femininity
score and a masculinity score.  Each set of scores was on a scale of 0–20, with
0 representing no masculinity or no femininity and 20 representing extreme
masculinity or extreme femininity.
The researchers calculated measures of central tendency for the masculinity
scores. They found that the mean masculinity score was 10.3, the median
masculinity score was 9.5 and the mode masculinity score was 7.
1 3 . 1
Sketch a graph to show the most likely distribution curve for the masculinity scores
in his study. Label the axes of your graph and mark on it the positions of the mean,
median and mode.
[3 marks]
Specimen set 1 · Paper 3 · Q13.2 1 mark AO2=1 Research methods data handling
1 3 . 2
What sort of distribution does your graph show?
[1 mark]
Specimen set 1 · Paper 3 · Q14 2 marks AO3=2 Research methods research methods
1 4
Explain one limitation of a self-report technique
[1 mark]
Specimen set 1 · Paper 3 · Q18.1 3 marks AO2=3 Research methods data handling
1 8
Read the item and then answer the questions that follow.
A psychologist investigating egocentrism interviewed 100 parents, each of whom
had a four-year-old child. She asked each parent to rate his or her child’s
egocentrism on a scale of 0–10, with 0 representing no egocentrism and 10
representing extreme egocentrism.
The psychologist calculated measures of central tendency for the egocentrism
scores. They found that the mean egocentrism score was 4.8, the median
egocentrism score was 5 and the mode egocentrism score was 6.
1 8 . 1
Sketch a graph to show the most likely distribution curves for the egocentrism
scores in this study. Label the axes of your graph and mark on it the positions of the
mean, median and mode.
[3 marks]
Specimen set 1 · Paper 3 · Q18.2 1 mark AO2=1 Research methods data handling
1 8 . 2
What sort of distribution does your graph show?
[1 mark]
Specimen set 1 · Paper 3 · Q19 2 marks AO3=2 Research methods research methodsscientific processes
1 9
Explain one limitation of asking parents to rate their own children.
[2 marks]

Work with an AQA psychology tutor

Essays not reaching the top band? Book a session with Andy, a former AQA examiner.

Prefer email? Send an enquiry

If you are under 18, please include a parent's contact details. Enquiries go to enquiries@alevelpsychologytutor.com and are deleted once handled. All tutoring is online.