Calculations and maths skills

Percentages, means, standard deviation, significance tables: the 10% maths marks. 29 questions on current content.

Other types: Research methods · Application questions (using the stem) · 8- and 16-mark essays · Multiple-choice questions · Short evaluation questions (2–4 marks) · Outline questions (3–4 marks)

June 2024 · AS Paper 2 · Q8.1 2 marks AO2=2 Calculation Easy data handling
0 8
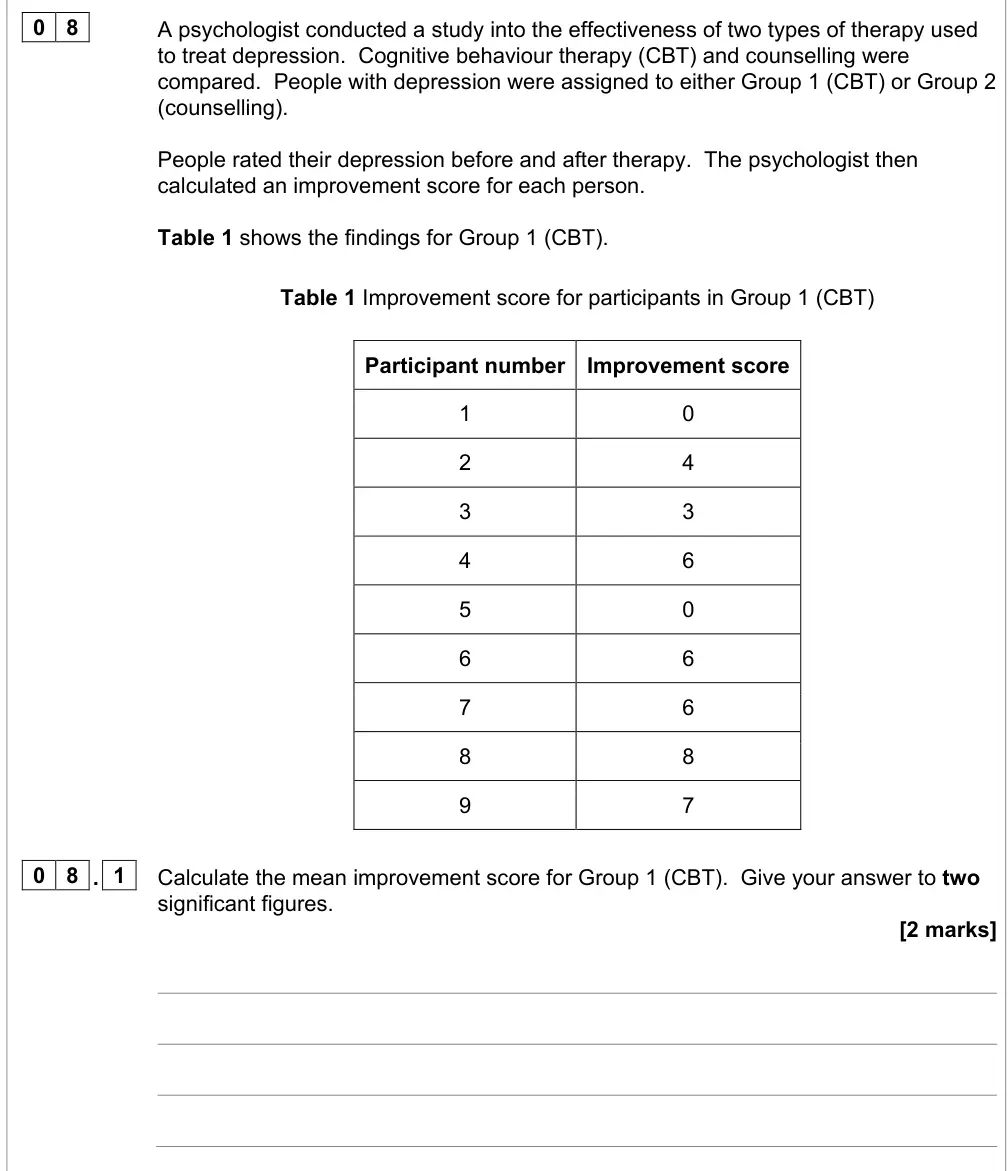
A psychologist conducted a study into the effectiveness of two types of therapy used
to treat depression.  Cognitive behaviour therapy (CBT) and counselling were
compared.  People with depression were assigned to either Group 1 (CBT) or Group 2
(counselling).
People rated their depression before and after therapy.  The psychologist then
calculated an improvement score for each person.
Table 1 shows the findings for Group 1 (CBT).
Table 1 Improvement score for participants in Group 1 (CBT)
Participant number Improvement score
1
0
2
4
3
3
4
6
5
0
6
6
7
6
8
8
9
7
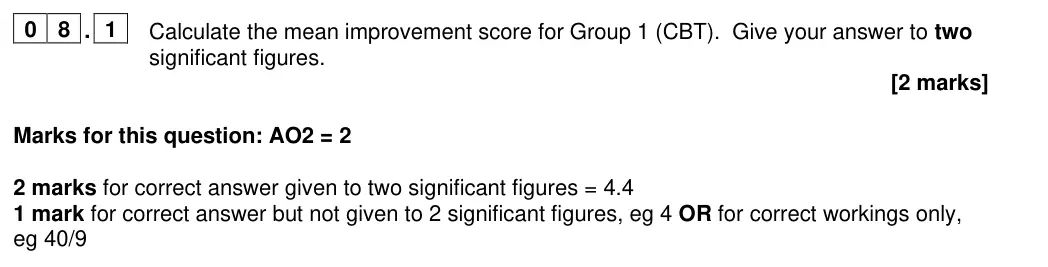
0 8 . 1
Calculate the mean improvement score for Group 1 (CBT).  Give your answer to two
significant figures.
[2 marks]
June 2024 · AS Paper 2 · Q18.1 2 marks AO2=2 Calculation data handling
1 8
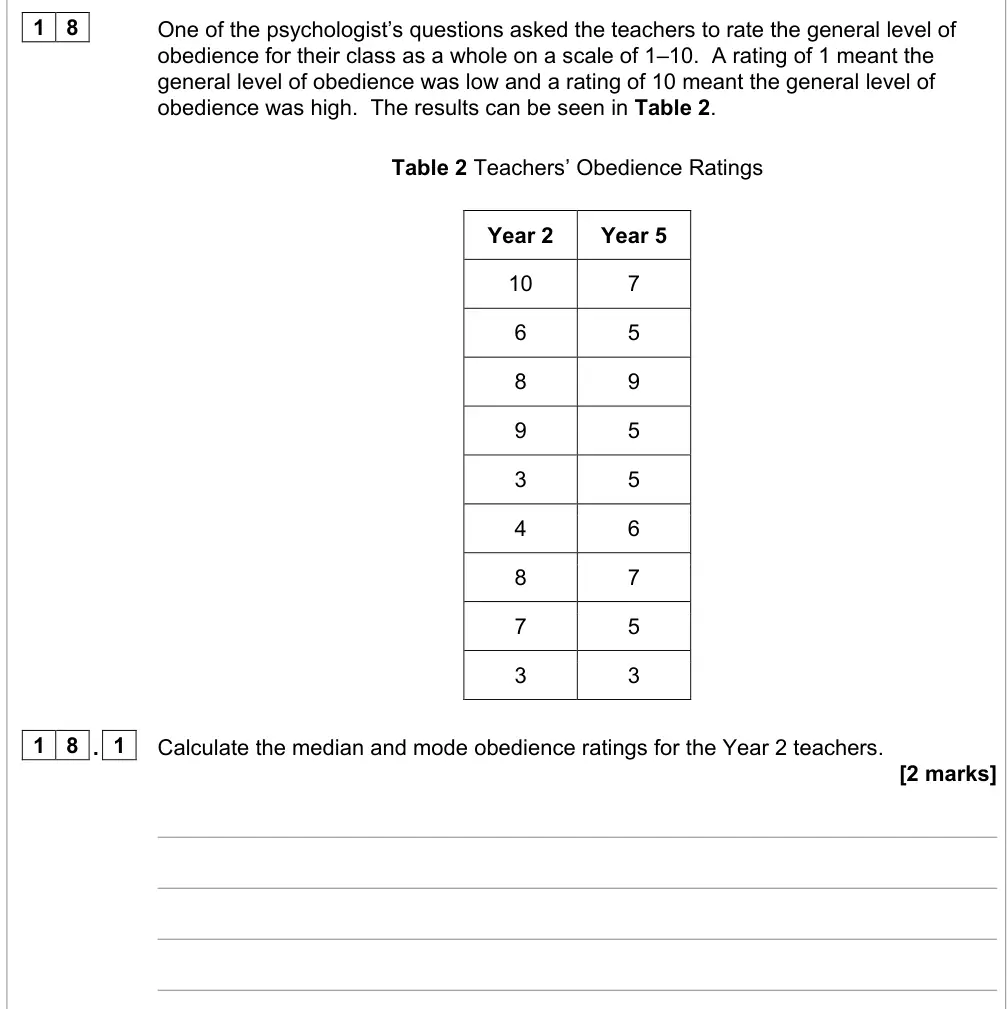
One of the psychologist’s questions asked the teachers to rate the general level of
obedience for their class as a whole on a scale of 1–10.  A rating of 1 meant the
general level of obedience was low and a rating of 10 meant the general level of
obedience was high.  The results can be seen in Table 2.
Table 2 Teachers’ Obedience Ratings
Year 2
Year 5
10
7
6
5
8
9
9
5
3
5
4
6
8
7
7
5
3
3
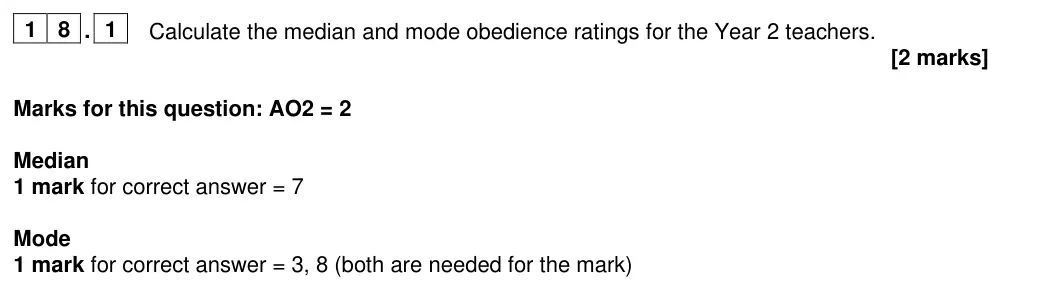
1 8 . 1
Calculate the median and mode obedience ratings for the Year 2 teachers.
[2 marks]
June 2023 · AS Paper 2 · Q11 3 marks AO2=3 Calculation Hard inferential testing
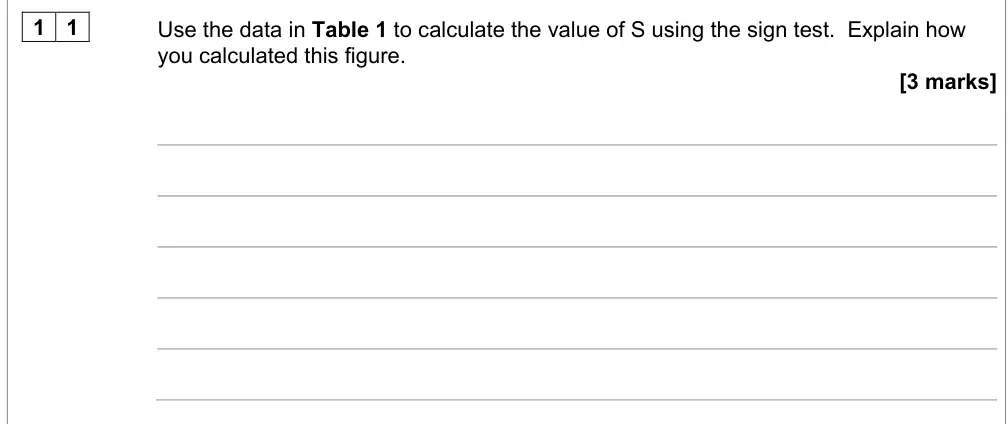
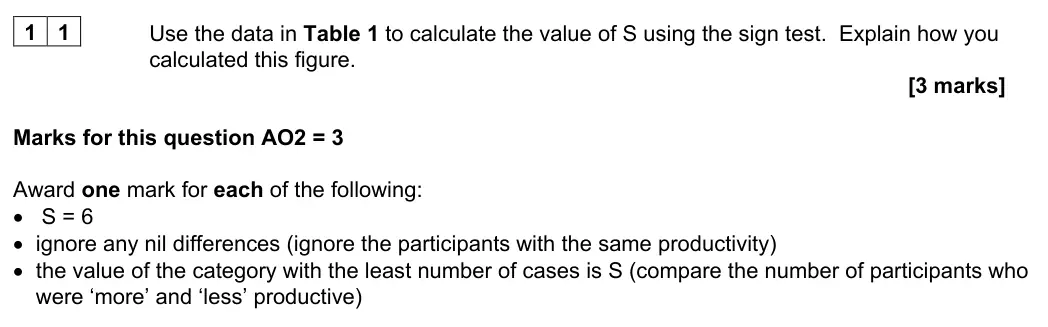
1 1
Use the data in Table 1 to calculate the value of S using the sign test.  Explain how
you calculated this figure.
[3 marks]
June 2019 · AS Paper 1 · Q5.3 3 marks AO2=3 Calculation Easy data handling
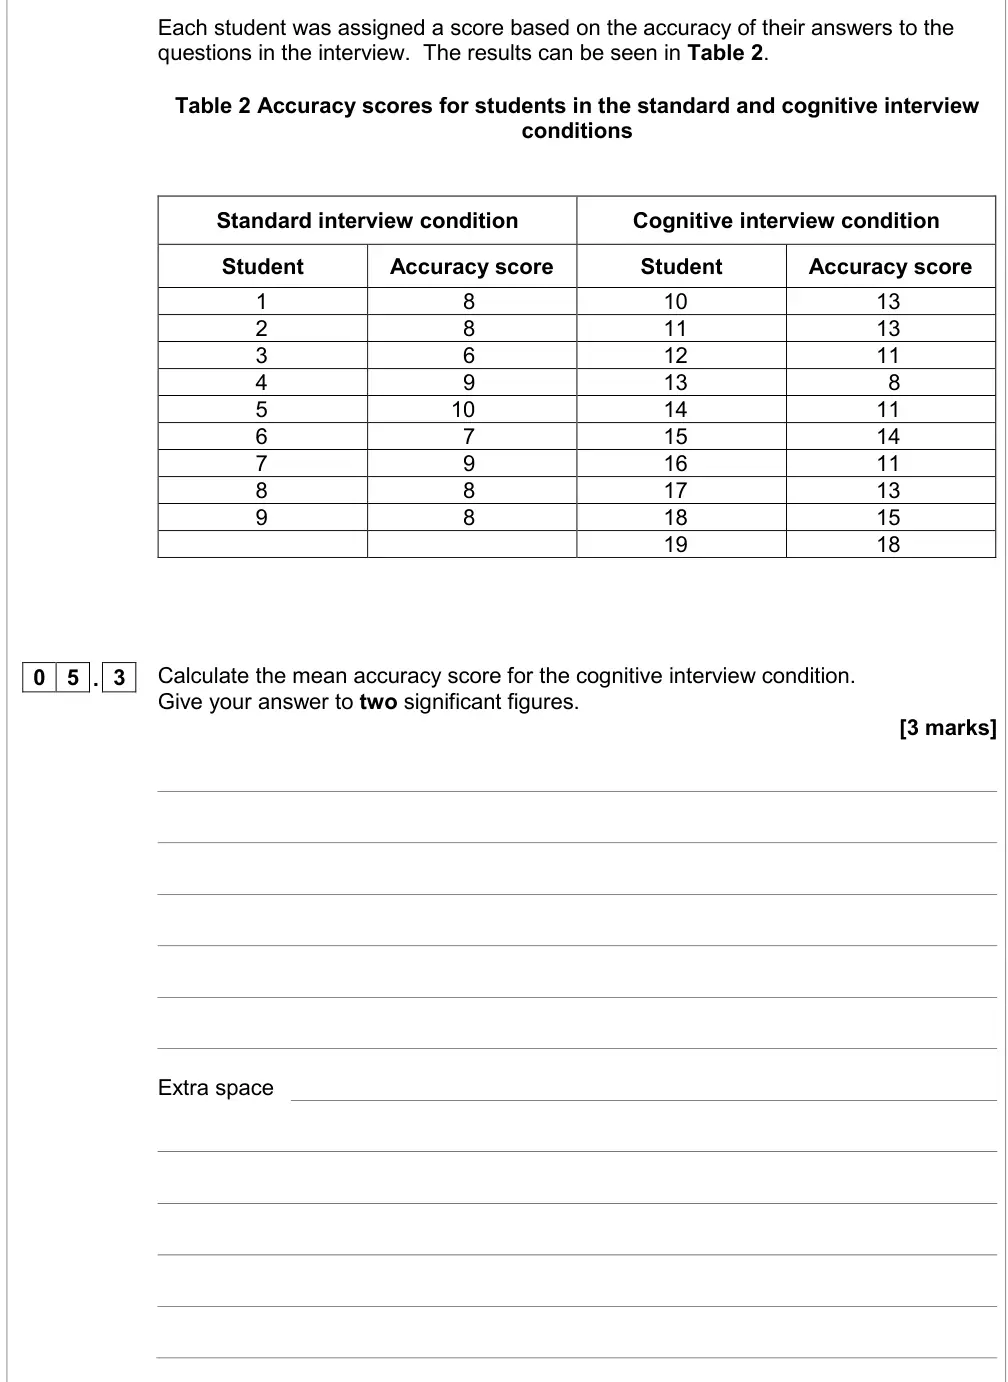
Each student was assigned a score based on the accuracy of their answers to the
questions in the interview.  The results can be seen in Table 2.
Table 2 Accuracy scores for students in the standard and cognitive interview
conditions
Standard interview condition
Cognitive interview condition
Student
Accuracy score
Student
Accuracy score
1
8
10
13
2
8
11
13
3
6
12
11
4
9
13
8
5
10
14
11
6
7
15
14
7
9
16
11
8
8
17
13
9
8
18
15
19
18
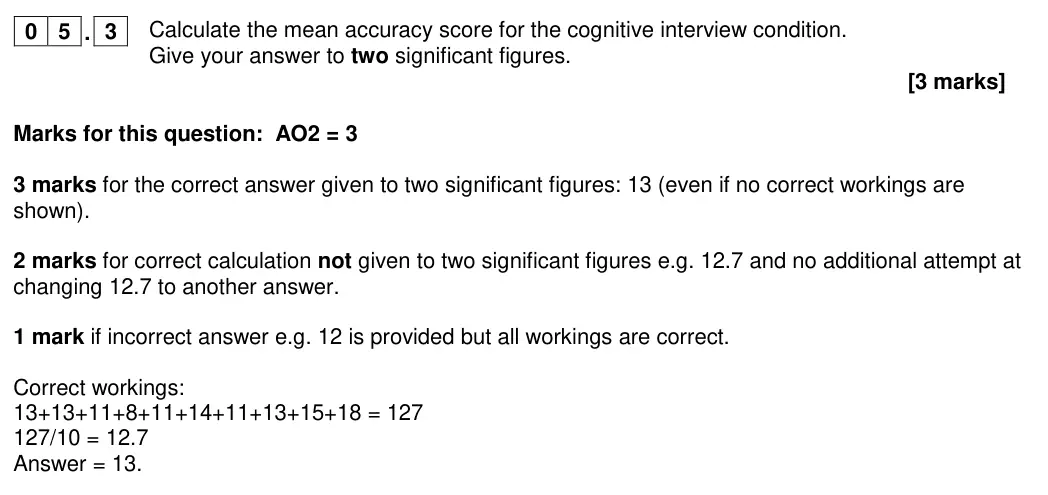
0 5 . 3
Calculate the mean accuracy score for the cognitive interview condition.
Give your answer to two significant figures.
[3 marks]
Extra space
June 2019 · Paper 1 · Q2 2 marks AO2=2 Calculation data handling
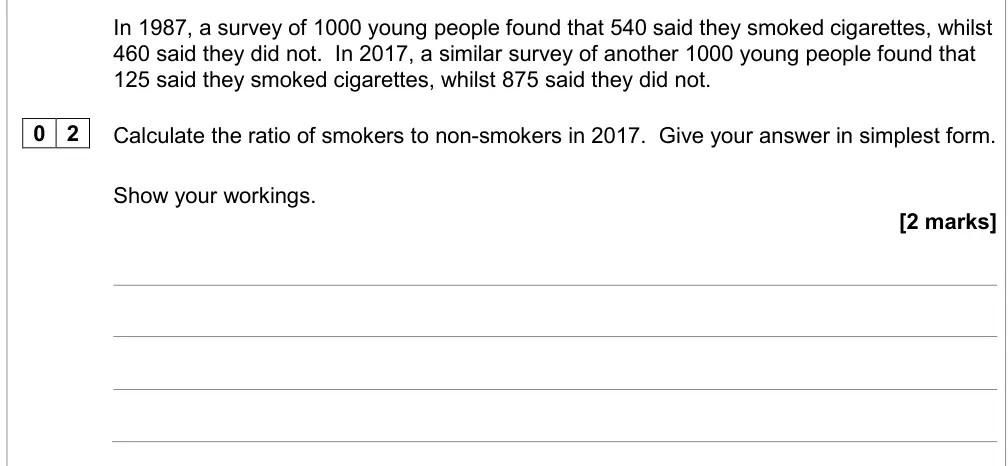
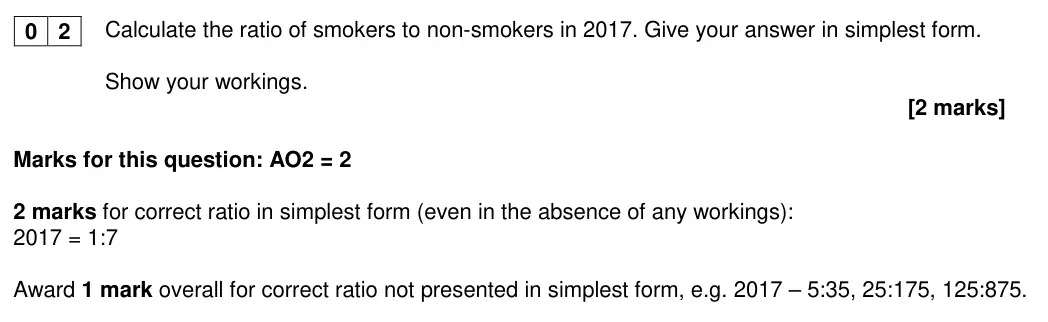
In 1987, a survey of 1000 young people found that 540 said they smoked cigarettes, whilst
460 said they did not.  In 2017, a similar survey of another 1000 young people found that
125 said they smoked cigarettes, whilst 875 said they did not.
0 2
Calculate the ratio of smokers to non-smokers in 2017.  Give your answer in simplest form.
Show your workings.
[2 marks]
June 2019 · Paper 2 · Q6 3 marks AO2=3 Calculation data handling
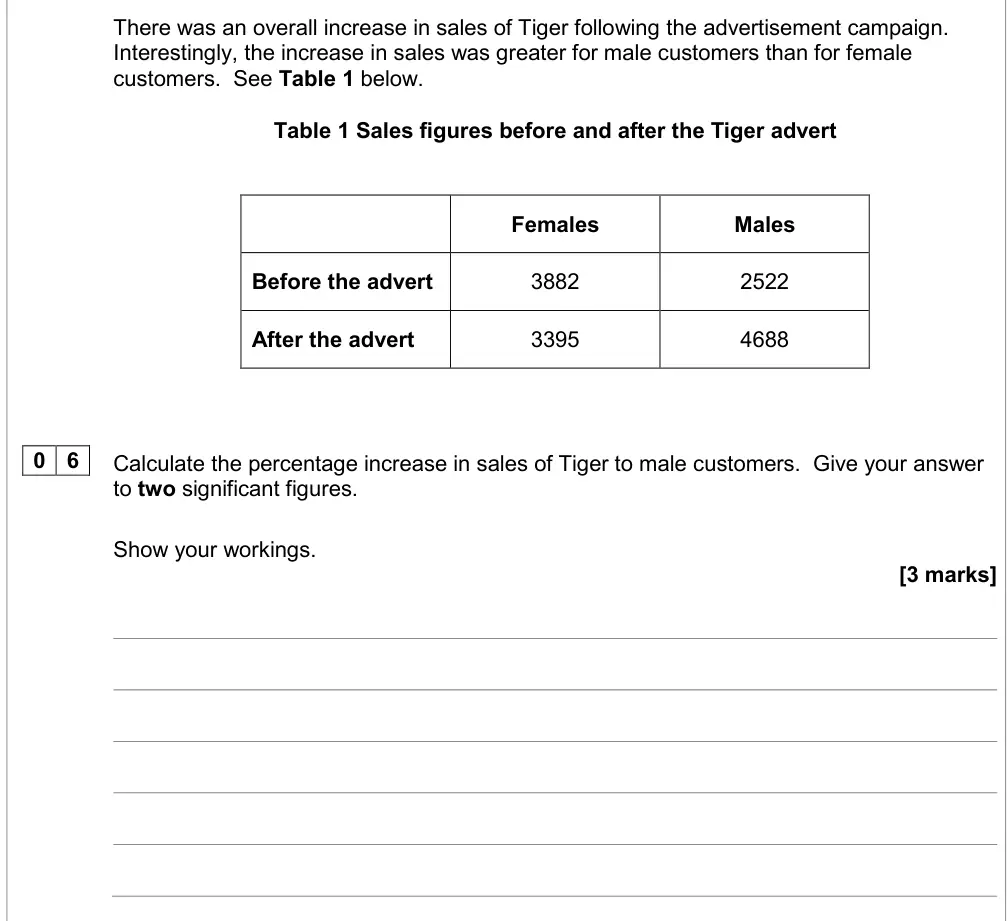
There was an overall increase in sales of Tiger following the advertisement campaign.
Interestingly, the increase in sales was greater for male customers than for female
customers.  See Table 1 below.
Table 1 Sales figures before and after the Tiger advert
Females
Males
Before the advert
3882
2522
After the advert
3395
4688
0 6
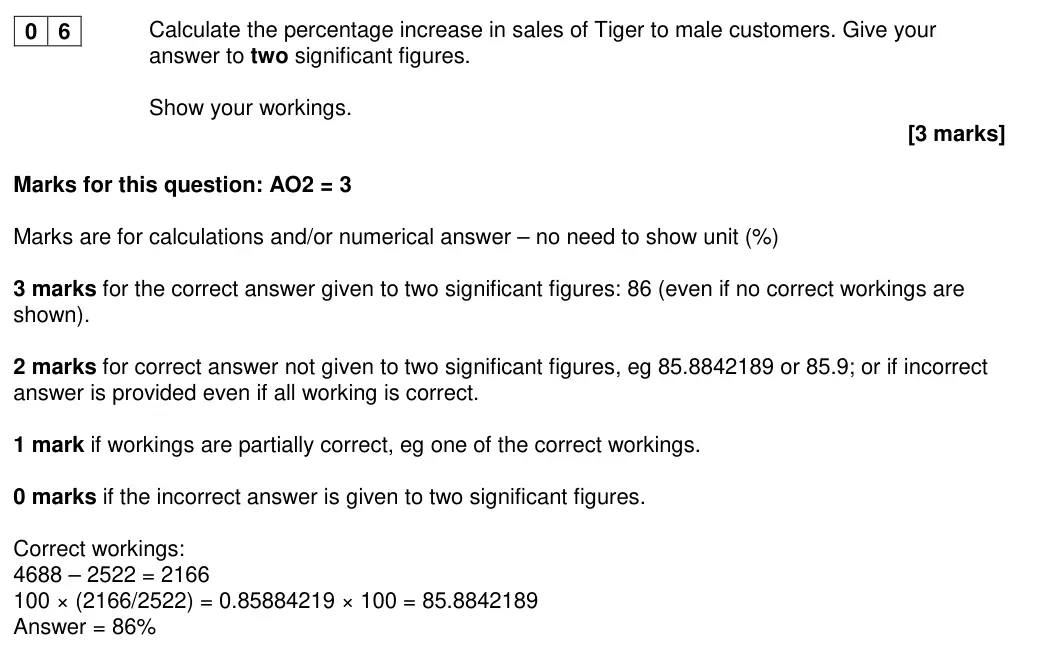
Calculate the percentage increase in sales of Tiger to male customers.  Give your answer
to two significant figures.
Show your workings.
[3 marks]
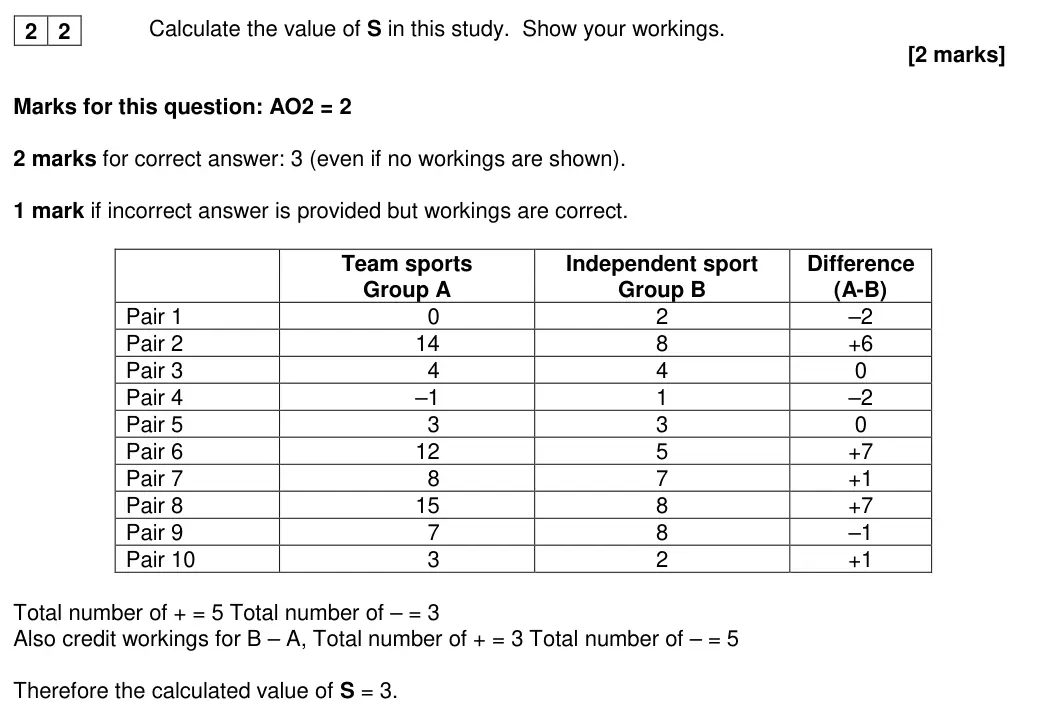
June 2019 · Paper 2 · Q22 2 marks AO2=2 Calculation inferential testing
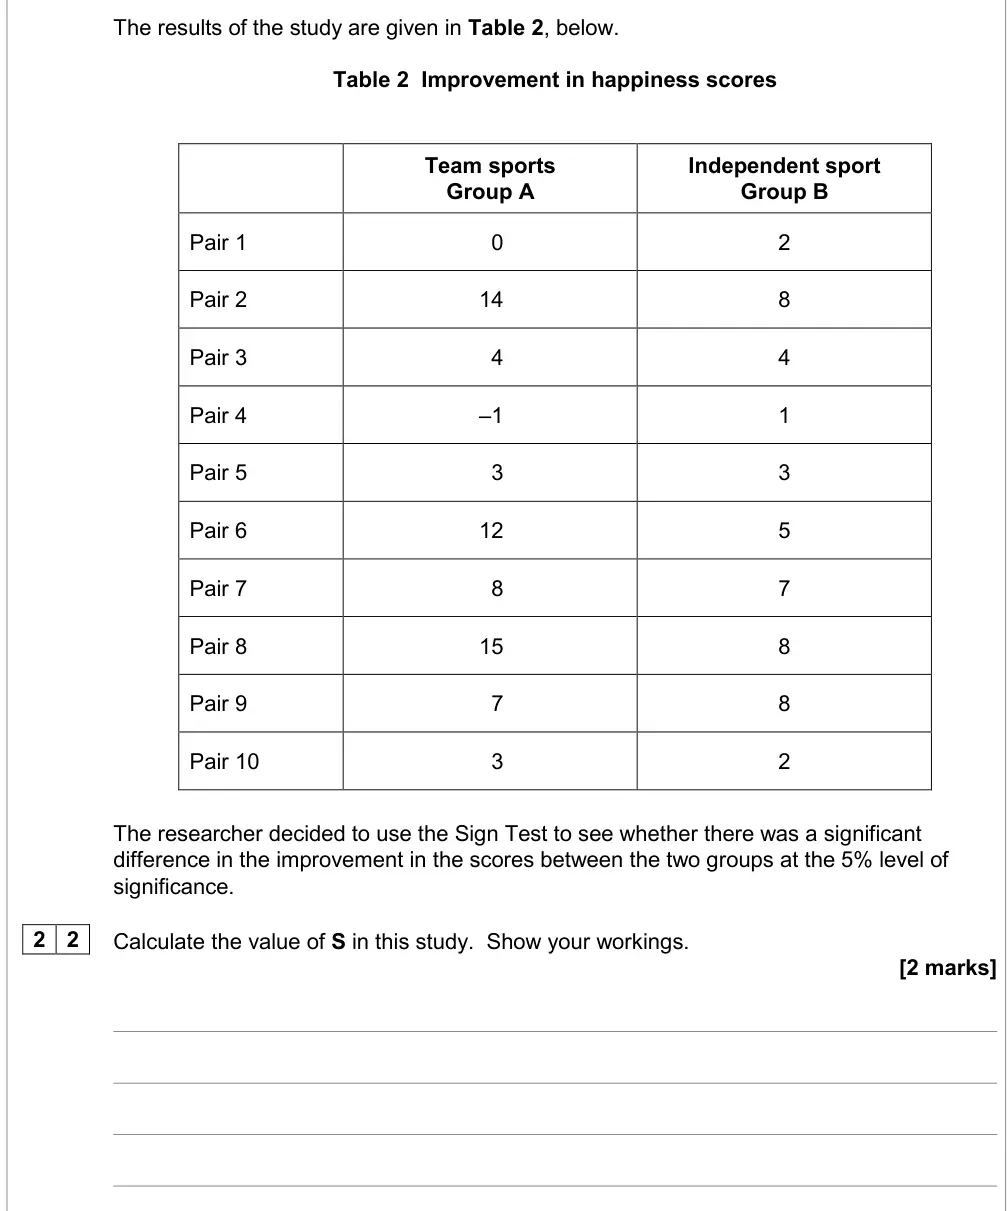
The results of the study are given in Table 2, below.
Table 2  Improvement in happiness scores
Team sports
Independent sport
Group A
Group B
Pair 1
0
2
Pair 2
14
8
Pair 3
4
4
Pair 4
–1
1
Pair 5
3
3
Pair 6
12
5
Pair 7
8
7
Pair 8
15
8
Pair 9
7
8
Pair 10
3
2
The researcher decided to use the Sign Test to see whether there was a significant
difference in the improvement in the scores between the two groups at the 5% level of
significance.
2 2
Calculate the value of S in this study.  Show your workings.
[2 marks]
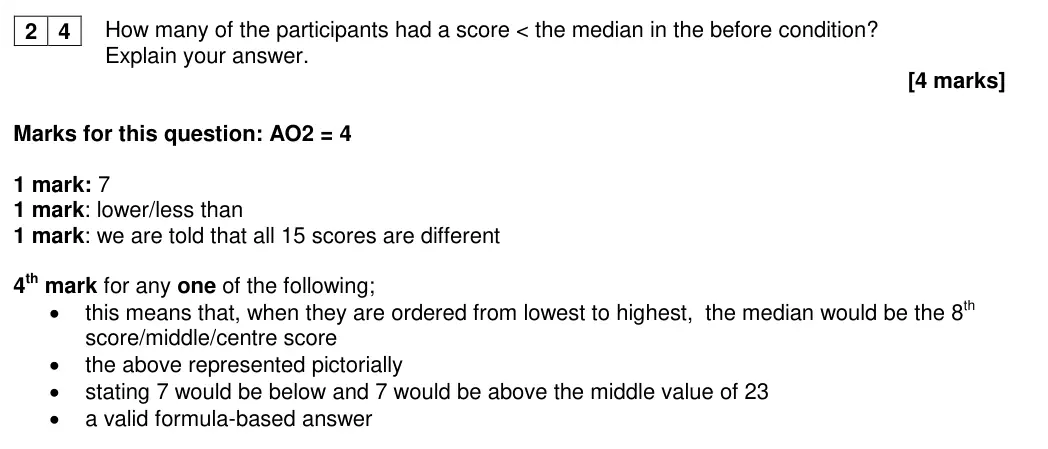
June 2019 · Paper 3 · Q24 4 marks AO2=4 Calculation data handling
Each participant had a different total score in the before condition, where the maximum
score was 40 and the median score was 23.
2 4
How many of the participants had a score < the median in the before condition?
Explain your answer.
[4 marks]
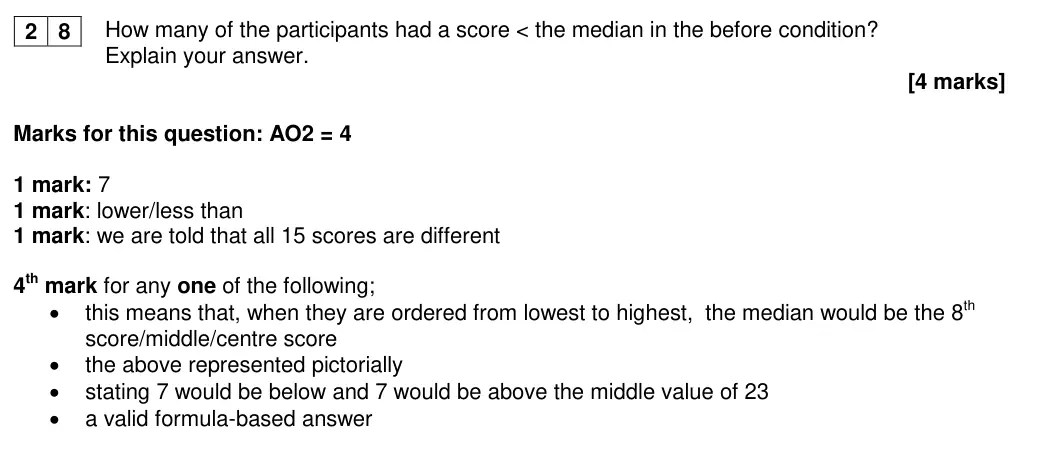
June 2019 · Paper 3 · Q28 4 marks AO2=4 Calculation data handling
Each participant had a different total score in the before condition, where the maximum
score was 40 and the median score was 23.
2 8
How many of the participants had a score < the median in the before condition?
Explain your answer.
[4 marks]
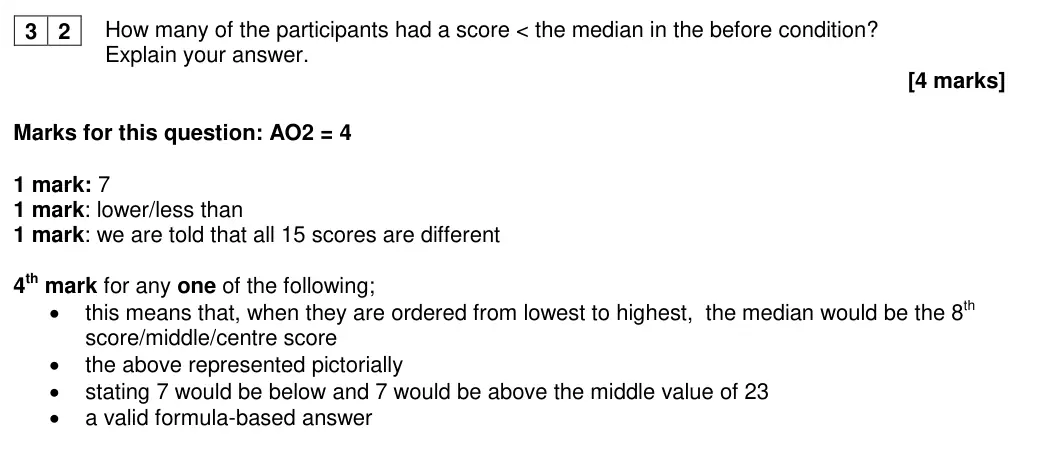
June 2019 · Paper 3 · Q32 4 marks AO2=4 Calculation data handling
Each participant had a different total score in the before condition, where the maximum
score was 40 and the median score was 23.
3 2
How many of the participants had a score < the median in the before condition?
Explain your answer.
[4 marks]
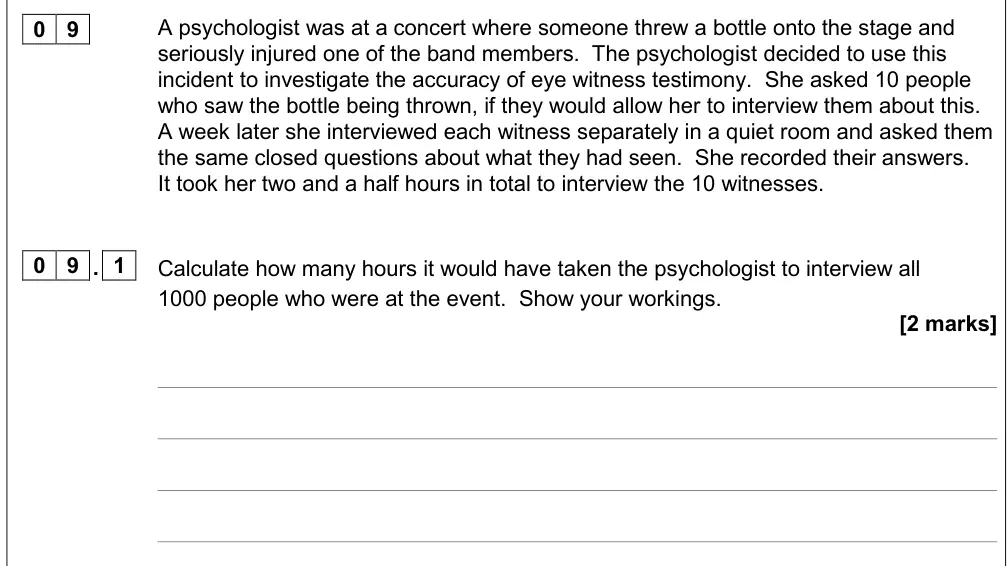
June 2018 · AS Paper 1 · Q9.1 2 marks AO2=2 Calculation scientific processes
0 9
A psychologist was at a concert where someone threw a bottle onto the stage and
seriously injured one of the band members.  The psychologist decided to use this
incident to investigate the accuracy of eye witness testimony.  She asked 10 people
who saw the bottle being thrown, if they would allow her to interview them about this.
A week later she interviewed each witness separately in a quiet room and asked them
the same closed questions about what they had seen.  She recorded their answers.
It took her two and a half hours in total to interview the 10 witnesses.
0 9 . 1
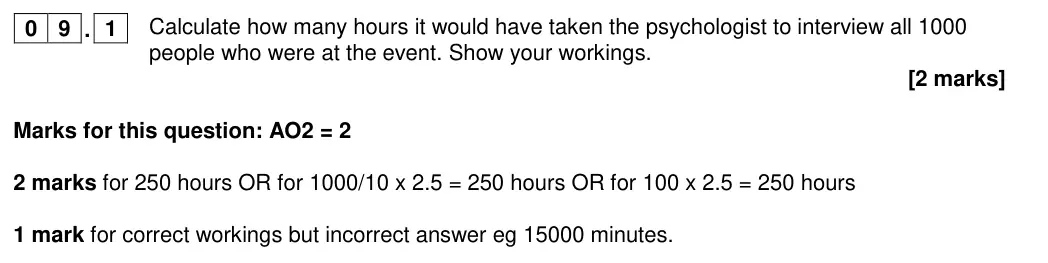
Calculate how many hours it would have taken the psychologist to interview all
1000 people who were at the event.  Show your workings.
[2 marks]
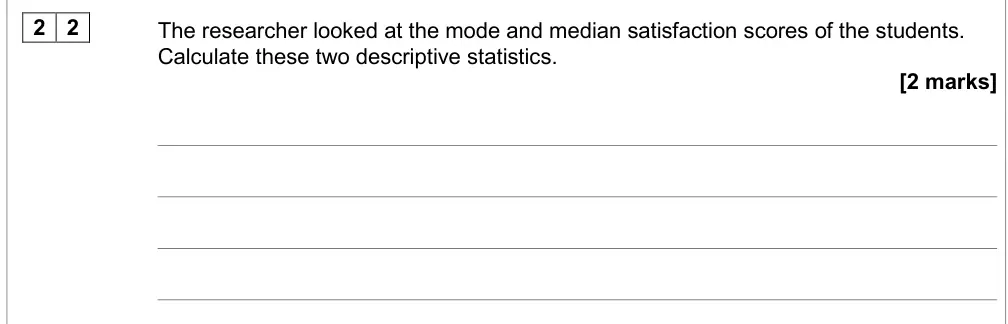
June 2018 · AS Paper 2 · Q22 2 marks AO2=2 Calculation Easy data handling
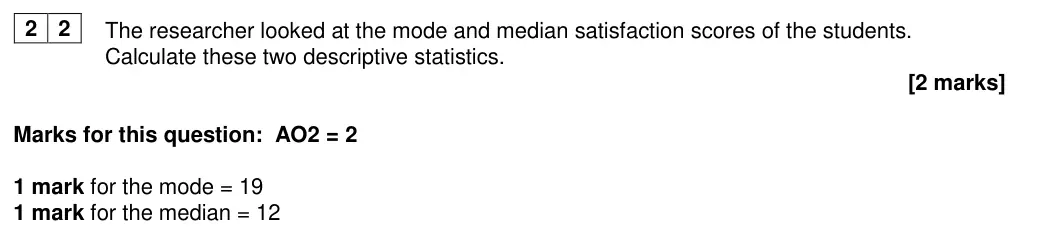
2 2
The researcher looked at the mode and median satisfaction scores of the students.
Calculate these two descriptive statistics.
[2 marks]
June 2018 · Paper 2 · Q10 3 marks AO2=3 Calculation Easy data handling
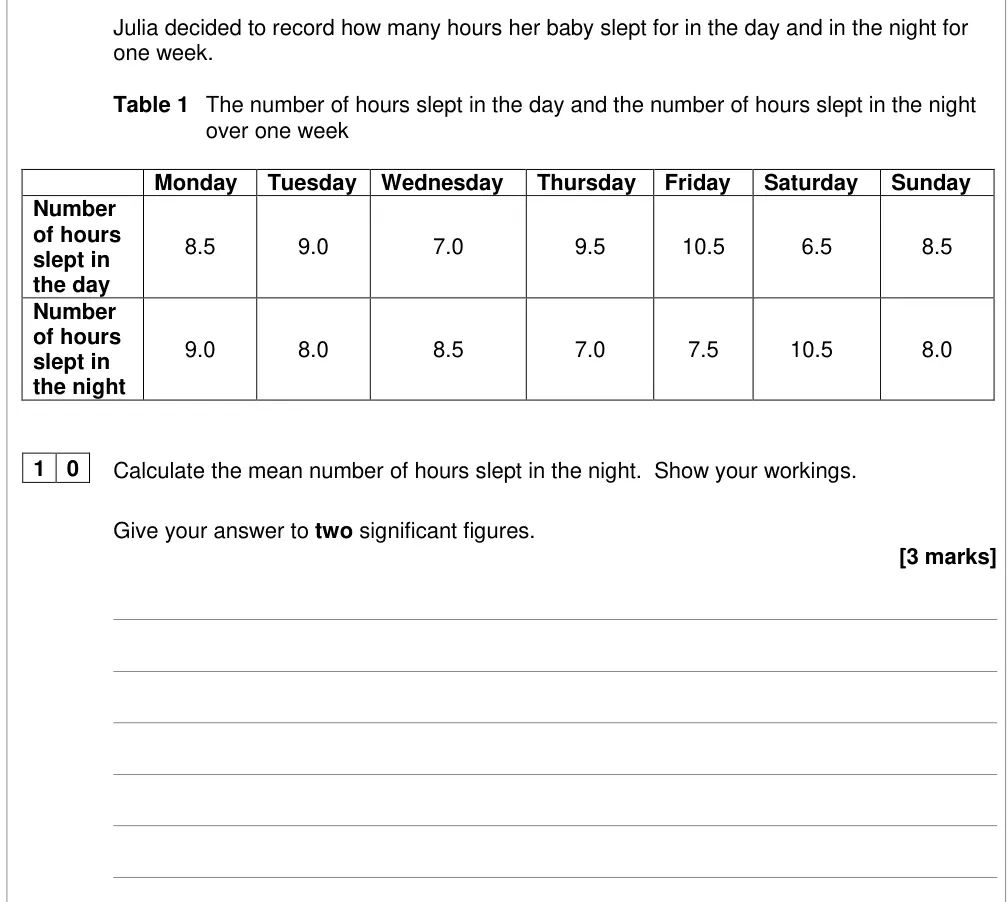
Julia decided to record how many hours her baby slept for in the day and in the night for
one week.
Table 1   The number of hours slept in the day and the number of hours slept in the night
over one week
Monday
Tuesday
Wednesday
Thursday
Friday
Saturday
Sunday
Number
of hours
8.5
9.0
7.0
9.5
10.5
6.5
8.5
slept in
the day
Number
of hours
9.0
8.0
8.5
7.0
7.5
10.5
8.0
slept in
the night
1 0
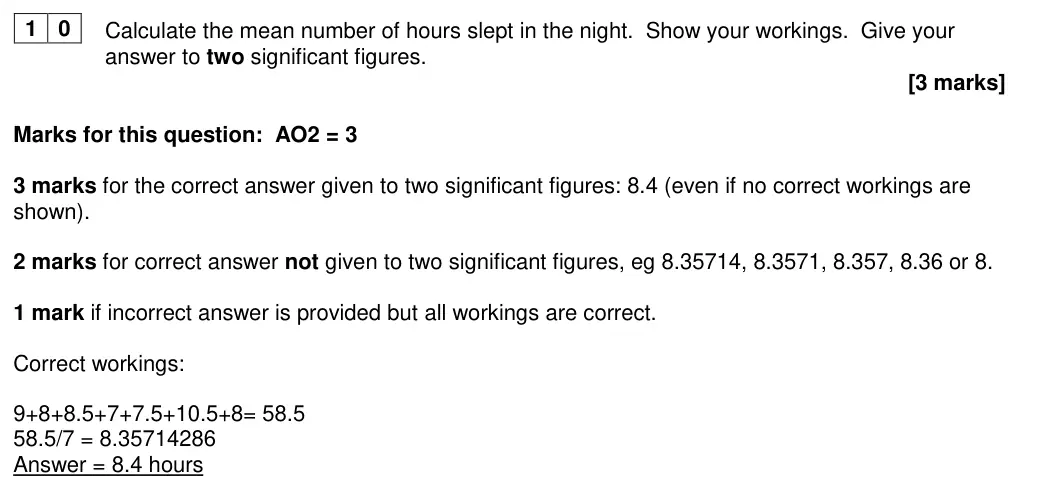
Calculate the mean number of hours slept in the night.  Show your workings.
Give your answer to two significant figures.
[3 marks]
June 2018 · Paper 2 · Q18 2 marks AO2=2 Calculation Easy data handling
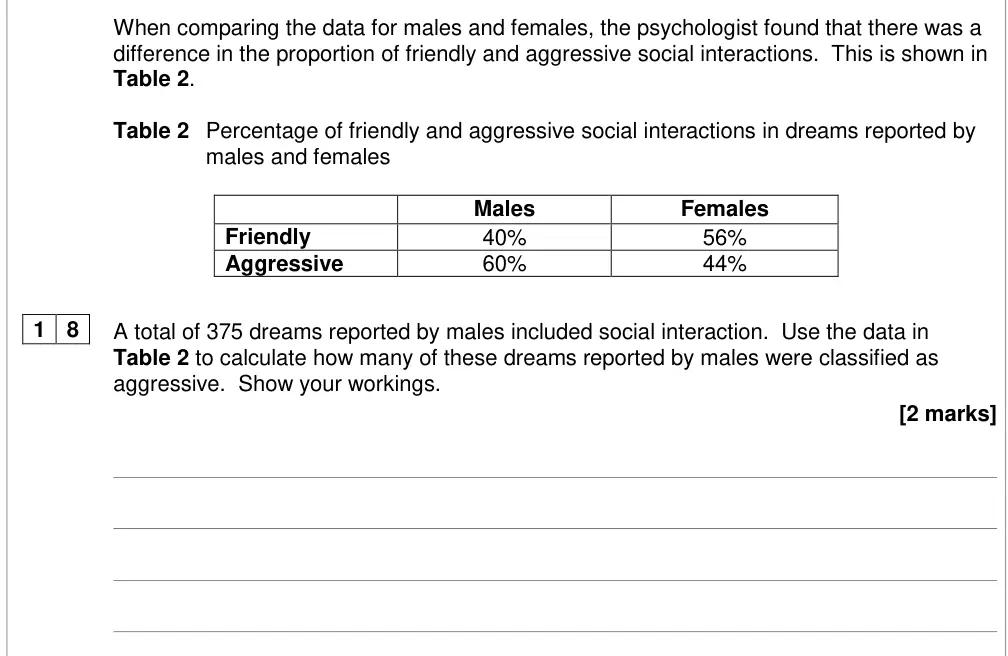
When comparing the data for males and females, the psychologist found that there was a
difference in the proportion of friendly and aggressive social interactions.  This is shown in
Table 2.
Table 2   Percentage of friendly and aggressive social interactions in dreams reported by
males and females
Males
Females
Friendly
40%
56%
Aggressive
60%
44%
1 8
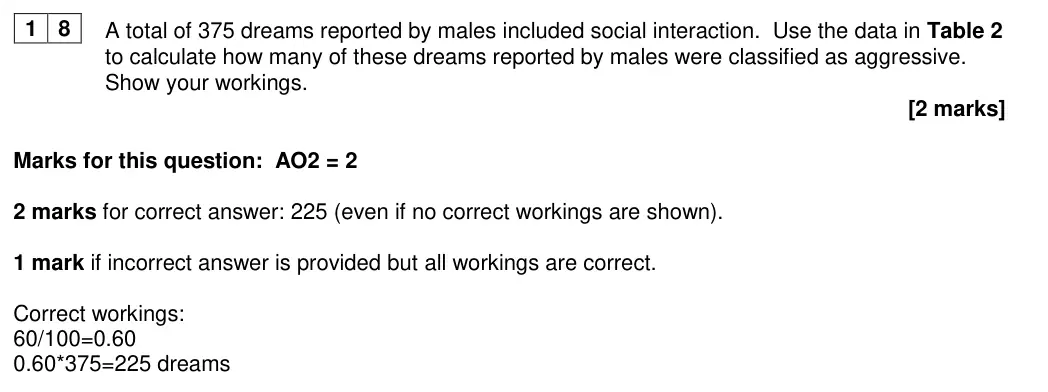
A total of 375 dreams reported by males included social interaction.  Use the data in
Table 2 to calculate how many of these dreams reported by males were classified as
aggressive.  Show your workings.
[2 marks]
June 2017 · AS Paper 1 · Q13 2 marks AO2=2 Calculation data handling
1 3
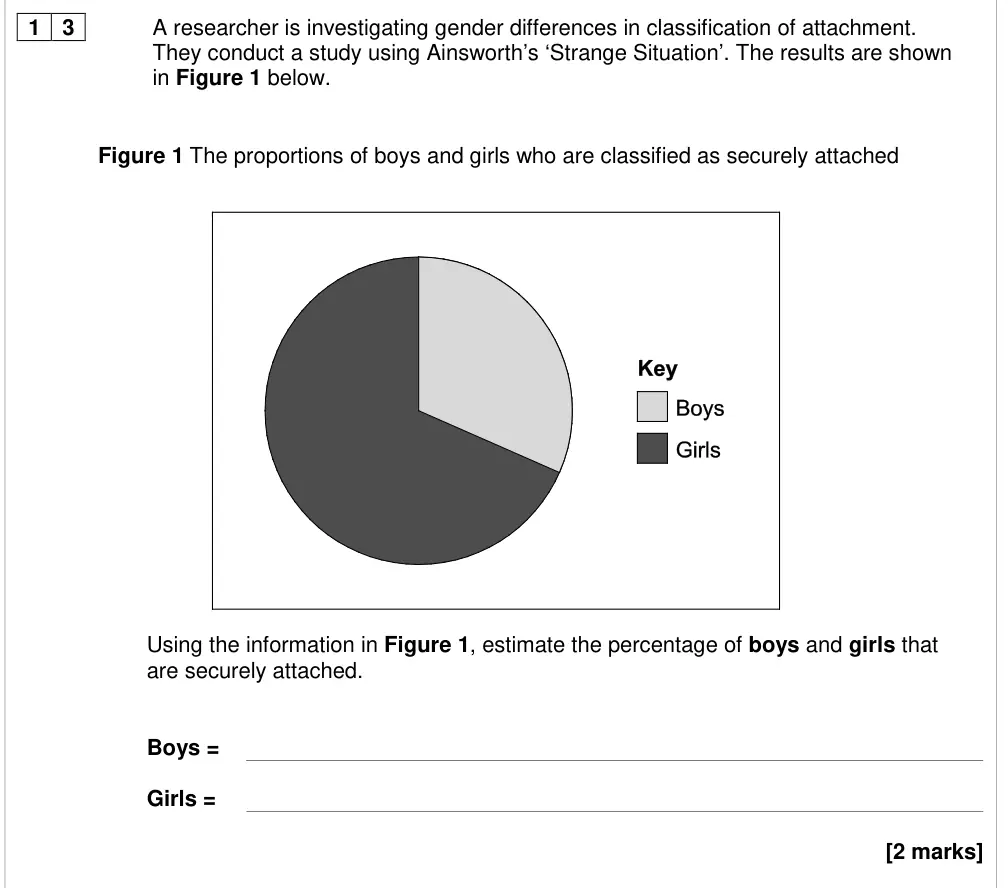
A researcher is investigating gender differences in classification of attachment.
They conduct a study using Ainsworth’s ‘Strange Situation’. The results are shown
in Figure 1 below.
Figure 1 The proportions of boys and girls who are classified as securely attached
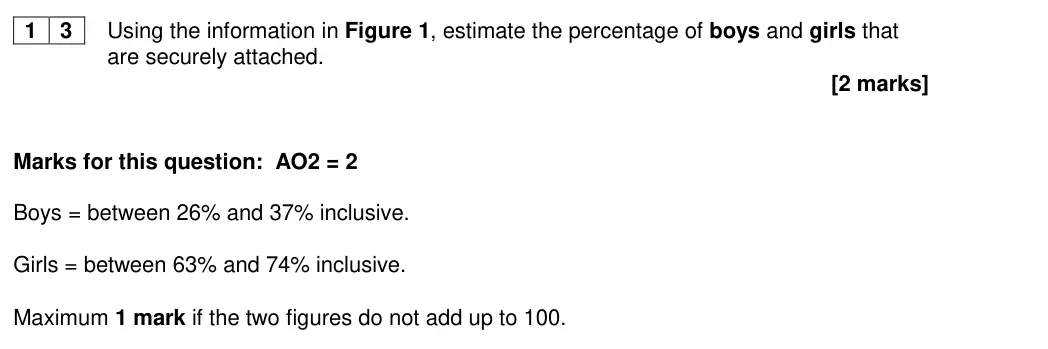
Using the information in Figure 1, estimate the percentage of boys and girls that
are securely attached.
Boys =
Girls =
[2 marks]
June 2017 · AS Paper 1 · Q14 2 marks AO2=2 Calculation Easy data handling
1 4
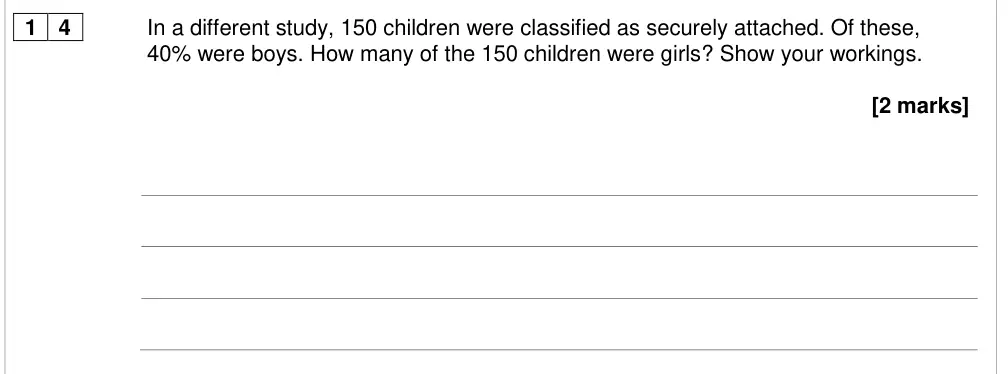
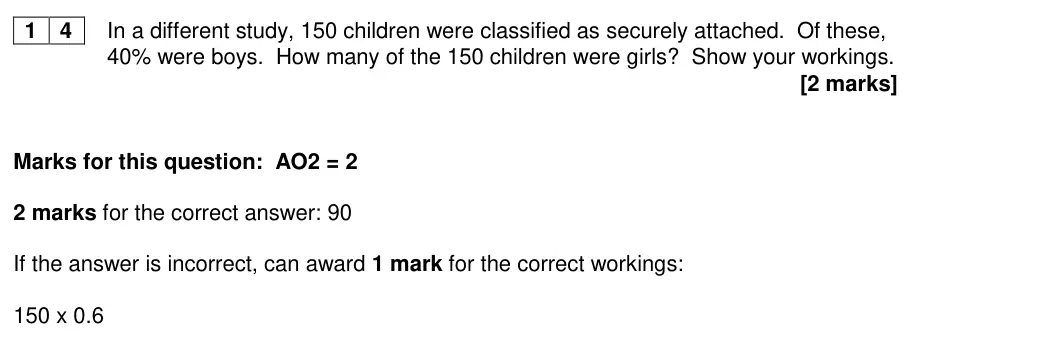
In a different study, 150 children were classified as securely attached. Of these,
40% were boys. How many of the 150 children were girls? Show your workings.
[2 marks]
June 2017 · AS Paper 2 · Q15 2 marks AO2=2 Calculation data handling
1 5
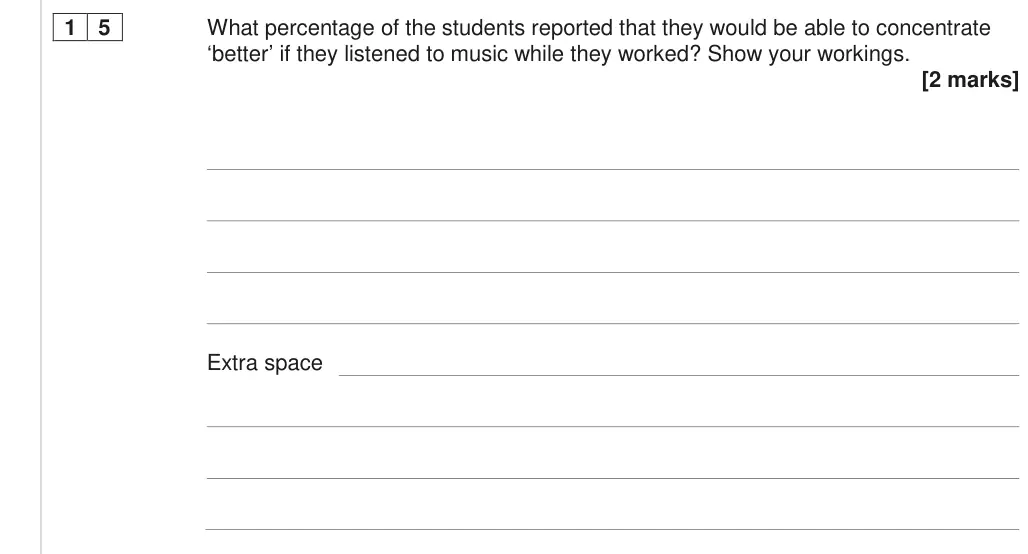
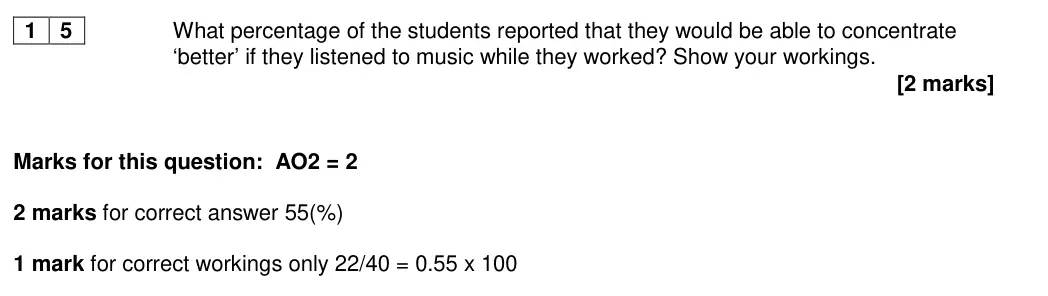
What percentage of the students reported that they would be able to concentrate
‘better’ if they listened to music while they worked? Show your workings.
[2 marks]
Extra space
June 2017 · AS Paper 2 · Q19 4 marks AO2=4 Calculation Easy data handling
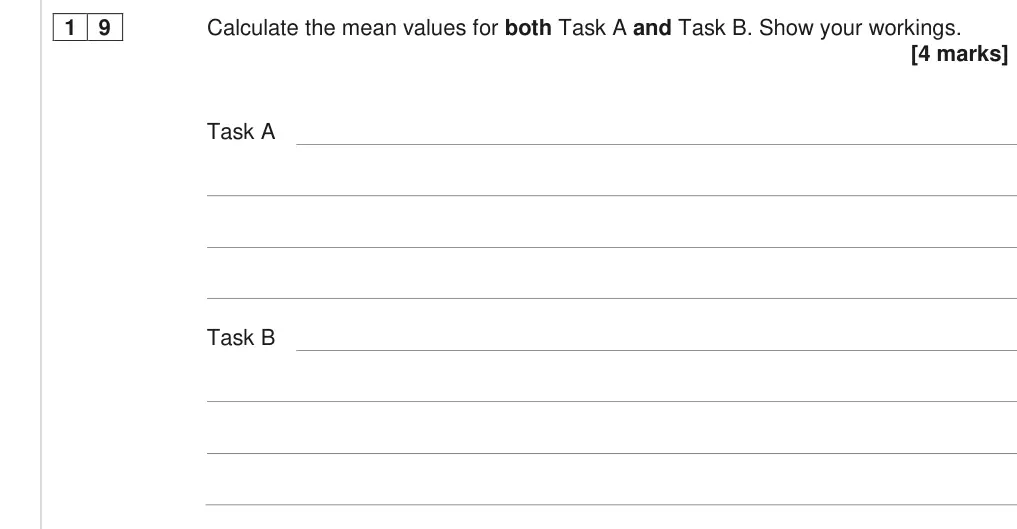
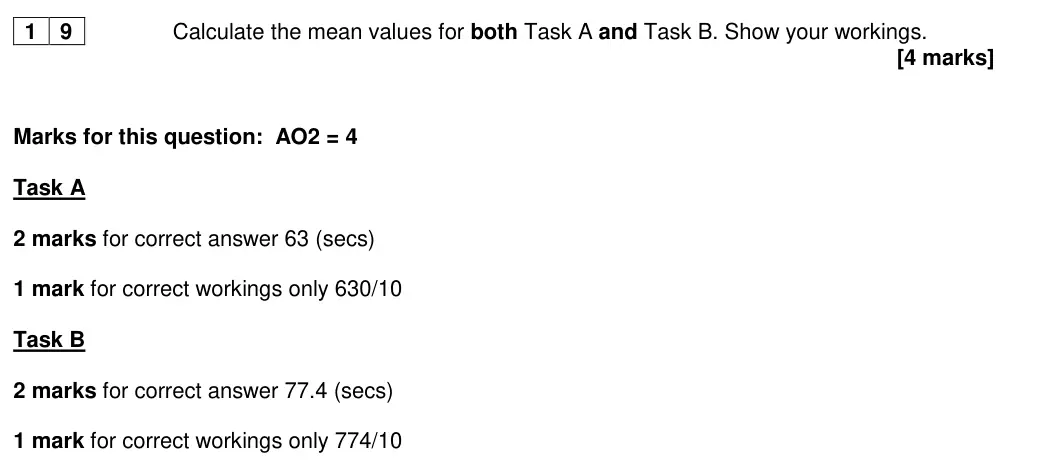
1 9
Calculate the mean values for both Task A and Task B. Show your workings.
[4 marks]
Task A
Task B
June 2017 · Paper 2 · Q15 4 marks AO2=4 Calculation data handling
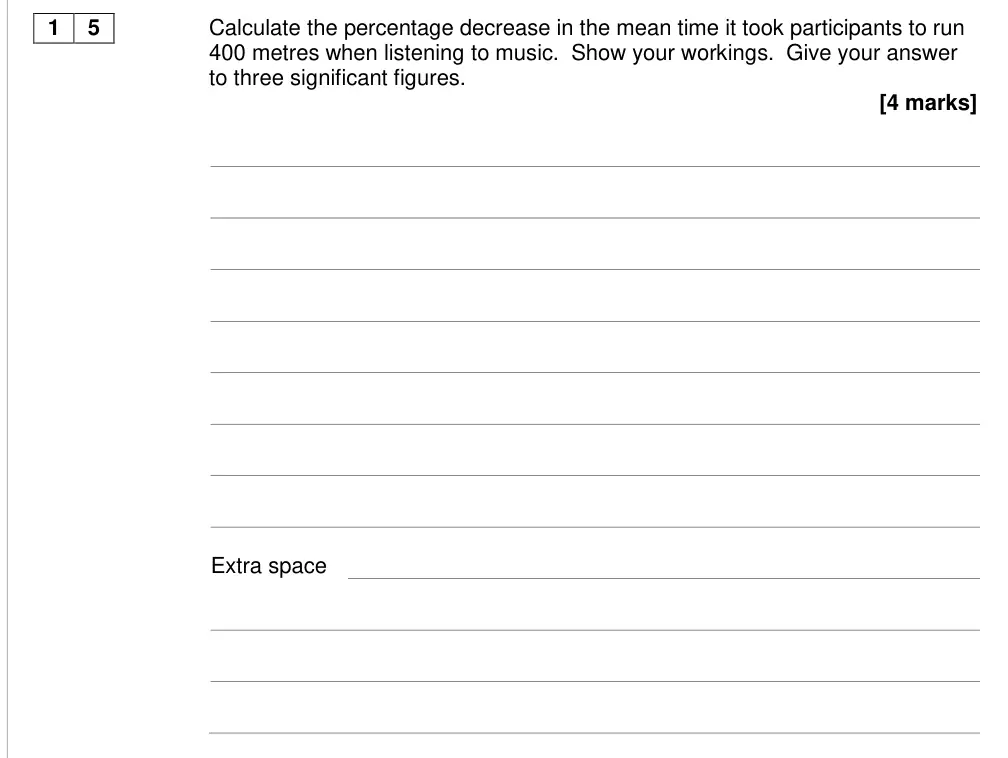
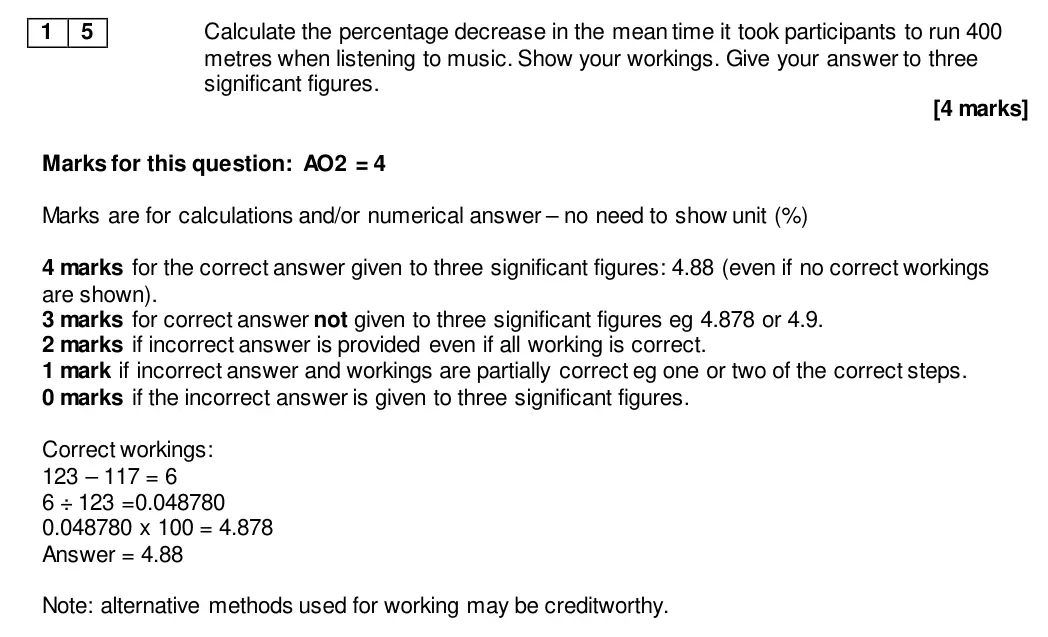
1 5
Calculate the percentage decrease in the mean time it took participants to run
400 metres when listening to music.  Show your workings.  Give your answer
to three significant figures.
[4 marks]
Extra space
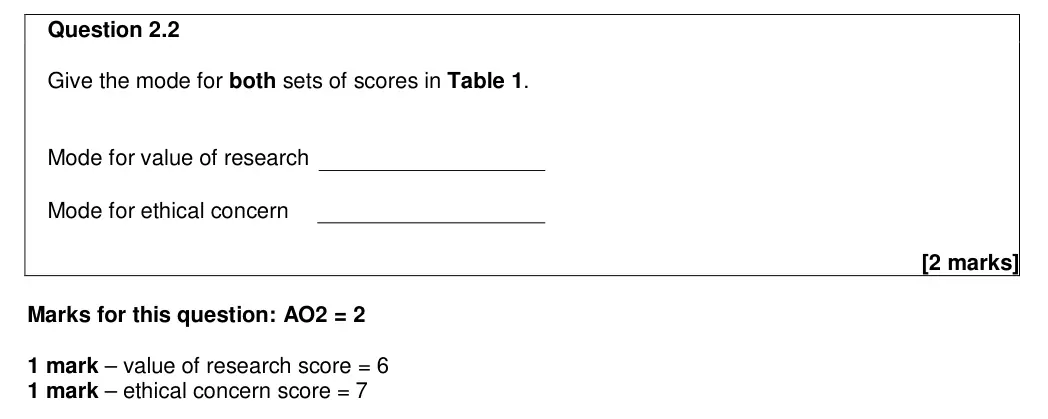
June 2016 · AS Paper 1 · Q2.2 2 marks AO2=2 Calculation data handling
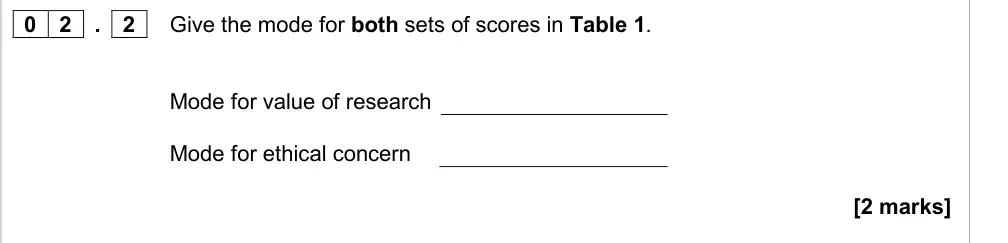
0 2 . 2
Give the mode for both sets of scores in Table 1.
Mode for value of research
Mode for ethical concern
[2 marks]
Specimen set 2 · Paper 1 · Q13 2 marks AO2=2 Calculation inferential testing
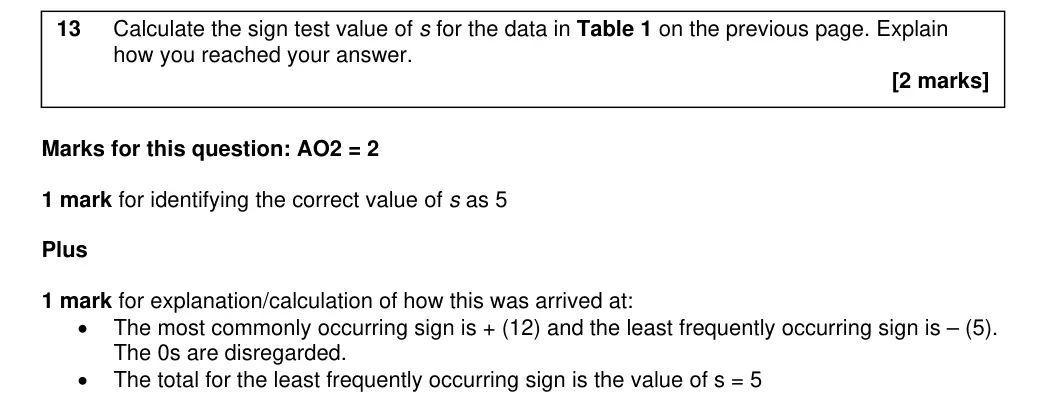
1 3
Calculate the sign test value of s for the data in Table 1 on the previous page. Explain
how you reached your answer.
[2 marks]
Specimen set 2 · Paper 2 · Q18 4 marks AO2=4 Calculation data handling
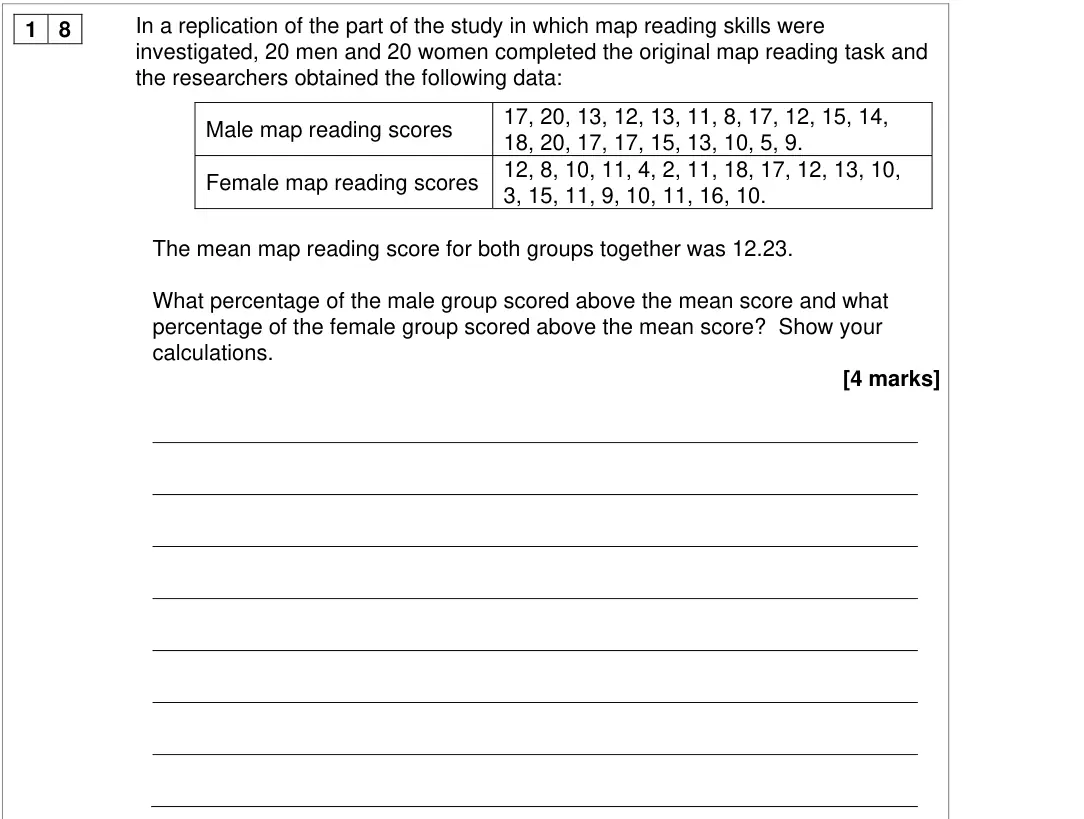
1 8
In a replication of the part of the study in which map reading skills were
investigated, 20 men and 20 women completed the original map reading task and
the researchers obtained the following data:
17, 20, 13, 12, 13, 11, 8, 17, 12, 15, 14,
Male map reading scores
18, 20, 17, 17, 15, 13, 10, 5, 9.
12, 8, 10, 11, 4, 2, 11, 18, 17, 12, 13, 10,
Female map reading scores
3, 15, 11, 9, 10, 11, 16, 10.
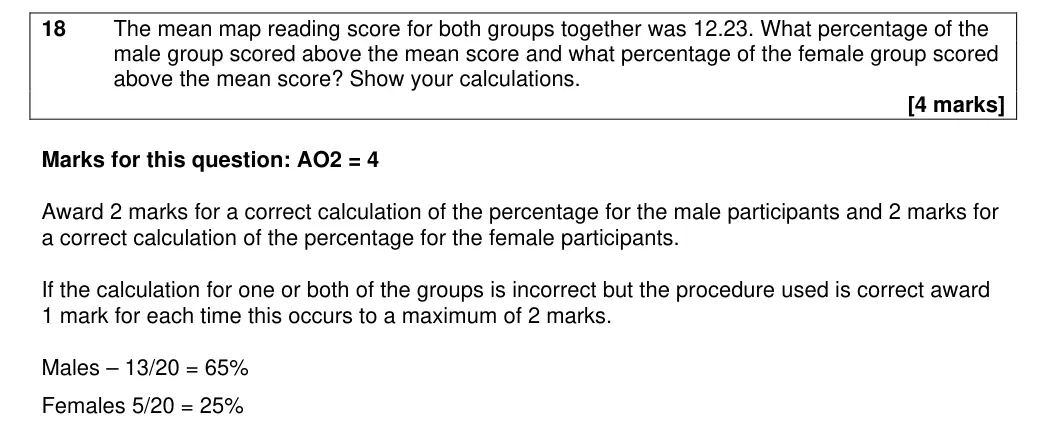
The mean map reading score for both groups together was 12.23.
What percentage of the male group scored above the mean score and what
percentage of the female group scored above the mean score?  Show your
calculations.
[4 marks]
Specimen set 2 · Paper 3 · Q30 4 marks AO2=4 Calculation data handling
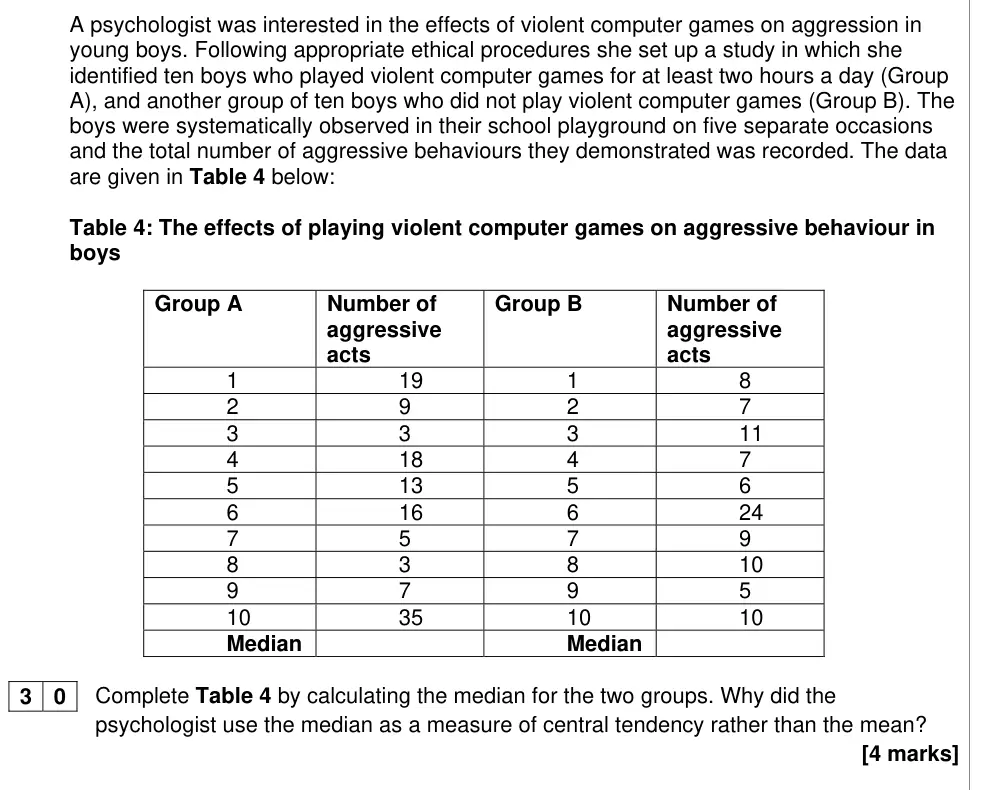
A psychologist was interested in the effects of violent computer games on aggression in
young boys. Following appropriate ethical procedures she set up a study in which she
identified ten boys who played violent computer games for at least two hours a day (Group
A), and another group of ten boys who did not play violent computer games (Group B). The
boys were systematically observed in their school playground on five separate occasions
and the total number of aggressive behaviours they demonstrated was recorded. The data
are given in Table 4 below:
Table 4: The effects of playing violent computer games on aggressive behaviour in
boys
Group A
Number of
Group B
Number of
aggressive
aggressive
acts
acts
1
19
1
8
2
9
2
7
3
3
3
11
4
18
4
7
5
13
5
6
6
16
6
24
7
5
7
9
8
3
8
10
9
7
9
5
10
35
10
10
Median
Median
3 0
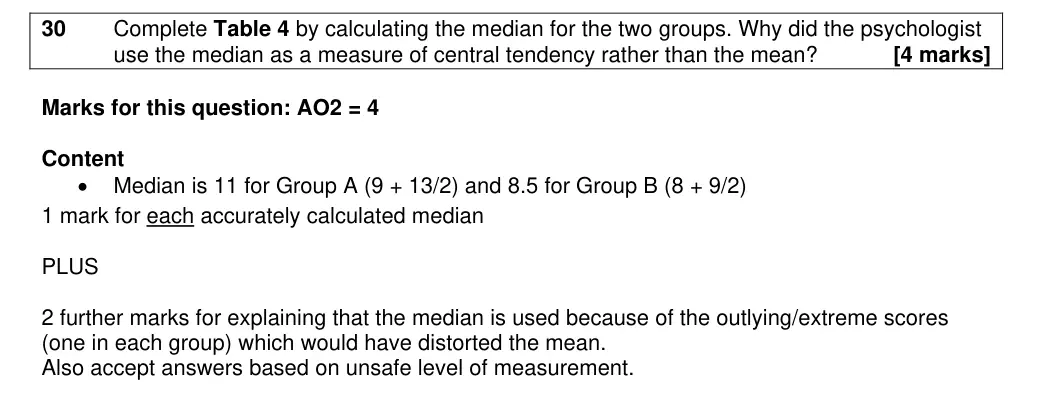
Complete Table 4 by calculating the median for the two groups. Why did the
psychologist use the median as a measure of central tendency rather than the mean?
[4 marks]
Specimen set 2 · Paper 3 · Q35 4 marks AO2=4 Calculation data handling
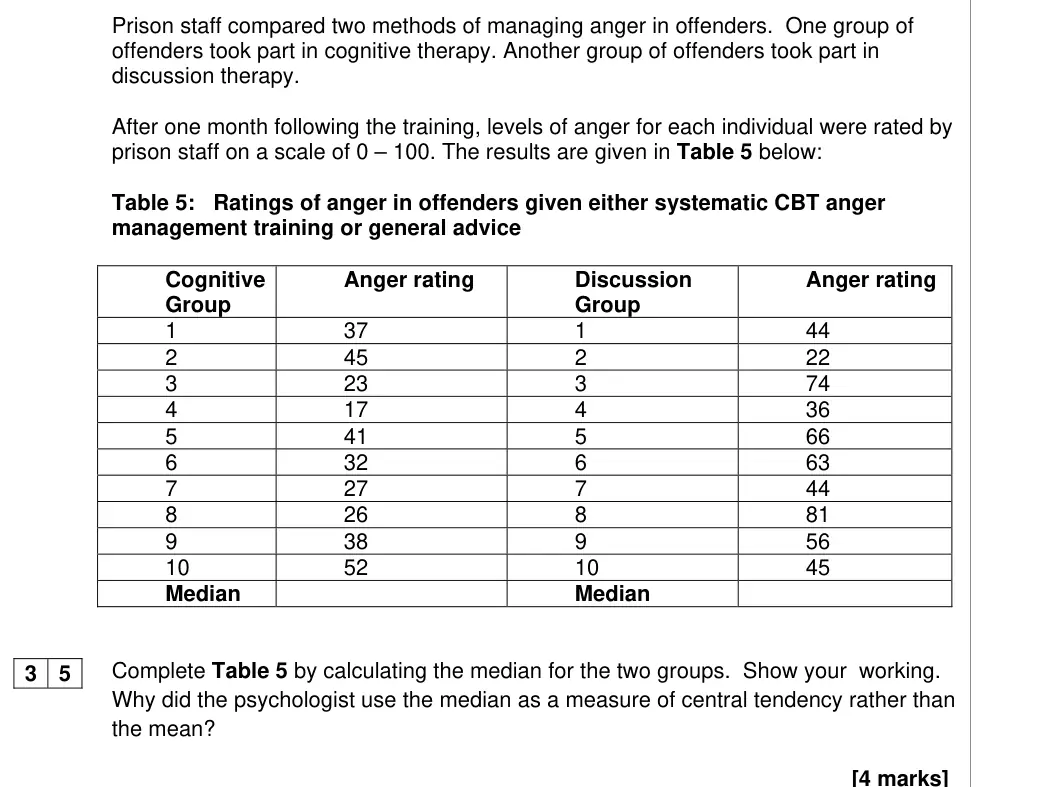
Prison staff compared two methods of managing anger in offenders.  One group of
offenders took part in cognitive therapy. Another group of offenders took part in
discussion therapy.
After one month following the training, levels of anger for each individual were rated by
prison staff on a scale of 0 – 100. The results are given in Table 5 below:
Table 5:   Ratings of anger in offenders given either systematic CBT anger
management training or general advice
Cognitive
Anger rating
Discussion
Anger rating
Group
Group
1
37
1
44
2
45
2
22
3
23
3
74
4
17
4
36
5
41
5
66
6
32
6
63
7
27
7
44
8
26
8
81
9
38
9
56
10
52
10
45
Median
Median
3 5
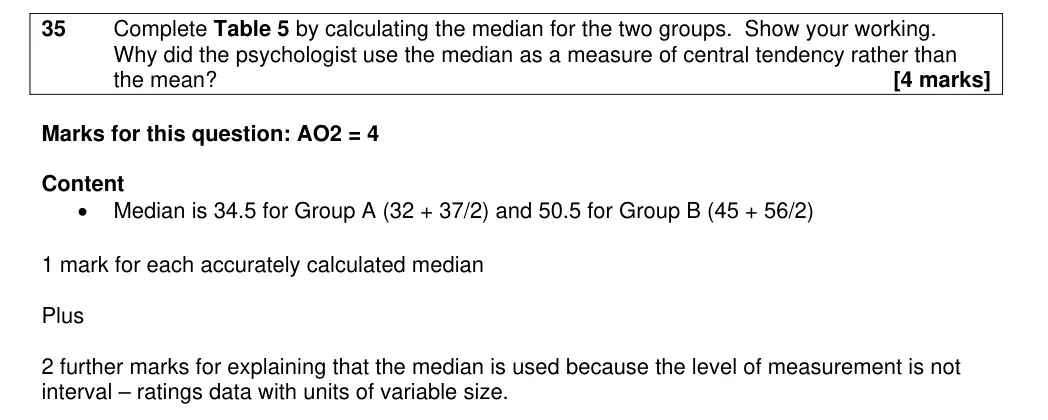
Complete Table 5 by calculating the median for the two groups.  Show your  working.
Why did the psychologist use the median as a measure of central tendency rather than
the mean?
[4 marks]
Specimen set 2 · Paper 3 · Q39 4 marks AO2=4 Calculation data handling
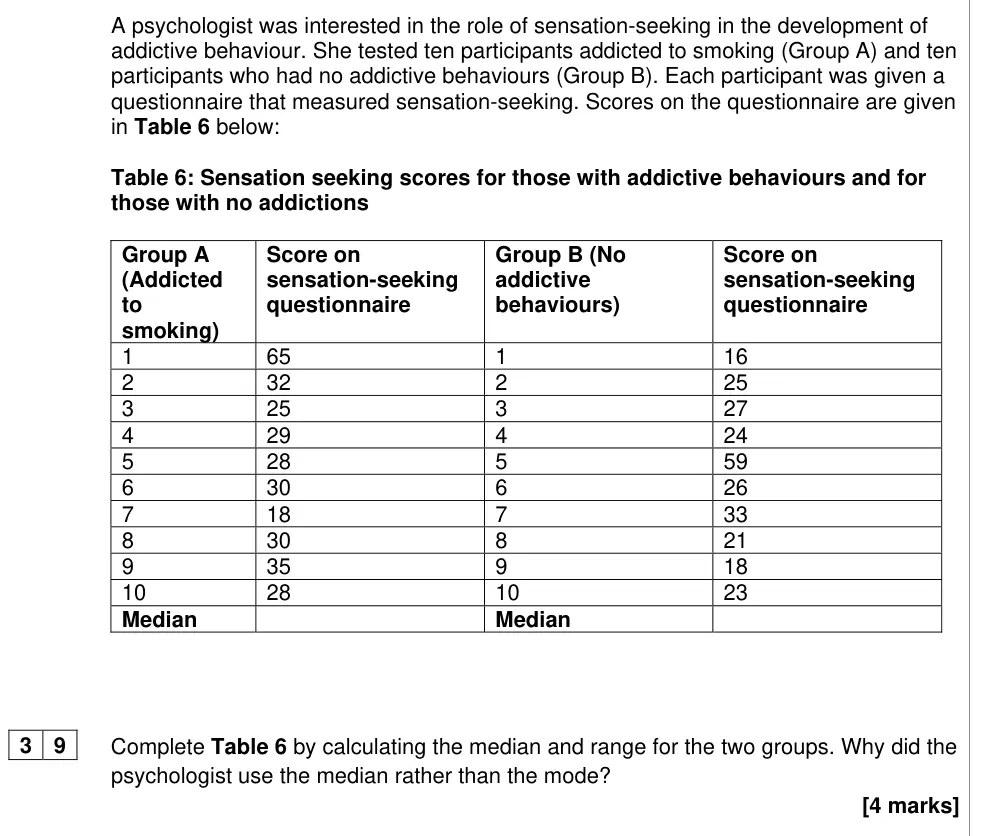
A psychologist was interested in the role of sensation-seeking in the development of
addictive behaviour. She tested ten participants addicted to smoking (Group A) and ten
participants who had no addictive behaviours (Group B). Each participant was given a
questionnaire that measured sensation-seeking. Scores on the questionnaire are given
in Table 6 below:
Table 6: Sensation seeking scores for those with addictive behaviours and for
those with no addictions
Group A
Score on
Group B (No
Score on
(Addicted
sensation-seeking
addictive
sensation-seeking
to
questionnaire
behaviours)
questionnaire
smoking)
1
65
1
16
2
32
2
25
3
25
3
27
4
29
4
24
5
28
5
59
6
30
6
26
7
18
7
33
8
30
8
21
9
35
9
18
10
28
10
23
Median
Median
3 9
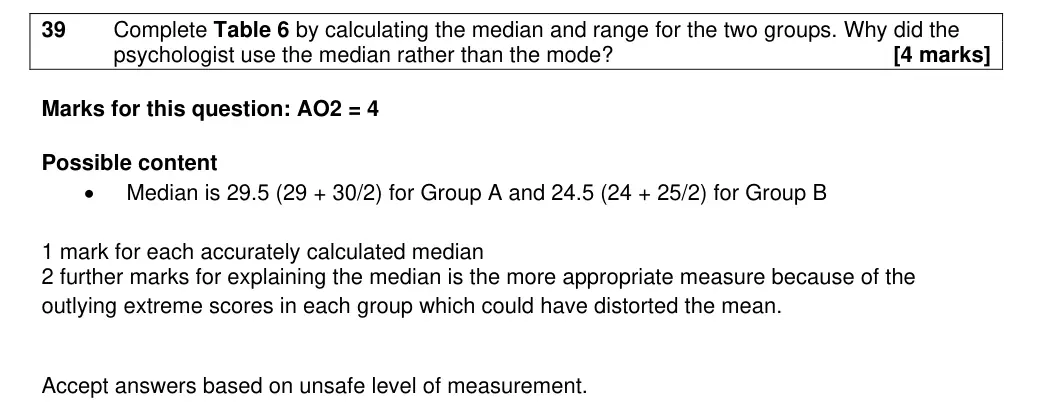
Complete Table 6 by calculating the median and range for the two groups. Why did the
psychologist use the median rather than the mode?
[4 marks]
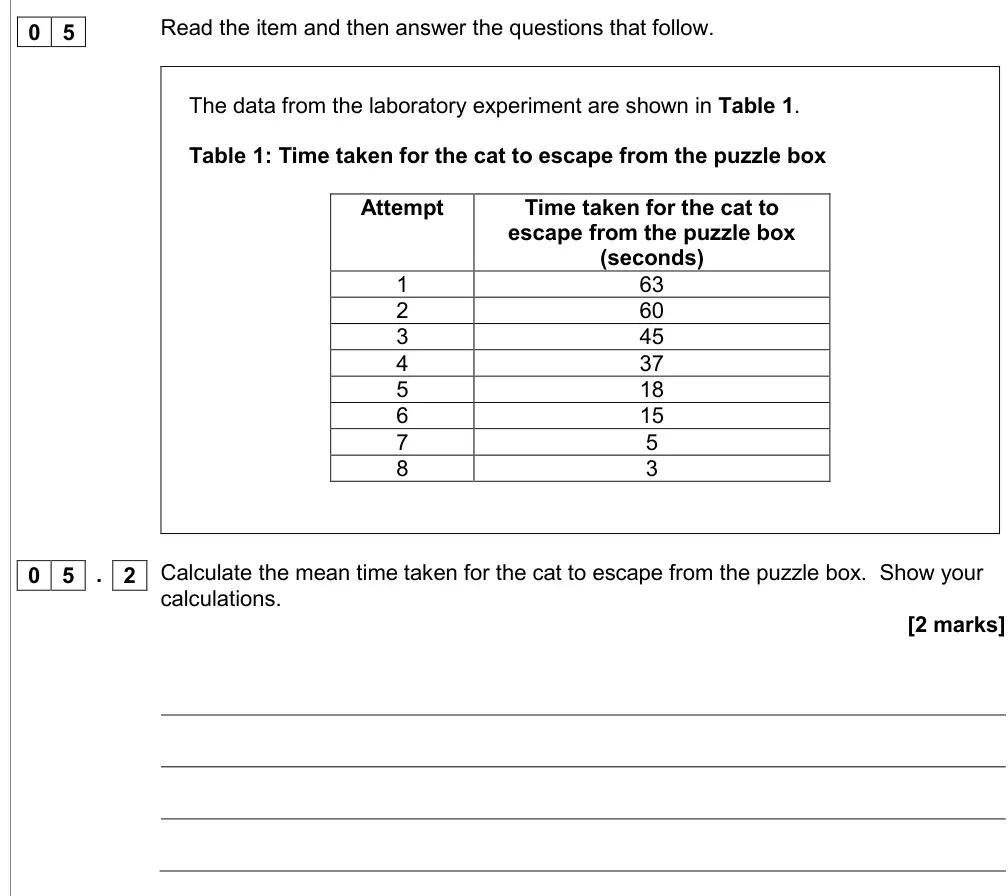
Specimen set 1 · AS Paper 2 · Q5.2 2 marks AO2=2 Calculation data handling
0 5
Read the item and then answer the questions that follow.
The data from the laboratory experiment are shown in Table 1.
Table 1: Time taken for the cat to escape from the puzzle box
Attempt
Time taken for the cat to
escape from the puzzle box
(seconds)
1
63
2
60
3
45
4
37
5
18
6
15
7
5
8
3
0 5 . 2
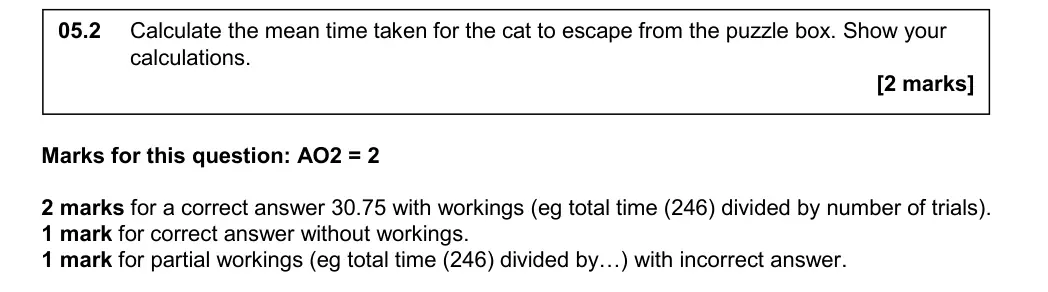
Calculate the mean time taken for the cat to escape from the puzzle box.  Show your
calculations.
[2 marks]
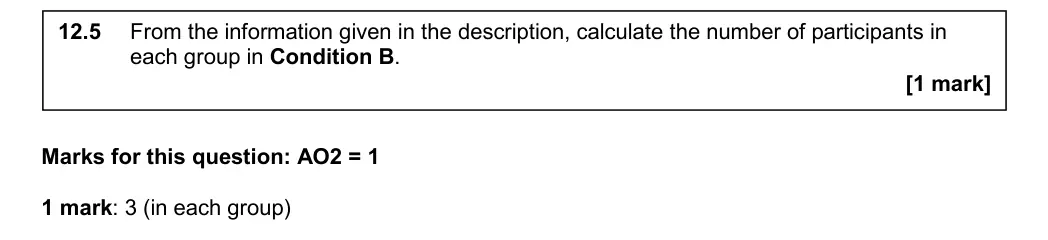
Specimen set 1 · AS Paper 2 · Q12.5 1 mark AO2=1 Calculation data handling
1 2 . 5
From the information given in the description, calculate the number of participants in
each group in Condition B.
[1 mark]
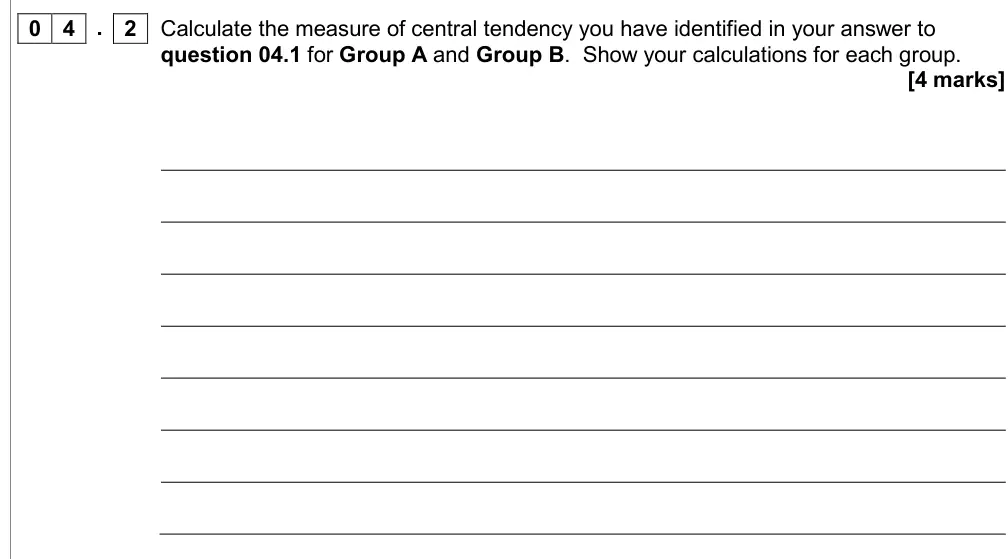
Specimen set 1 · Paper 1 · Q4.2 4 marks AO2=4 Calculation data handling
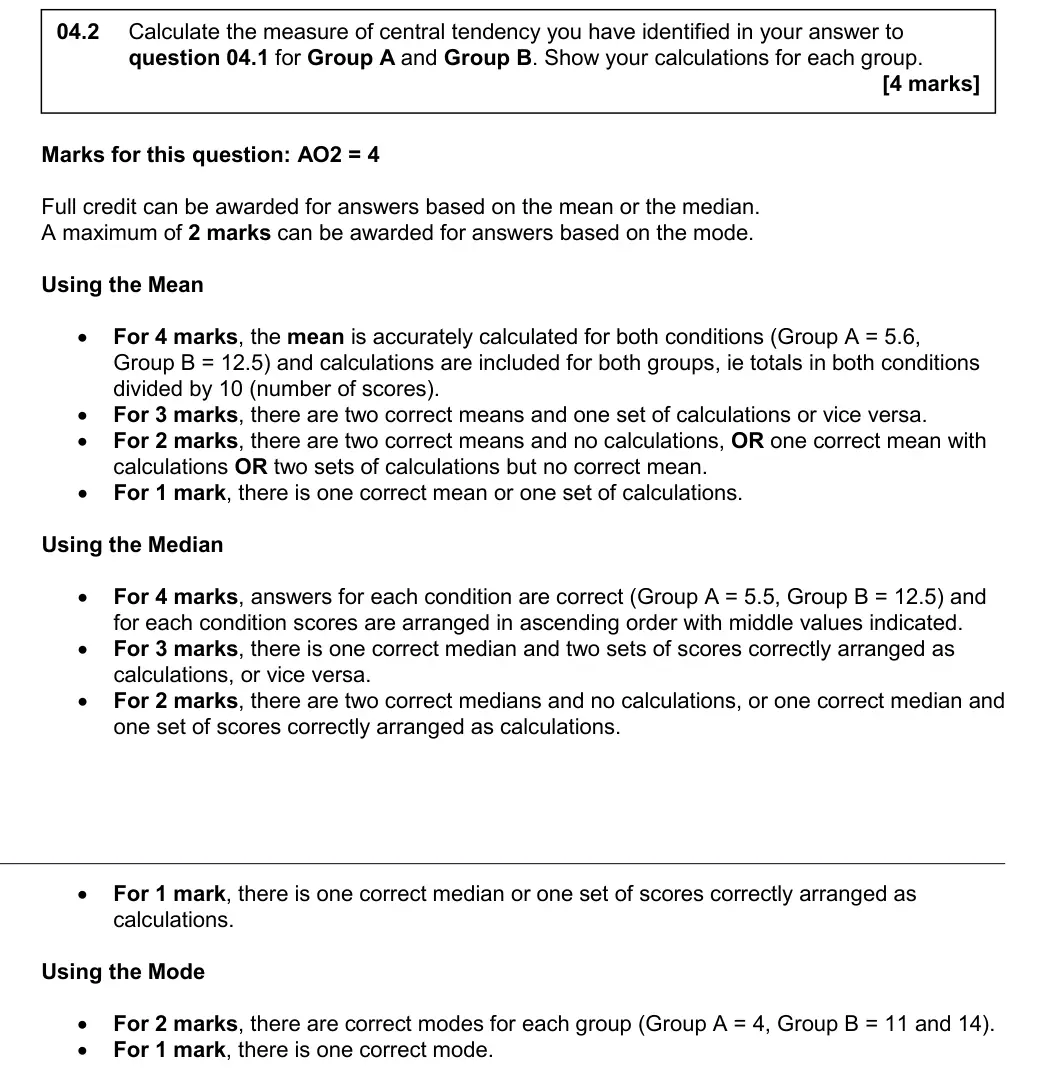
0 4 . 2
Calculate the measure of central tendency you have identified in your answer to
question 04.1 for Group A and Group B.  Show your calculations for each group.
[4 marks]
Specimen set 1 · Paper 2 · Q16 3 marks AO2=3 Calculation scientific processes
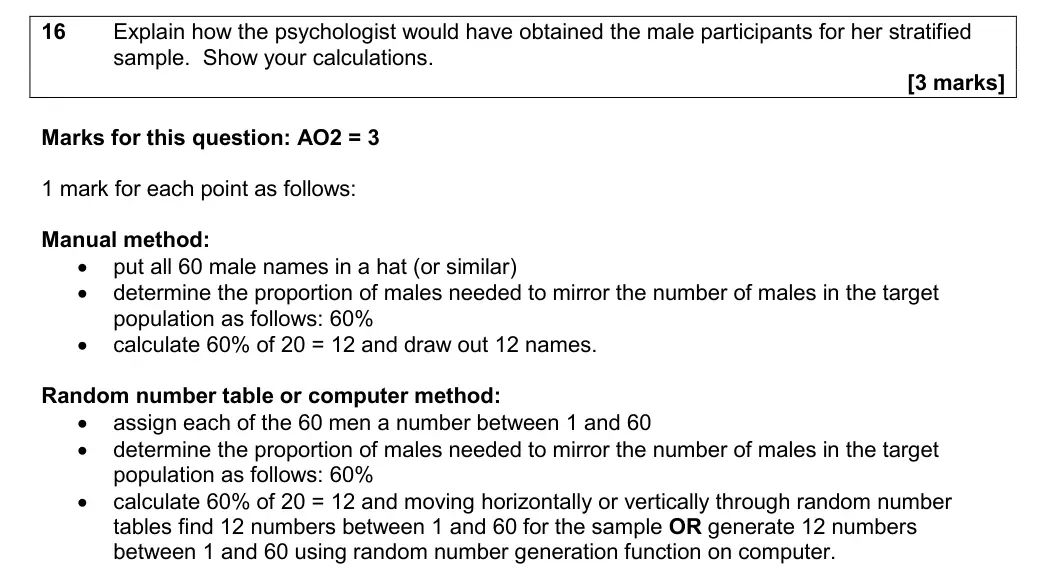
1 6
Explain how the psychologist would have obtained the male participants for her
stratified sample.  Show your calculations.
[3 marks]

Work with an AQA psychology tutor

Essays not reaching the top band? Book a session with Andy, a former AQA examiner.

Prefer email? Send an enquiry

If you are under 18, please include a parent's contact details. Enquiries go to enquiries@alevelpsychologytutor.com and are deleted once handled. All tutoring is online.