Notes, key studies and practice items for this topic are being written by our tutors. The past-paper questions below are ready now.
Specification statements
4.2.3.3-01 Introduction to statistical testing; the sign test. When to use the sign test; calculation of the sign test.AS
4.2.3.3-02 Probability and significance: use of statistical tables and critical values in interpretation of significance; Type I and Type II errors.
4.2.3.3-03 Factors affecting the choice of statistical test, including level of measurement and experimental design. When to use the following tests: Spearman’s rho, Pearson’s r, Wilcoxon, Mann-Whitney, related t-test, unrelated t-test and Chi-Squared test.
Tap a question to zoom it. Mark scheme and examiner's comment open under each question.
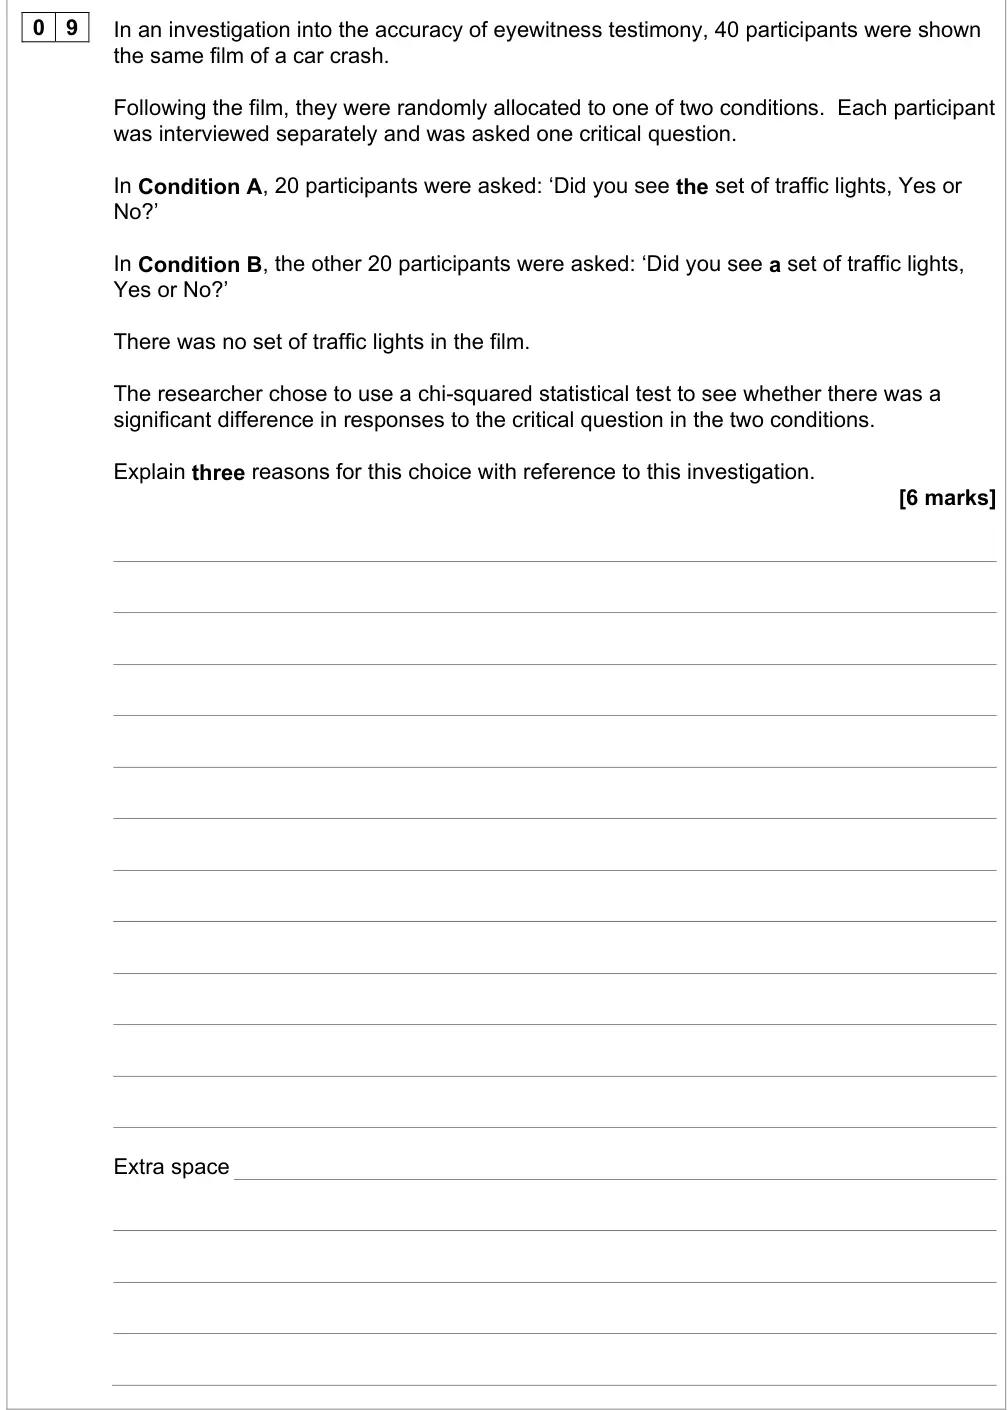
June 2025 · Paper 1 · Q96 marksAO2=6Research methodsMedium
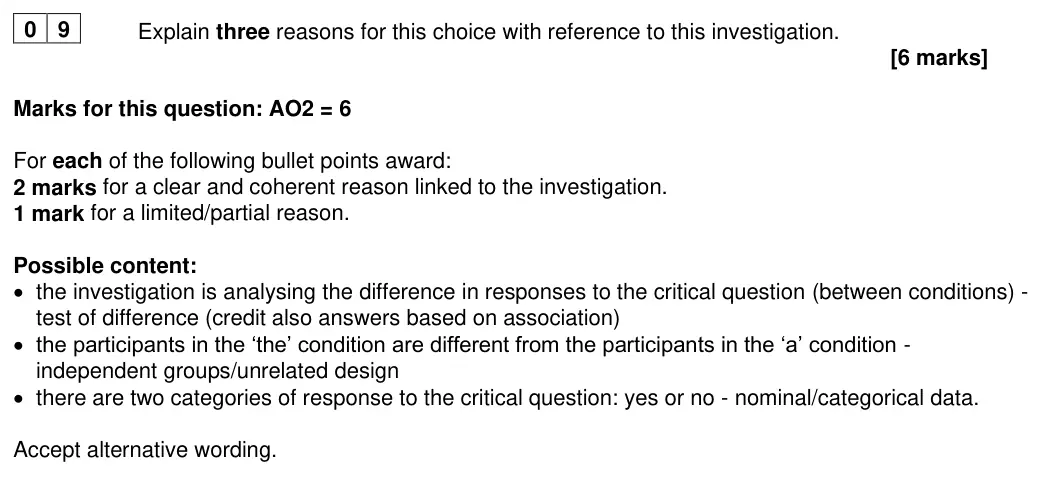
Mark scheme, including level descriptors and indicative content
Examiner's comment
In addition, students generally performed well in research methodology, for example, question 9 and question 17. The ability to justify the choice of an inferential test is seemingly getting stronger in this paper, with over 40% of students gaining 5 or 6 marks. Many students (more than 64%) were able to give at least one contextualised reason for using the chi square test. The average mark for this question was 3.78, with fewer than 9% of students scoring no marks.
Notes from the mark scheme and report
3 reasons x 2 marks linked to the study: test of difference (association accepted), independent groups ('the' vs 'a' conditions), nominal data (yes/no)
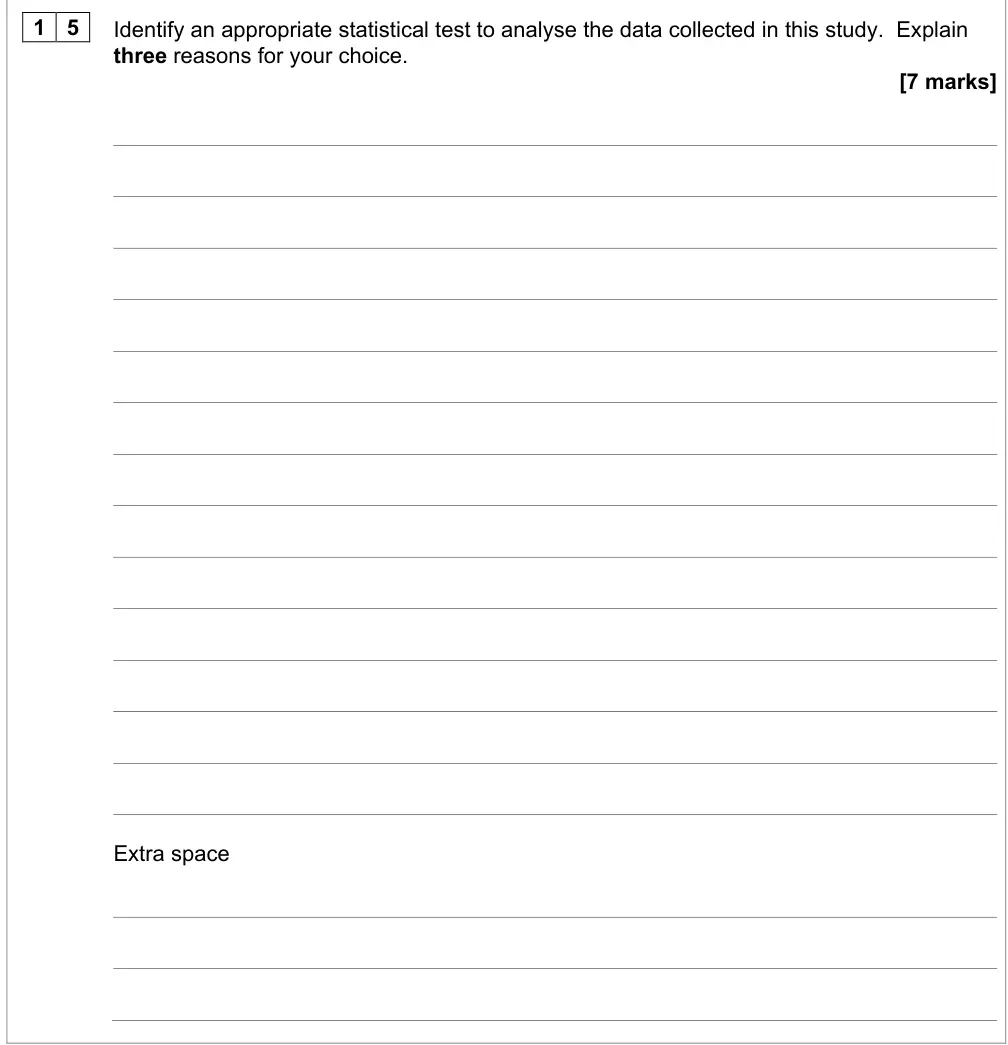
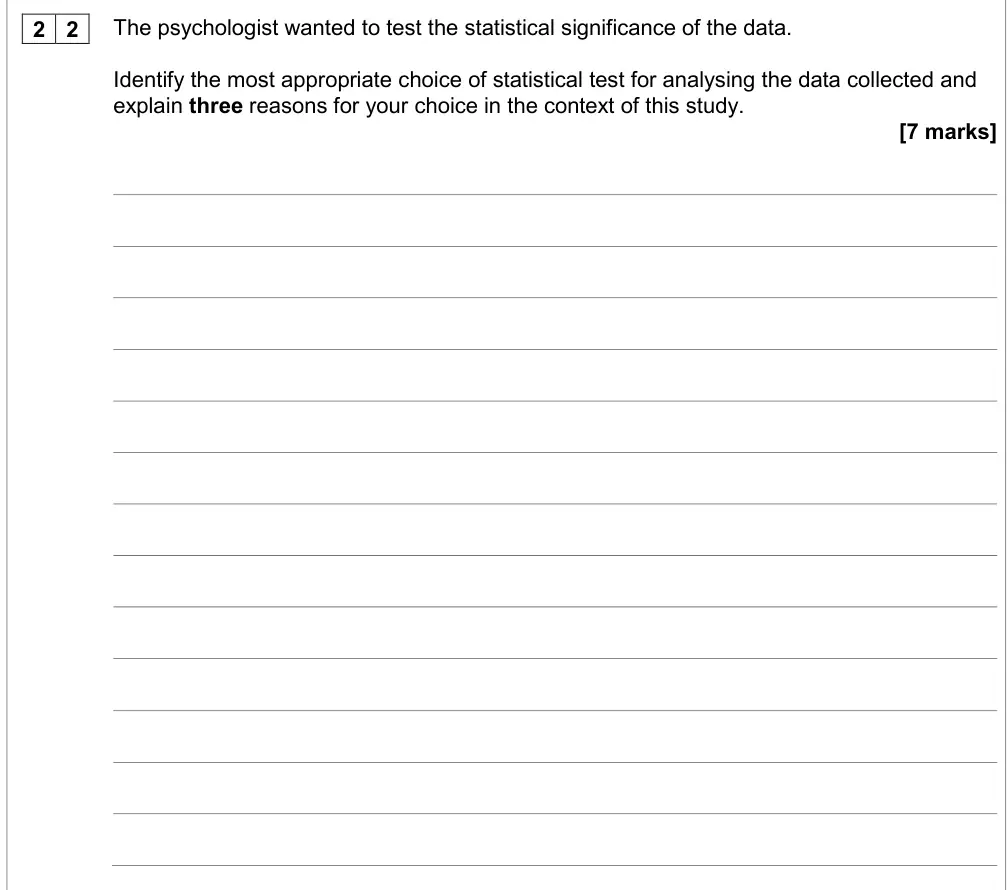
June 2025 · Paper 2 · Q157 marksAO2=7Research methods
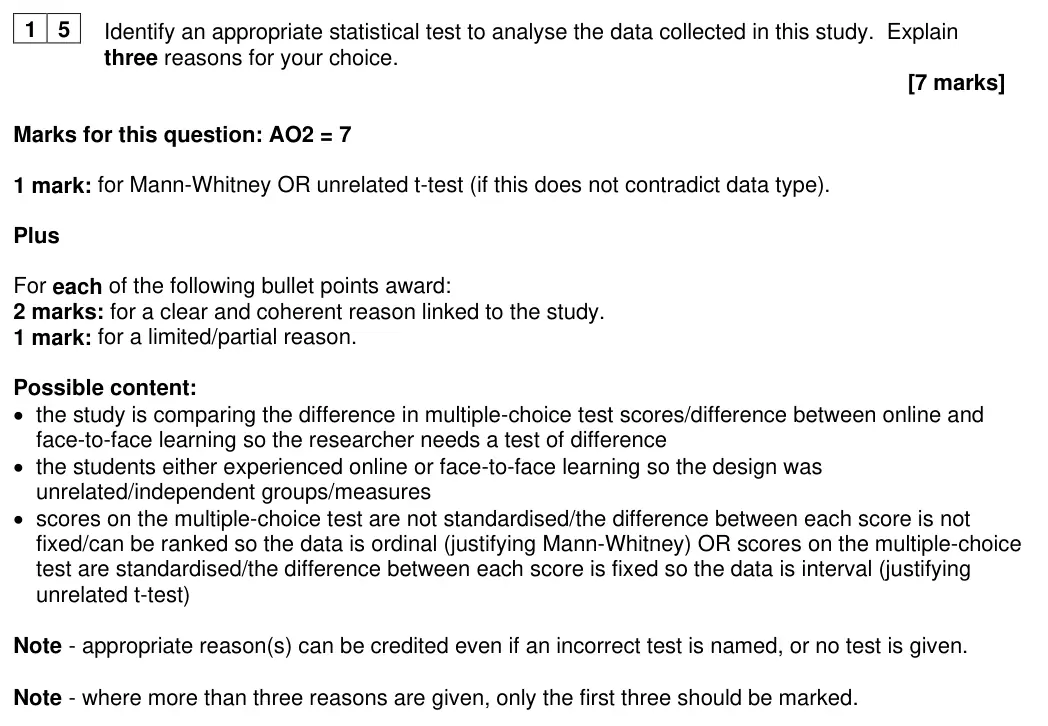
Mark scheme, including level descriptors and indicative content
Examiner's comment
This question discriminated well. Overall students demonstrated good examination technique, providing three reasons in context with a suggested statistical test. However, many responses lacked explicit reference to the study for one of the reasons, most commonly not contextualising the design. Some students gained all the available marks for the reasons but did not provide an appropriate statistical test. Appropriate statistical tests seemed fairly evenly split between Mann-Whitney and unrelated t-test with ordinal or interval data being creditworthy reasons, respectively. Some students struggled with the application element; students are reminded that they must use elements of the study to clearly justify the reason given rather than just state elements of the study. A common misconception was to identify the data as being nominal due to either having two groups of participants or due to having multiple choice answers. Students generally found it challenging to justify the type of data identified in the context of the study suggesting a lack of understanding of levels of measurement.
Notes from the mark scheme and report
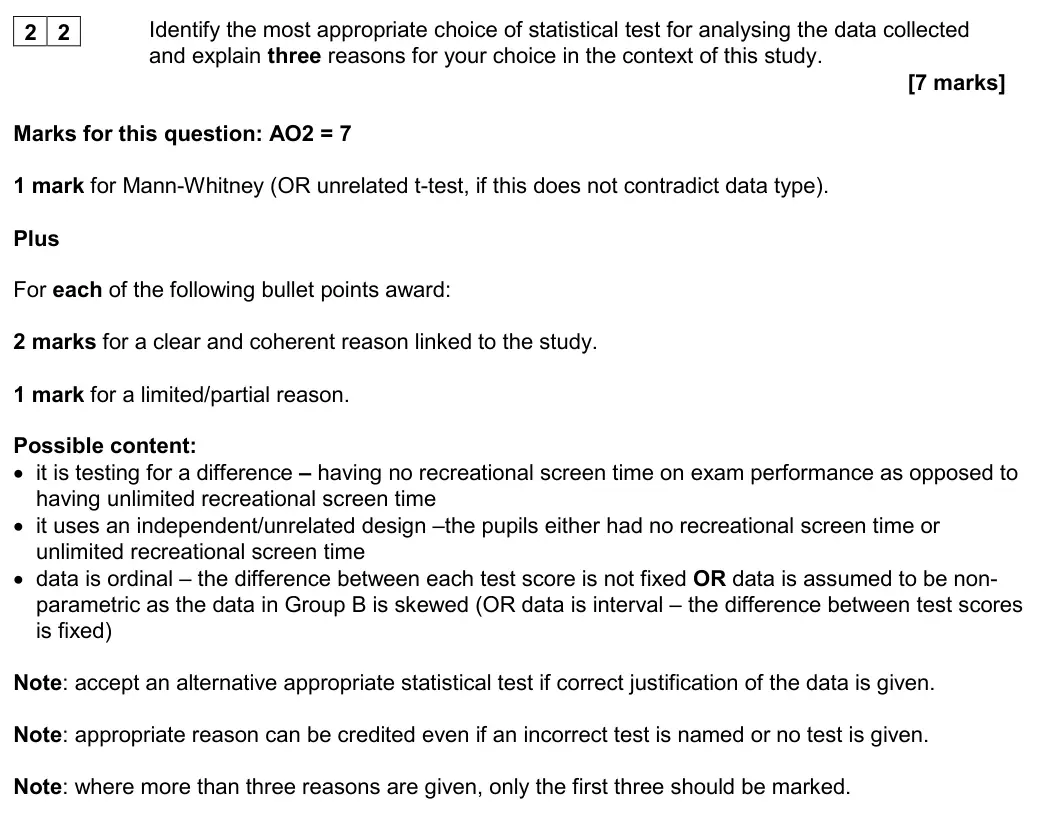
1 mark Mann-Whitney or unrelated t-test + 2 marks each for three contextualised reasons: difference, independent groups, ordinal (Mann-Whitney) or interval (t-test)
reasons creditable even if test wrong
only first three reasons marked
data often wrongly called nominal
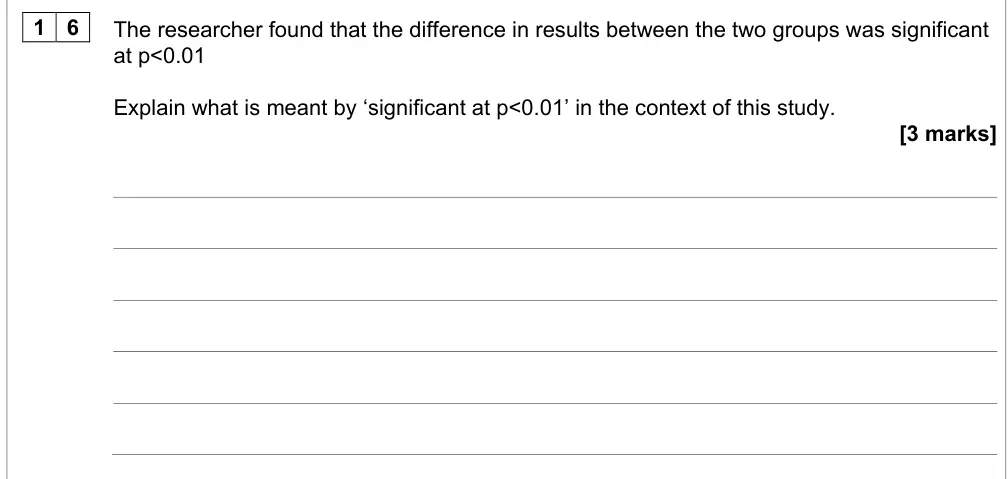
June 2025 · Paper 2 · Q163 marksAO2=3Research methods
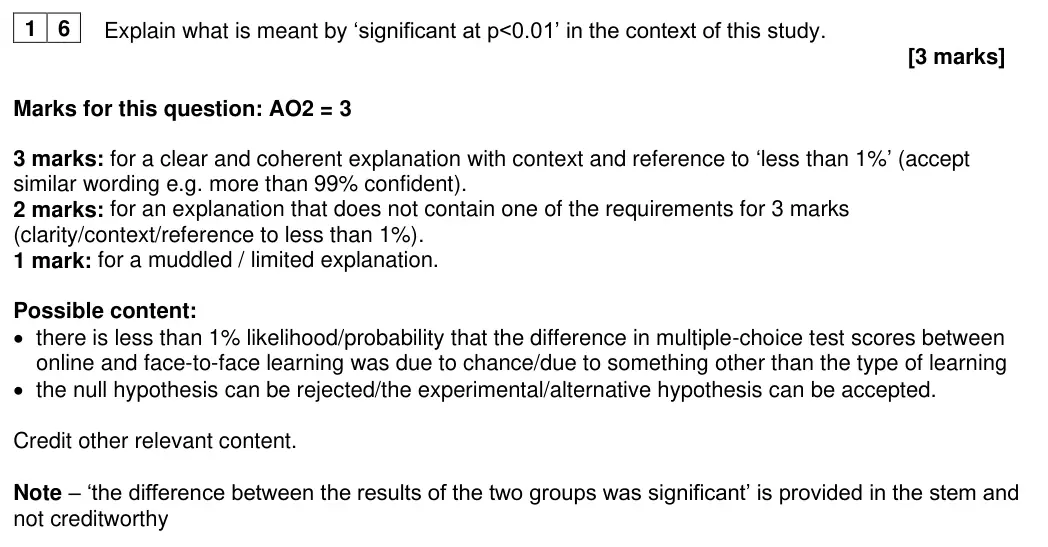
Mark scheme, including level descriptors and indicative content
Examiner's comment
Students generally seemed to have some understanding of the phrase ‘significant at p<0.01’ however, this question did not yield high marks. Many responses stated that there was a ‘1% probability of the results being due to chance’ rather than less than 1%, showing lack of understanding of the mathematical symbol ‘<’. Contextualised responses were more common than in previous series suggesting an overall improvement in examination technique. Simply stating, ‘the difference between the results of the two groups was significant,’ was not creditworthy as this was provided in the question.
Notes from the mark scheme and report
3 marks needs clarity + context + 'less than 1%' probability that difference due to chance
many wrote '1%' not 'less than 1%', misreading <
restating 'significant difference' from stem not creditworthy
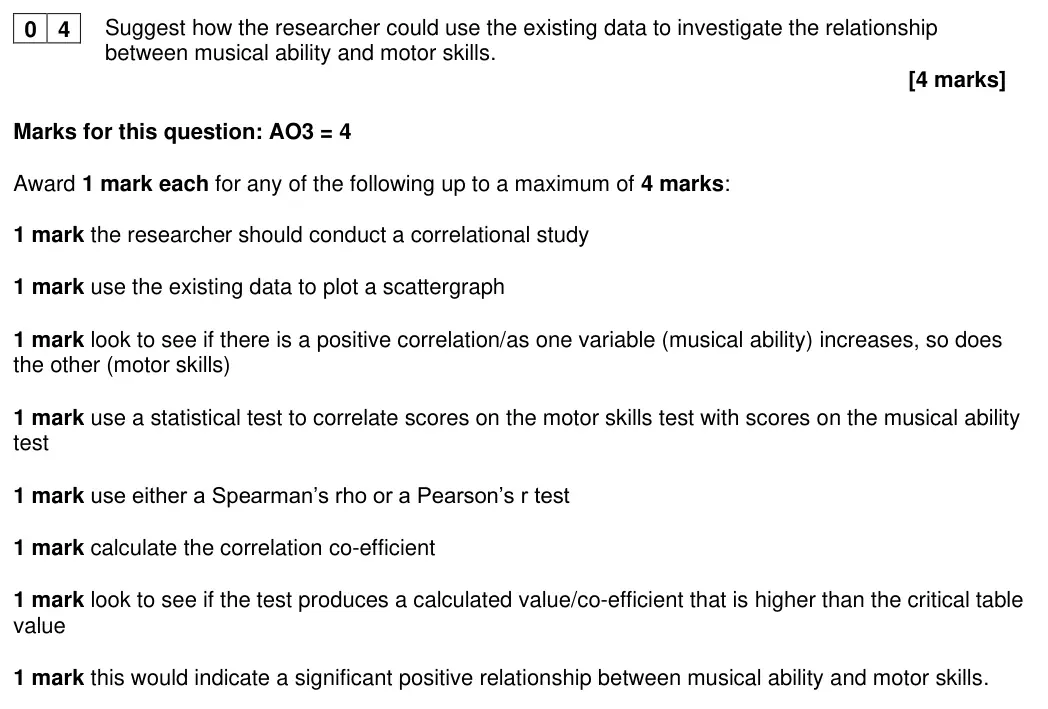
June 2025 · Paper 3 · Q44 marksAO3=4Research methods
Mark scheme, including level descriptors and indicative content
Examiner's comment
Most students were able to score at least 2 marks on question 04. Some notion that the researcher would be looking for a correlation between the two variables was the most popular route to the first mark, followed by reference to the drawing of a scattergraph. A small number of better-informed students talked of the need to calculate a correlation coefficient, and still fewer suggested the use of a statistical test of significance, for example Spearman’s.
Notes from the mark scheme and report
1 mark each up to 4: correlational analysis, plot scattergram, look for positive correlation, Spearman's rho/Pearson's r, calculate coefficient, compare with critical value, significant positive relationship
few mentioned coefficient or significance test
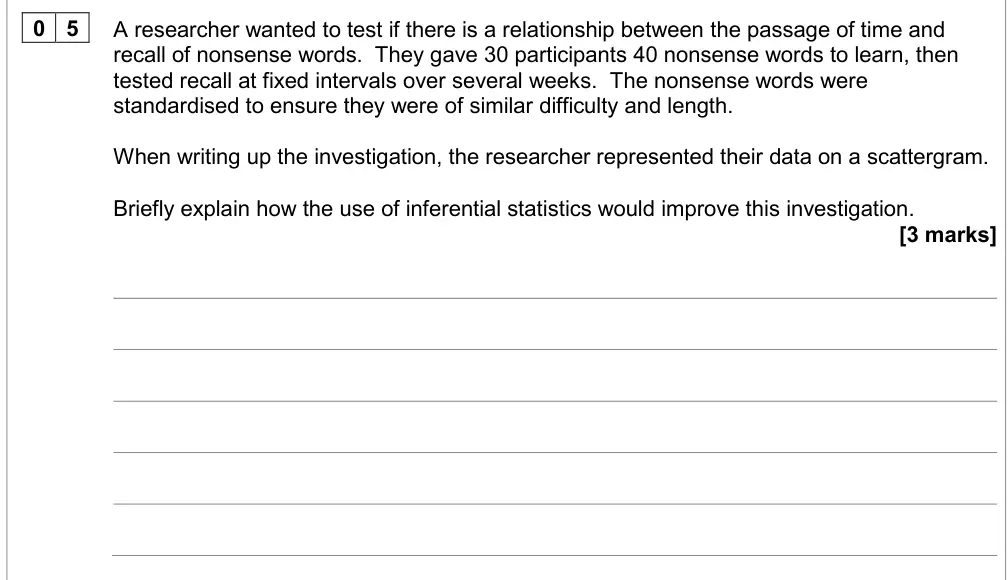
June 2024 · Paper 1 · Q53 marksAO3=3Research methods
Mark scheme, including level descriptors and indicative content
Examiner's comment
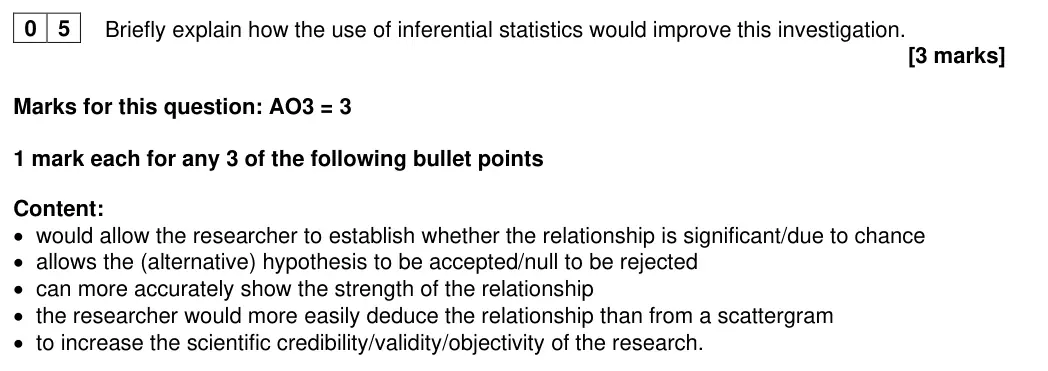
Students had difficulty in accessing marks in question B5, which questioned how the use of inferential statistics would improve an investigation. A large percentage of students failed to score marks on this question. The most frequent responses suggested inferential statistics ‘…could establish whether the relationship is significant or due to chance…’ but failed to elaborate on this. Although the mark scheme outlined multiple ways in which students could gain marks, students would be well advised to revisit this area and examine the rationale for using inferential statistics. In addition, it would be useful for students to be more familiar with the term inferential statistics to help reduce any misinterpretation. This student response was able to move beyond one mark by referring to acceptance/rejection of a hypothesis This response was generally the most common response given for this question, lacking in elaboration which has restricted the credit to just one mark With question B5 many student responses showed they did not understand what is meant by inferential statistics and would often reference different forms of descriptive statistics. Students would be well advised to revise thoroughly statistical testing and develop greater familiarity with inferential statistics.
Notes from the mark scheme and report
1 mark each: significance/chance, accept/reject hypothesis, strength of relationship, easier than scattergram, scientific credibility
many confused inferential with descriptive statistics
'significant or due to chance' often not elaborated
June 2024 · Paper 1 · Q65 marksAO3=5Research methodsMedium
Mark scheme, including level descriptors and indicative content
Examiner's comment
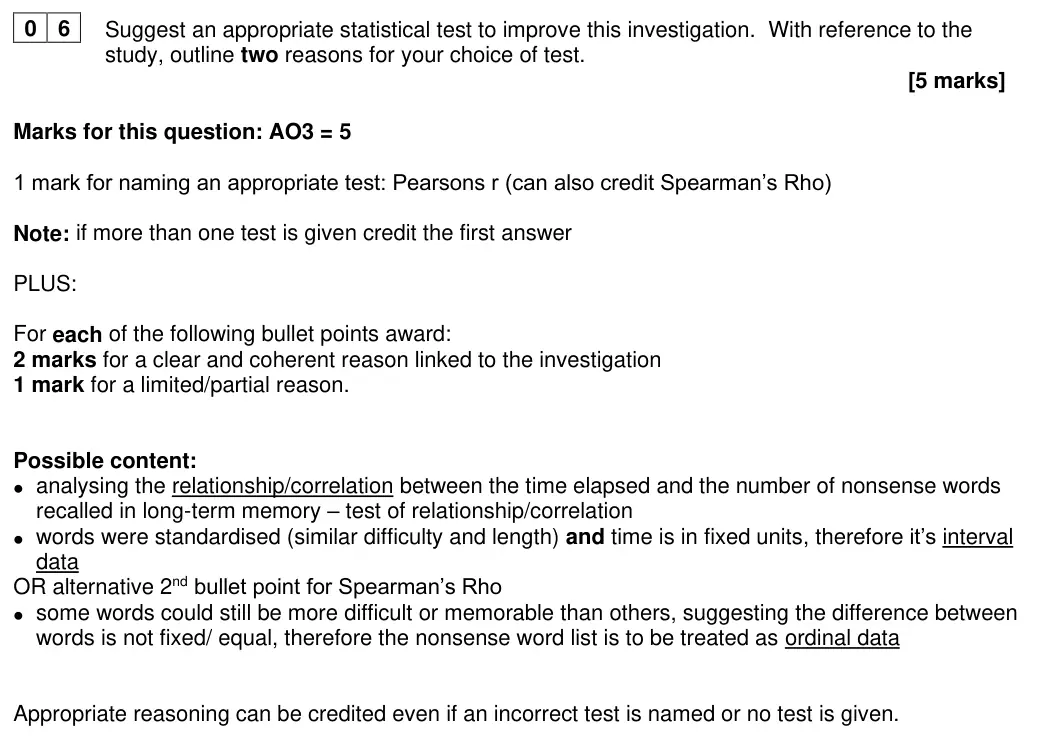
Students typically performed very well in question B6 which required students to identify an appropriate statistical test and outline two reasons for their choice. The scenario presented in the paper was a correlation, which required a test of relationship. However, the data presented could be reasonably interpreted/dealt with in two ways (at an interval or ordinal level) and as such both Spearman’s rho and Pearsons r were deemed creditworthy. However, to gain further marks the reasoning behind the choice of level of measurement needed to be clear and precise. Overall, students scored well in this question, gaining a mean of 2.5 marks, and over thirty seven percent of students gaining either 4 or 5 marks. In this strong student response, the only part missing for full marks relates to the justification of data. For Pearsons r, both variables need to be interval data, which would include time (as stated in the response), but also the standardised word list Although this response outlines the use of Spearman’s rho, the student has fully justified this in the context of the scenario presented, and worthy of full marks In question B6 a common misunderstanding was to claim that the investigation was a test of difference as opposed to a relationship and this cost them marks. Students would be well advised to revise thoroughly statistical testing and develop greater familiarity with inferential statistics.
Notes from the mark scheme and report
1 mark Pearson's r (Spearman's rho also credited
first test only) + 2 reasons x 2 marks linked to study: test of relationship, interval data (standardised words, fixed time units) or ordinal for Spearman's
reasoning credited even with wrong test
Pearson's needs both variables interval
June 2024 · Paper 2 · Q236 marksAO2=6Research methods
Mark scheme, including level descriptors and indicative content
Examiner's comment
Students appeared well prepared for this question with clear reasons provided for the choice of statistical tests being given in the context of the stem. Although the question differentiated well, the modal mark for this question was six suggesting a real improvement in performance from previous series. For those who did not score full marks on this question this tended to be due to the lack of context/link to the stem or confusion over levels of measurement and what constitutes nominal, ordinal and interval data. There was a surprising number of responses in which the rationale for independent groups design was confused and others justified interval data as being due to the duration of the observation as opposed to the actual dependent variable measured.
Notes from the mark scheme and report
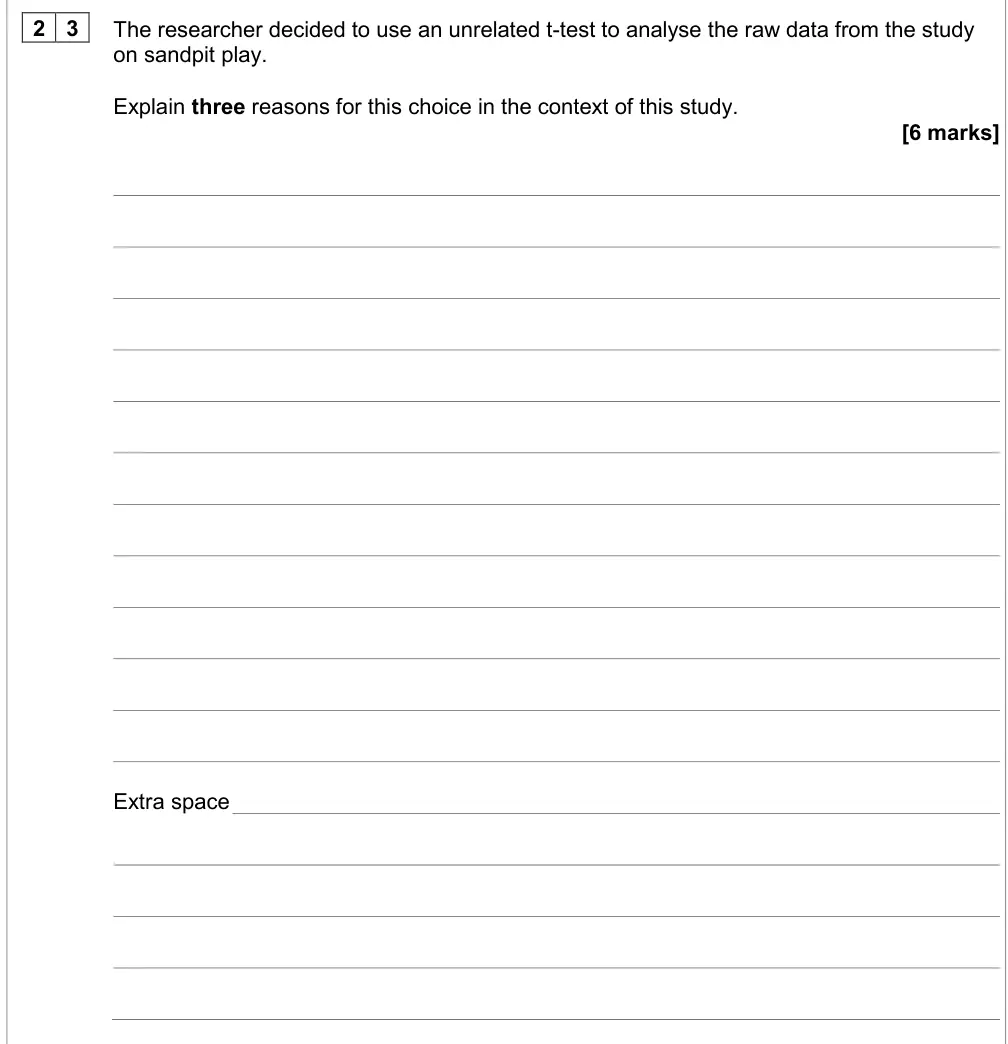
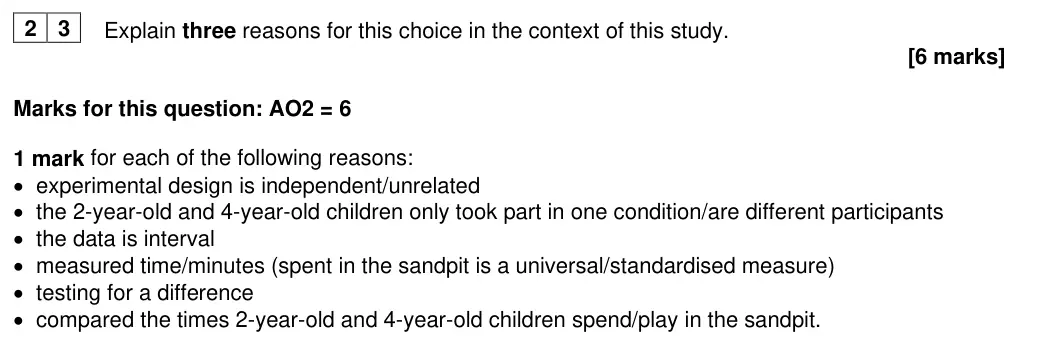
three contextualised reasons, 1 mark each point: independent groups (different children in each age group), interval data (time in minutes), test of difference
modal mark 6
interval wrongly justified by observation duration rather than the DV
June 2024 · Paper 2 · Q242 marksAO2=2Research methods
Mark scheme, including level descriptors and indicative content
Examiner's comment
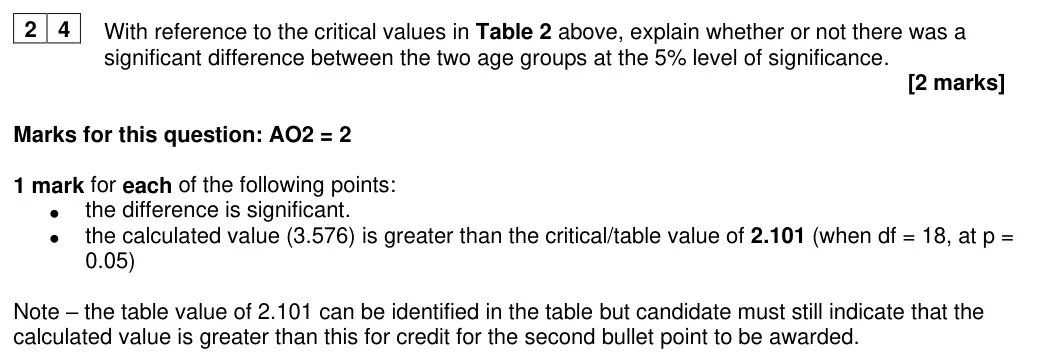
This question was generally answered well with most students achieving 2 marks. The main reason for the second mark being missed was due to not using the data from the table. Some surprising responses gave the second bullet point on the mark scheme but stated the data was not significant or confused the calculated and critical/table value. Students should take their time on these questions and read the information provided to prevent these types of errors.
Notes from the mark scheme and report
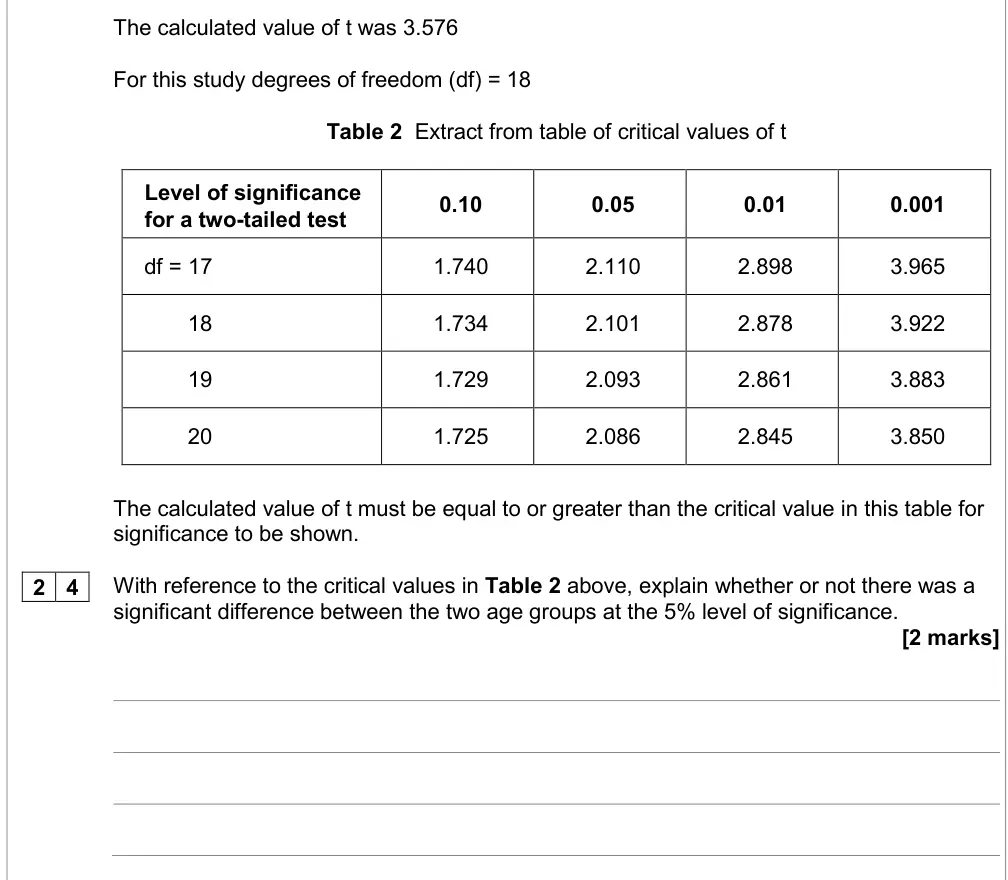
significant because 3.576 > 2.101 (df = 18, two-tailed 0.05)
must state calculated is greater than critical
confusion of calculated and critical values
June 2024 · Paper 2 · Q253 marksAO2=3Research methods
Mark scheme, including level descriptors and indicative content
Examiner's comment
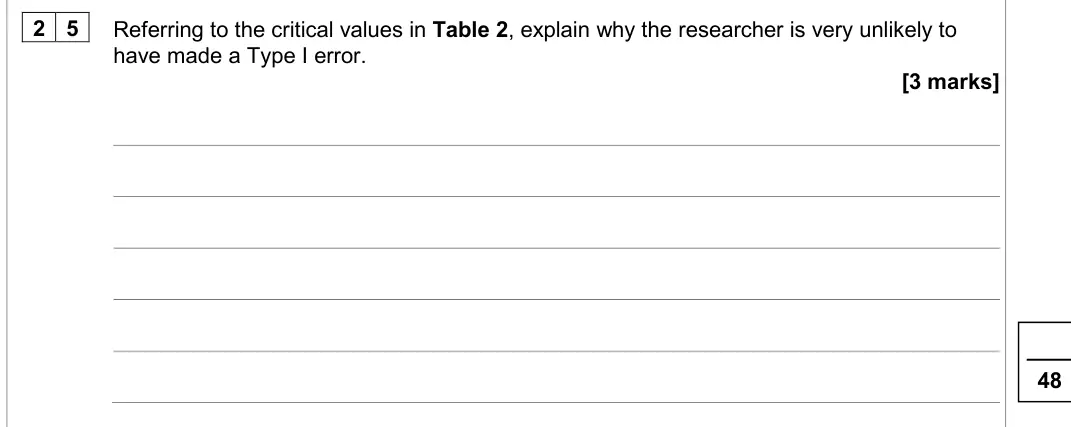
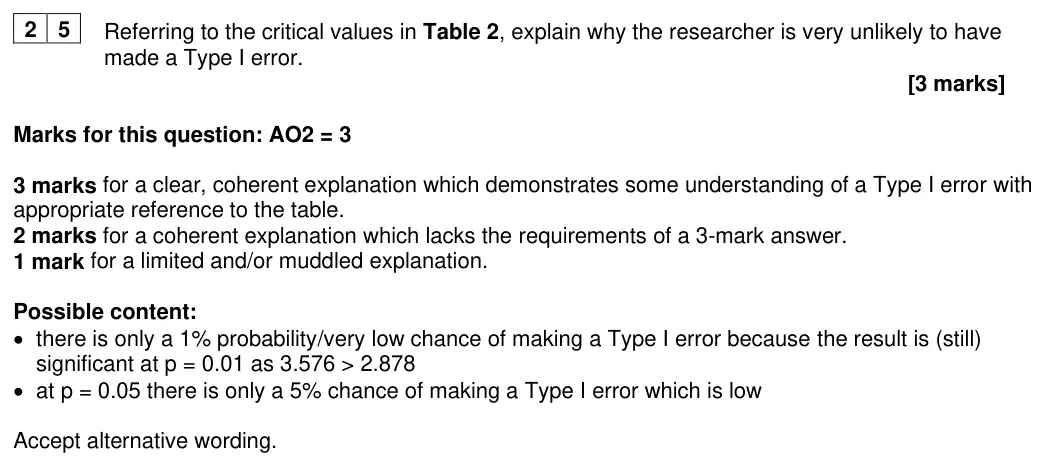
This question challenged students to show an understanding of what Type I errors are by applying their knowledge to the context given. As a consequence, it yielded a variety of responses. There were a lot of definitions of Type I errors without any application to the question which were not awarded credit. Other students gave vague references to the table which did not suggest any understanding of levels of significance, eg ‘all results are close together’ or ‘still significant even if differing degree of freedom are used.’ However, it was pleasing to see a high proportion of students who demonstrated excellent understanding and answered this question well and with the idea that the data is still significant when using a more stringent level of significance (p = 0.01) and using the critical value from the table to give a full explanation and meet all the requirements of the question. A lot of the students who did not score full marks for this question, gained credit for knowledge that p = 0.05 is the conventional level of significance that balances the chance of making a Type I and a Type II error. Responses overall suggest that some students need to practise using critical values tables and comparing these with calculated values with reference to Type I and Type II errors in a practical context, rather than merely learning definitions of these terms.
Notes from the mark scheme and report
still significant at p = 0.01 (3.576 > 2.878), so only 1% (very low) chance of a Type I error, with reference to the table
definitions without application not credited
vague table references
June 2023 · AS Paper 2 · Q104 marksAO2=4Research methodsHard
Mark scheme, including level descriptors and indicative content
Examiner's comment
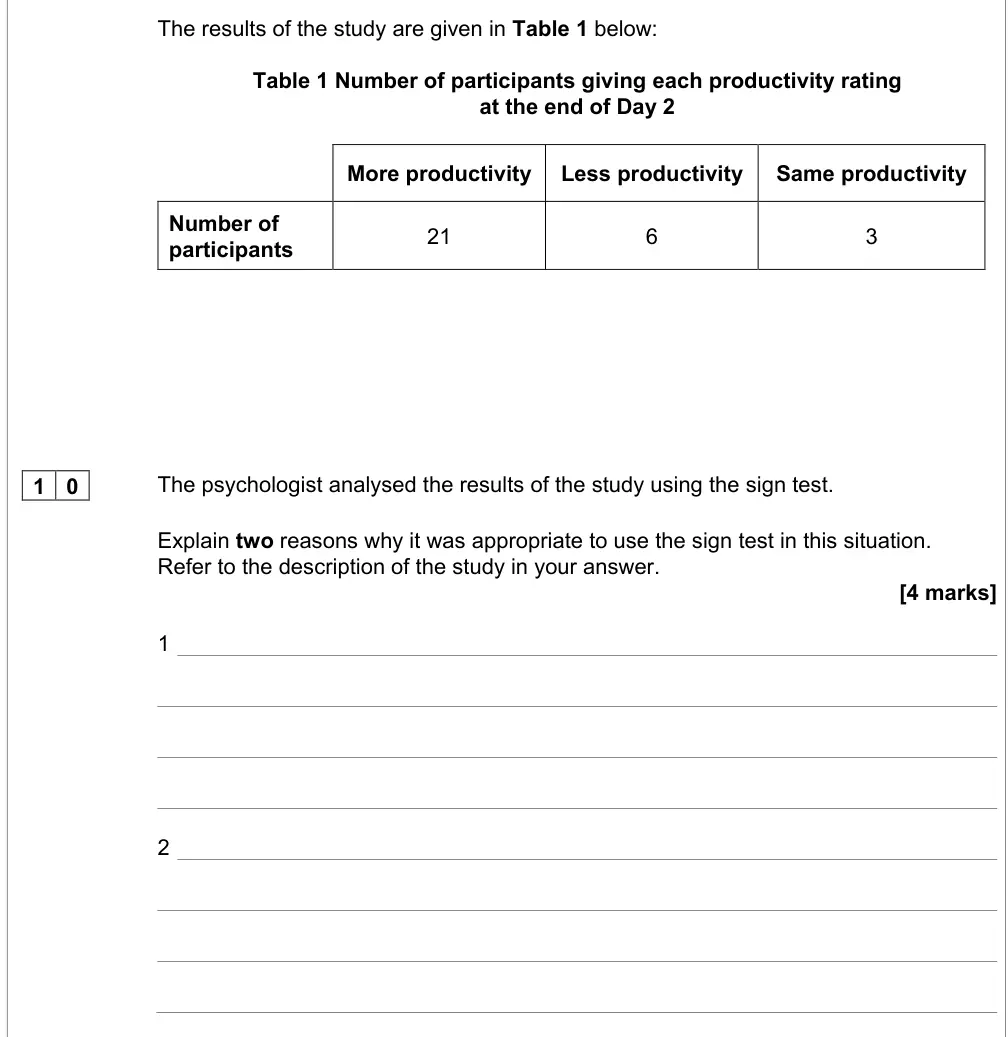
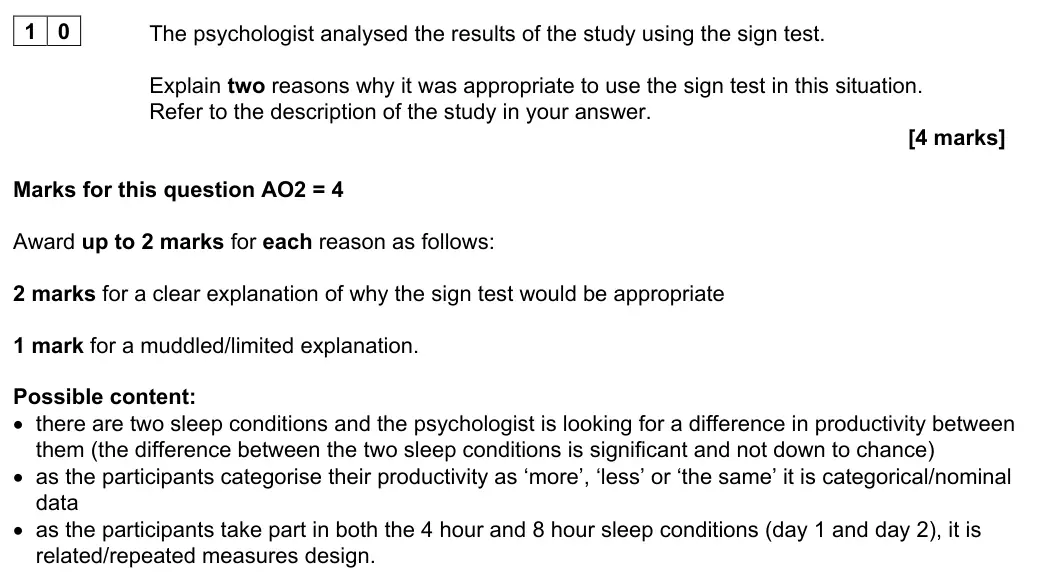
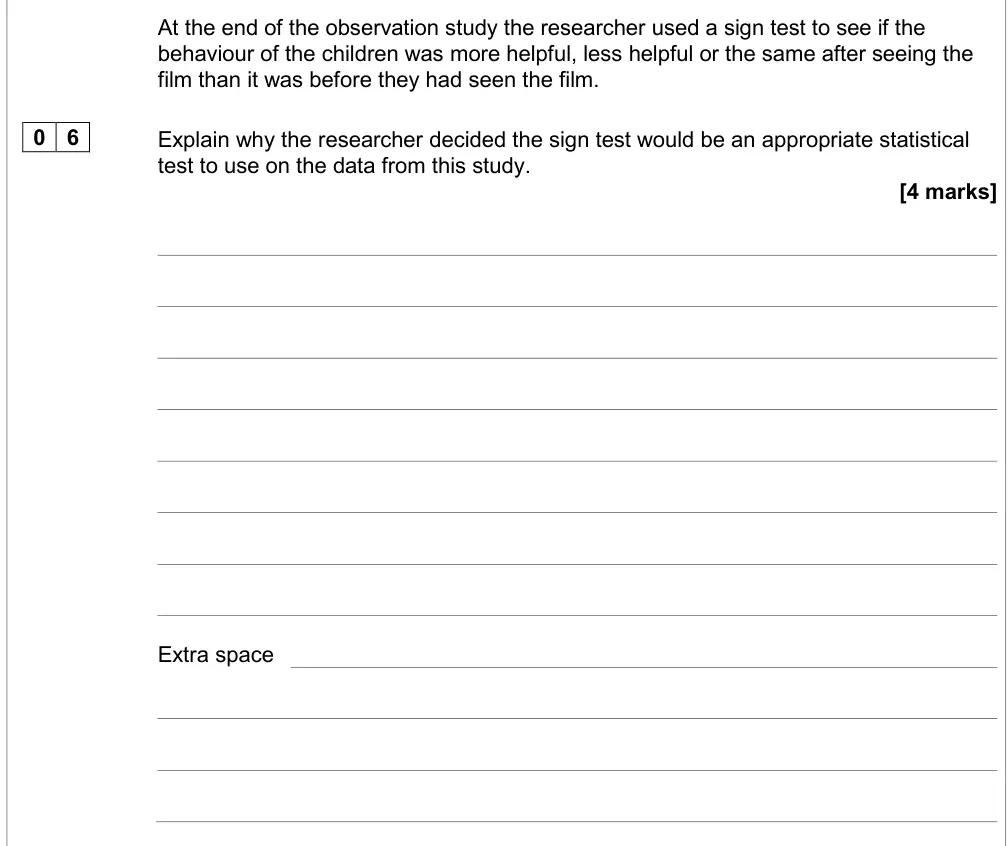
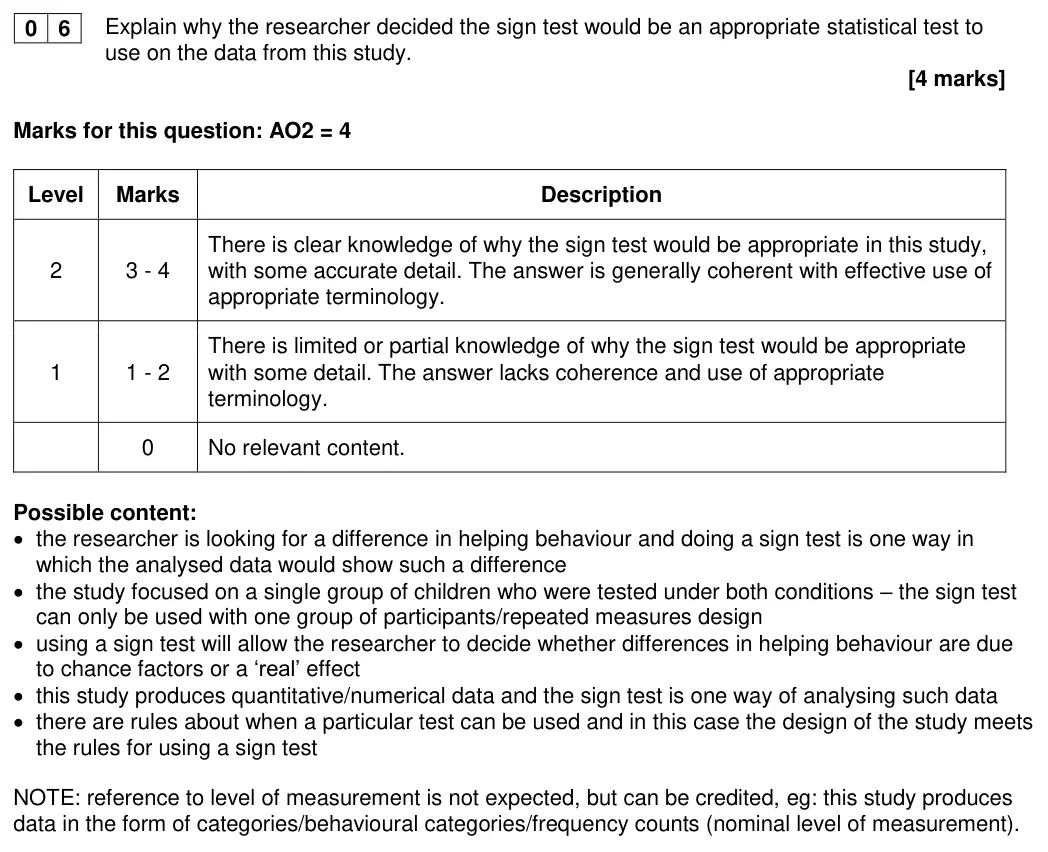
Most students appeared to have little, if any, knowledge of the sign test and thus could not access any marks on this question. The mean as a percentage of the maximum mark for this question was less than 20%. Of those who did appear to have some knowledge, some could only give one reason whilst others failed to apply their reasoning to the study. Very few students were able to give two reasons of why the sign test was appropriate to use in the study with reference to the study itself. This question appeared to demonstrate a general lack of understanding of the sign test and specifically when it should be used.
Notes from the mark scheme and report
test of difference
nominal/categorical data (more/less/same)
repeated measures/related design
must refer to the study
very poorly answered (mean under 20%)
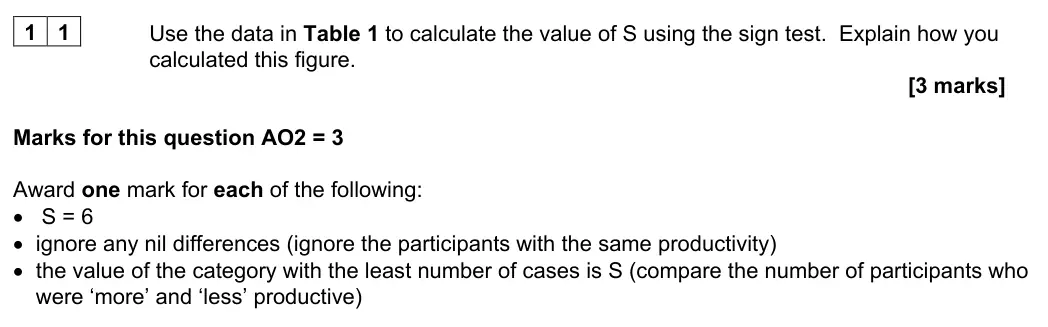
June 2023 · AS Paper 2 · Q113 marksAO2=3CalculationHard
Mark scheme, including level descriptors and indicative content
Examiner's comment
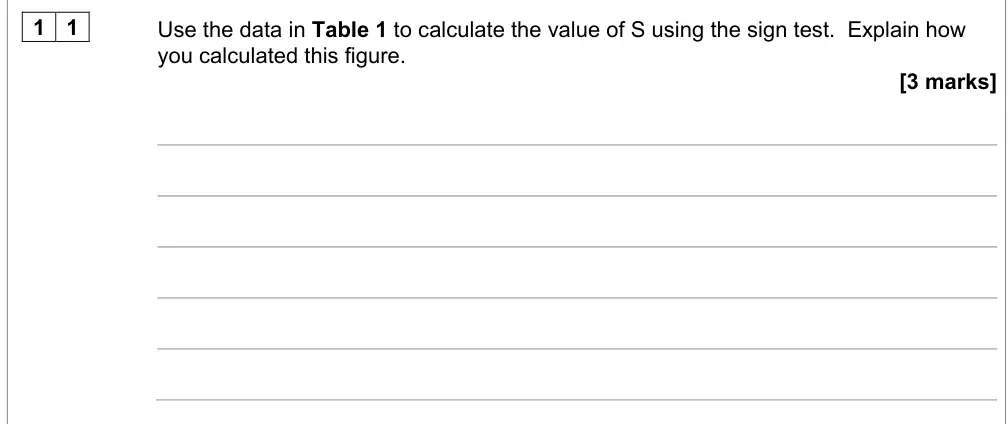
As with question 10, this question seemed to demonstrate a lack of knowledge and understanding of the sign test and specifically its calculation. Most students were awarded zero marks and appeared to have no understanding of how to calculate ‘S’. The mean as a percentage of the maximum mark for this question was around 25%. A minority were able to calculate ‘S’ correctly but only some of these students fully explained how they did so, thus many did not fully address the demands of the question. It is clear from both this question and question 10, that the sign test needs to be an area of focus for students as ‘when to use the sign test’ and ‘calculation of the sign test’ are explicit on the specification.
Notes from the mark scheme and report
S = 6
ignore the 3 'same' (nil differences)
S = the less frequent sign
most scored 0
many calculated S without explaining
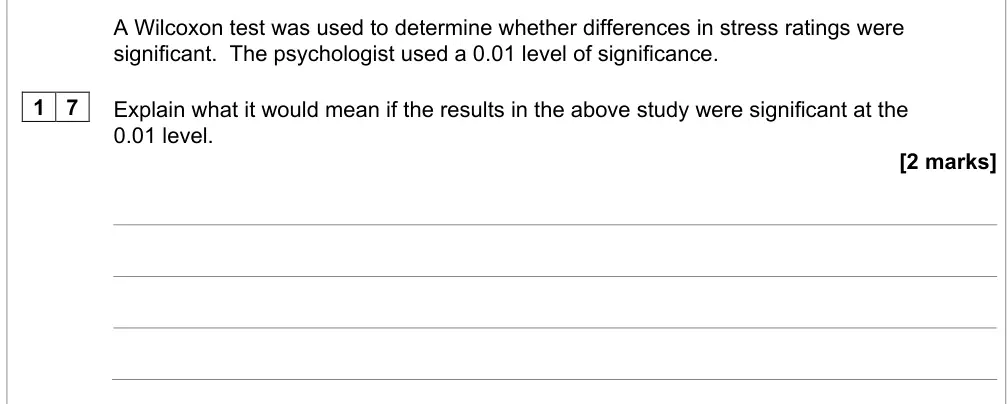
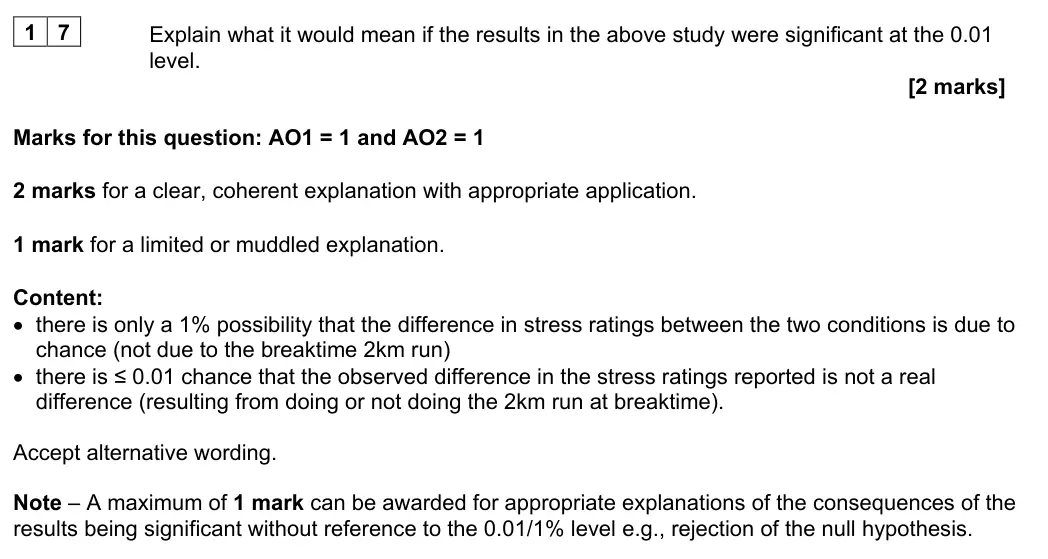
June 2023 · Paper 2 · Q172 marksAO1=1, AO2=1Research methods
Mark scheme, including level descriptors and indicative content
Examiner's comment
This question produced a mixed response. Most students knew that being significant at the 0.01 level would mean only 1% possibility that the results were due to chance, but many did not apply their answers to the study. Some responses did not engage with the 0.01 aspect of the question and therefore could only achieve one mark for explaining the consequences of being significant, such as rejection of the null hypothesis. A common error was to suggest that being significant at the 0.01 level would mean that one could be 99.99% certain that the results were not due to chance. To avoid these errors, students should be aware of decimal places and take time to check their answers.
Notes from the mark scheme and report
only 1% probability the difference in stress ratings is due to chance, applied to the run
no reference to 0.01 level = max 1 (e.g. reject null)
common error '99.99% certain'
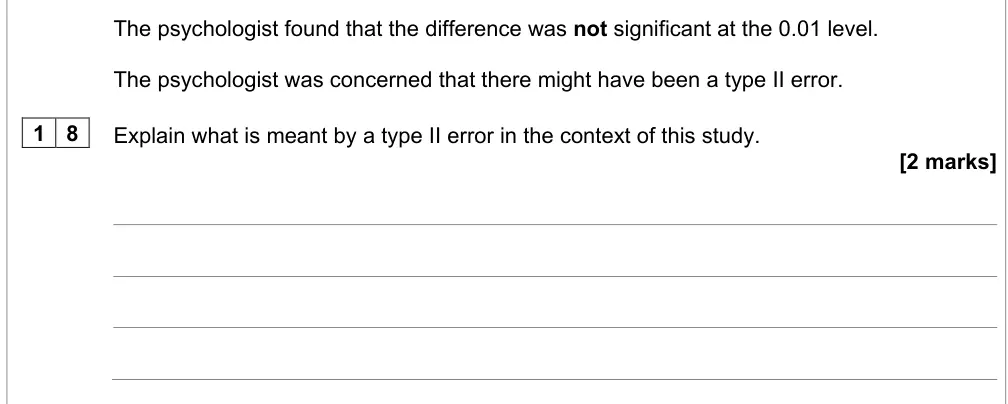
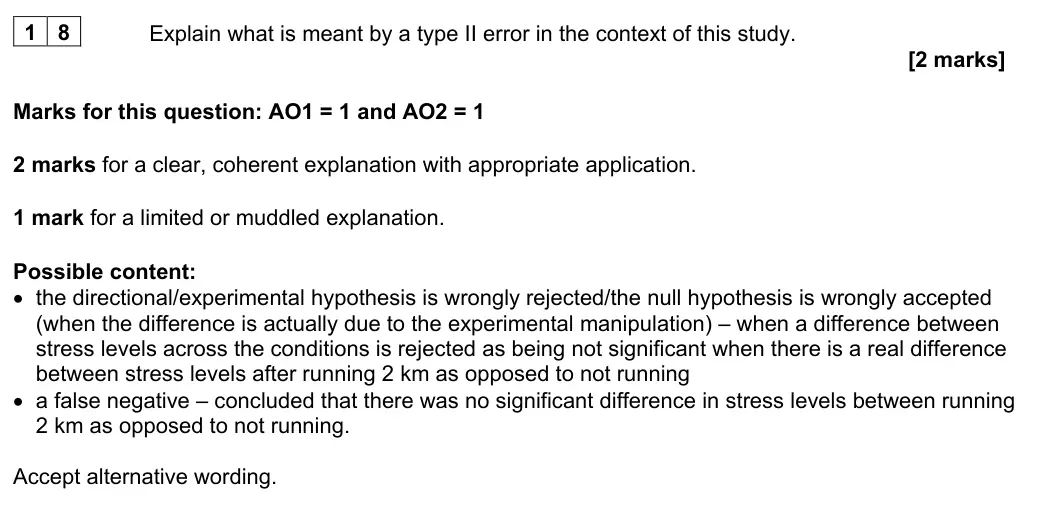
June 2023 · Paper 2 · Q182 marksAO1=1, AO2=1Research methods
Mark scheme, including level descriptors and indicative content
Examiner's comment
This question was a good differentiator, with some excellent responses by students who clearly explained what a type II error meant in the context of the study. Some had learned the definition of a type II error but struggled to explain it clearly in the context of the study. There was only the occasional muddle with type I errors, and some who explained extraneous variables or human error. The most common error was not relating the answer to the context of the study.
Notes from the mark scheme and report
Type II = wrongly accepting the null/false negative - concluding no difference in stress between running and not running when there is one
failure to contextualise
occasional muddle with Type I
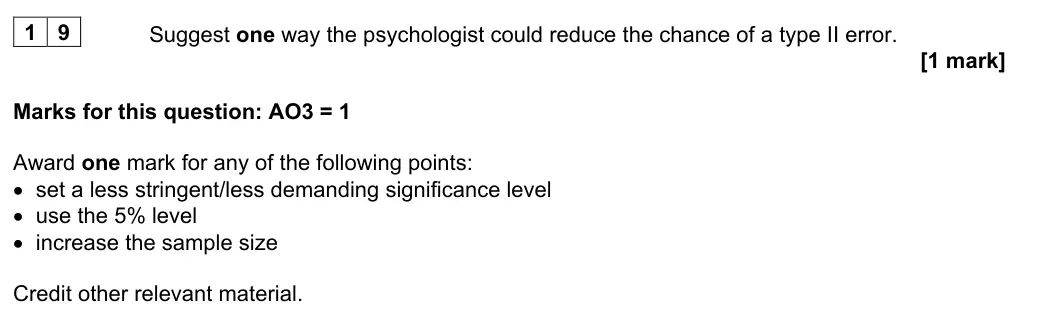
June 2023 · Paper 2 · Q191 markAO3=1Research methodsHard
Mark scheme, including level descriptors and indicative content
Examiner's comment
This question produced a mixed response. Those who understood what a type II error was were able to access a mark. The most common response was a suggestion to ‘use the 5% level’, but all three points on the mark scheme were covered by the cohort. Those who did not know what a type II error was (or did not have understanding beyond the definition) struggled to consider how the chance of making a type II error could be reduced. They often suggested replication of the study, inter-rater reliability, using an alternative test, peer review, getting others to look at the research, etc. Vague responses which suggested that the significance level should be changed were not awarded credit.
Notes from the mark scheme and report
use a less stringent level (5%) or increase sample size
vague 'change the significance level' not credited
replication/peer review/alternative test not creditworthy
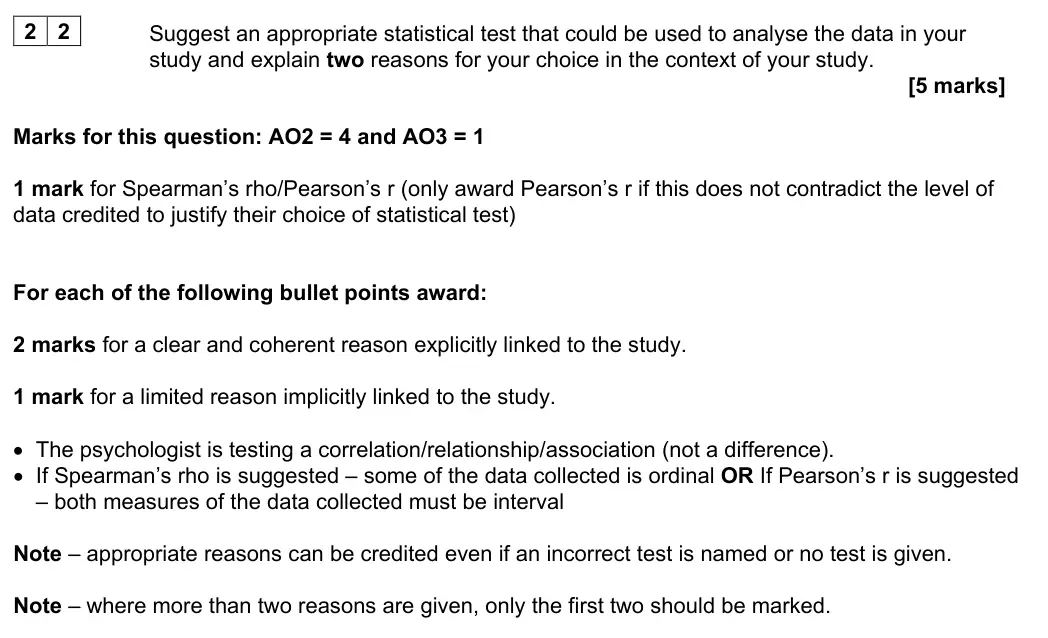
June 2023 · Paper 2 · Q225 marksAO2=4, AO3=1Research methods
Mark scheme, including level descriptors and indicative content
Examiner's comment
This question produced a mixed response with a relatively even spread of the marks awarded. Overall students appear to have developed a good knowledge of statistics. Many could name an appropriate test of correlation and give reasons for their choices, but then found it more challenging to explain this in relation to the question stem. Thus, the requirement to link choices to the context, continued to work well as a discriminator, with only the better responses doing this. Students were generally able to justify correlation, often with application, but found the level of data more challenging. Some students who identified interval data either did not apply this or only described one data set. There were some excellent responses, with full marks awarded for those students who had good recall of knowledge for choice of statistical test with a good understanding of exam technique for this style of question.
Notes from the mark scheme and report
Spearman's rho (or Pearson's r if consistent with interval data) + two contextualised reasons (correlation, level of data), 2 marks each
only first two reasons marked
level of data harder to justify
June 2023 · Paper 3 · Q264 marksAO2=4Research methods
Mark scheme, including level descriptors and indicative content
Examiner's comment
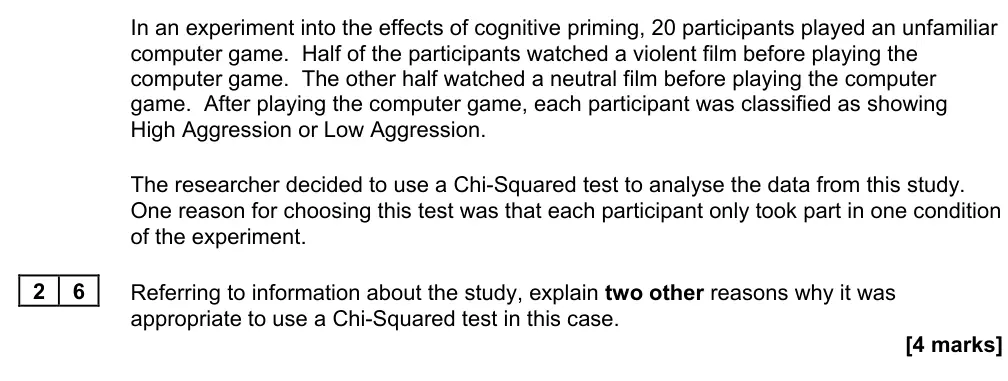
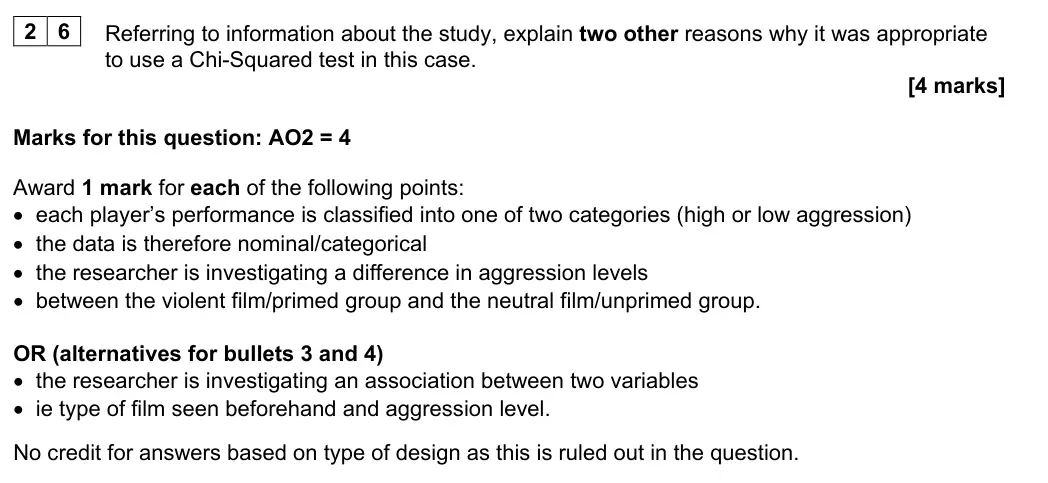
Many students recognised the level of data as nominal and offered a sound justification for this, with reference to high and low aggression as the two categories. Marks for the other reason were more elusive. A surprising number of students talked about the type of design even though this was ruled out in the question. Many incorrectly identified the study as investigating a correlation, rather than an association, and whilst others did identify the study as a test of difference, their explanation for why was often vague or inaccurate.
Notes from the mark scheme and report
1 mark each: categories high/low aggression
data nominal
test of difference between violent/neutral film groups (or association between film type and aggression)
no credit for design (ruled out in stem)
many wrongly said correlation
June 2023 · Paper 3 · Q314 marksAO2=4Research methods
Mark scheme, including level descriptors and indicative content
Examiner's comment
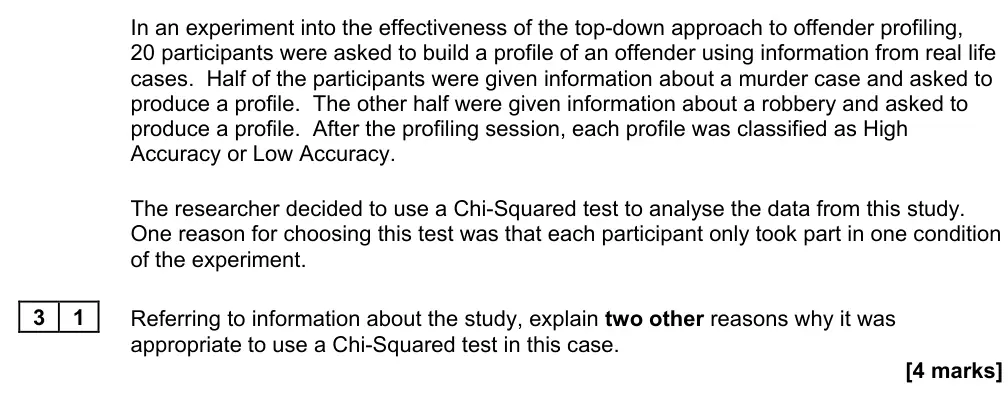
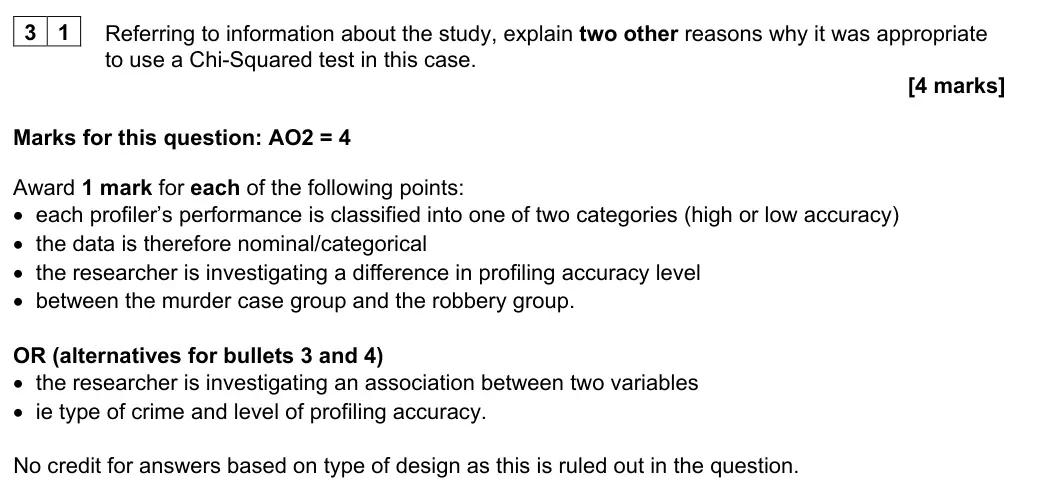
Many students recognised the level of data as nominal and offered a sound justification for this with reference to high and low accuracy as the two categories. Marks for the other reason were more elusive. A surprising number of students talked about the type of design even though this was ruled out in the question. Many incorrectly identified the study as investigating a correlation, rather than an association. Whilst others did identify the study as a test of difference, their explanation for why was often vague or inaccurate.
Notes from the mark scheme and report
'top-down' approach = 'typology' approach in v1.4 (current)
1 mark each: high/low accuracy categories
nominal data
difference between murder/robbery groups (or association)
no credit for design
many wrongly said correlation
June 2023 · Paper 3 · Q364 marksAO2=4Research methods
Mark scheme, including level descriptors and indicative content
Examiner's comment
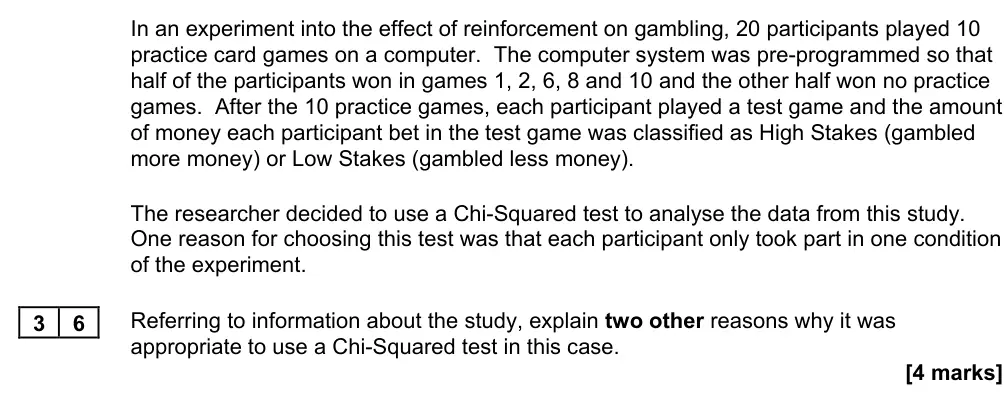
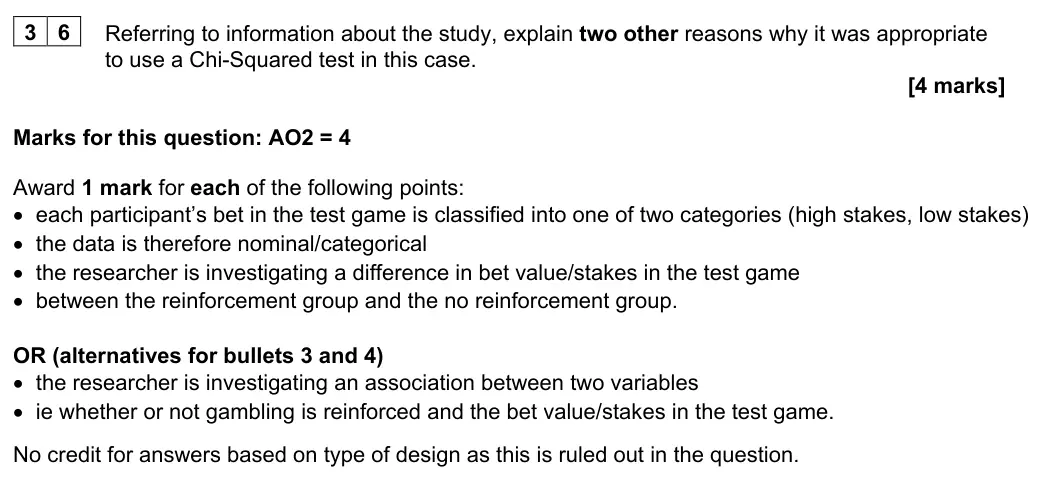
Many students recognised the level of data as nominal and offered a sound justification for this with reference to high and low stakes as the two categories. Marks for the other reason were more elusive. A surprising number of students talked about the type of design even though this was ruled out in the question. Many incorrectly identified the study as investigating a correlation, rather than an association. Whilst others did identify the study as a test of difference, their explanation for why was often vague or inaccurate.
Notes from the mark scheme and report
1 mark each: high/low stakes categories
nominal data
difference between reinforced/non-reinforced groups (or association)
no credit for design
many wrongly said correlation
June 2022 · Paper 1 · Q152 marksAO2=2Research methods
Mark scheme, including level descriptors and indicative content
Examiner's comment
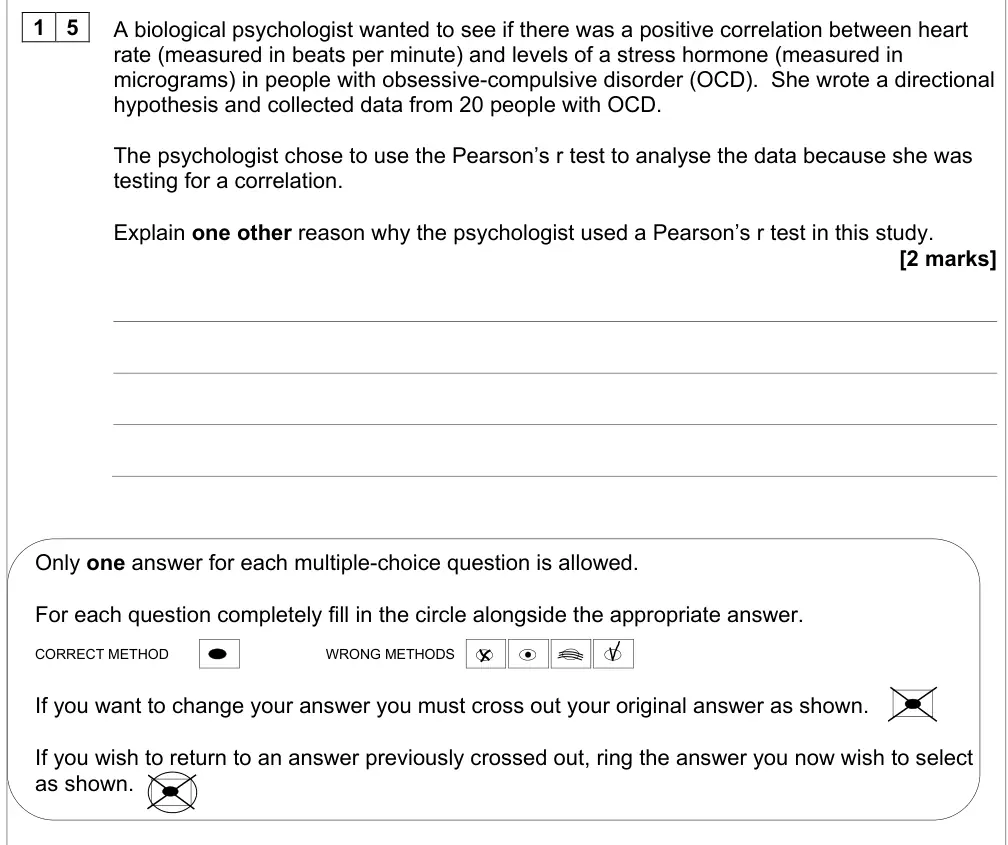
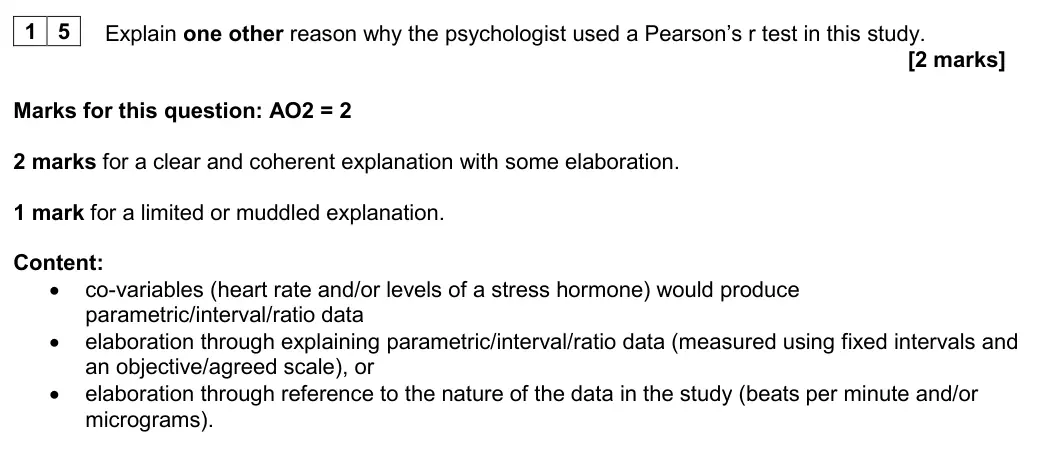
This question was answered reasonably well. Most students could identify parametric/interval/ratio data, but some failed to elaborate accurately, for example by reference to the nature of interval data, or to the actual measures used in the study. It is important to note that a significant number of students failed to attempt Questions 15 and 17, potentially indicating a lack of preparation for the statistics element of the exam.
Notes from the mark scheme and report
interval/ratio/parametric data, elaborated by defining interval data or referring to bpm/micrograms
many did not attempt 15 and 17
June 2022 · Paper 1 · Q174 marksAO2=4Research methods
Mark scheme, including level descriptors and indicative content
Examiner's comment
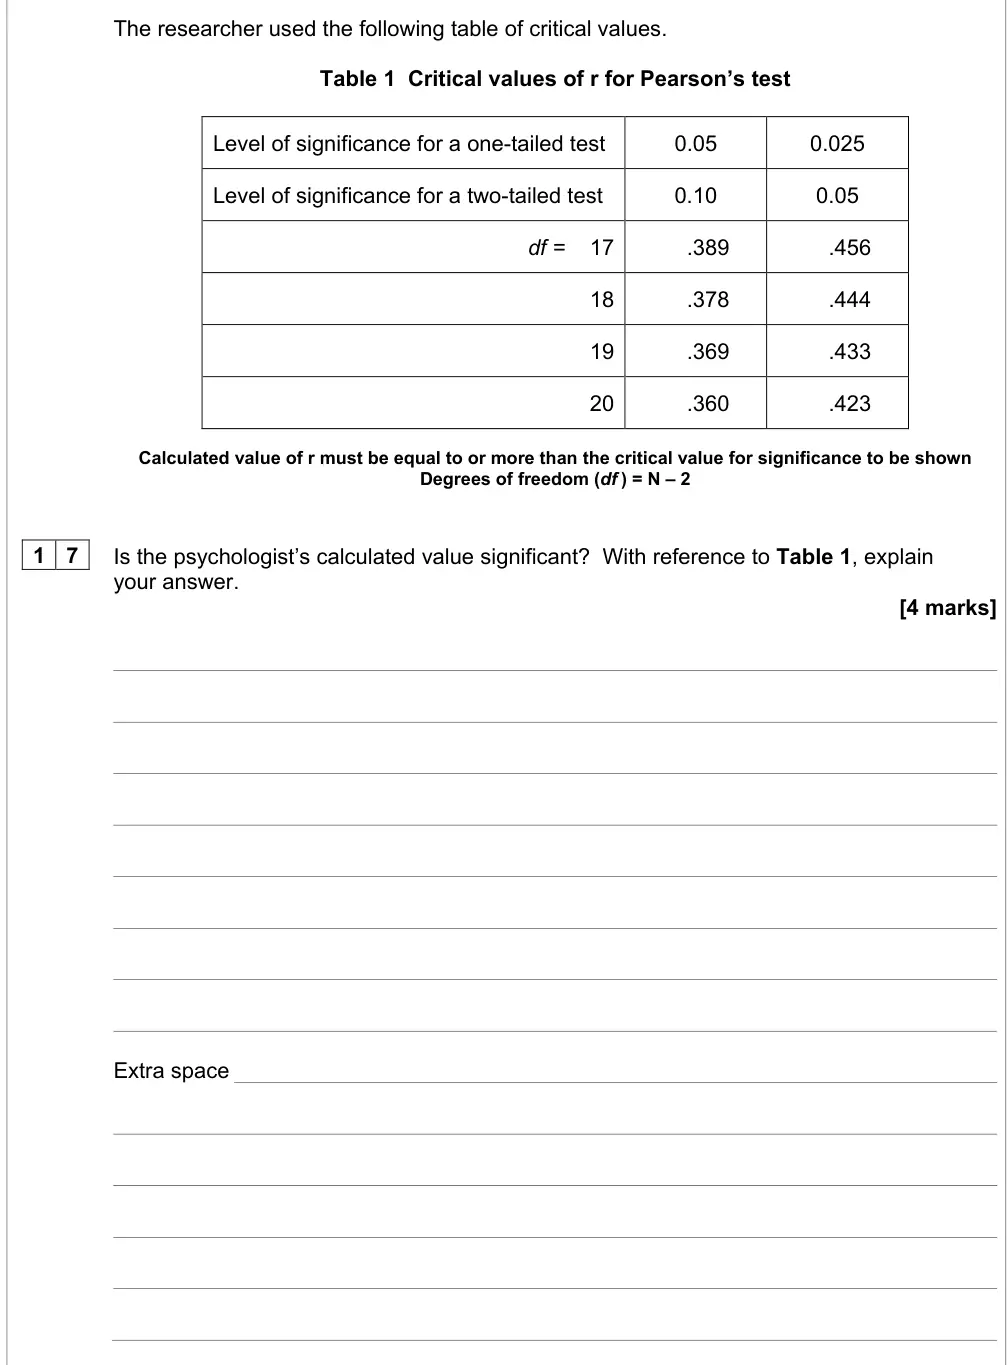
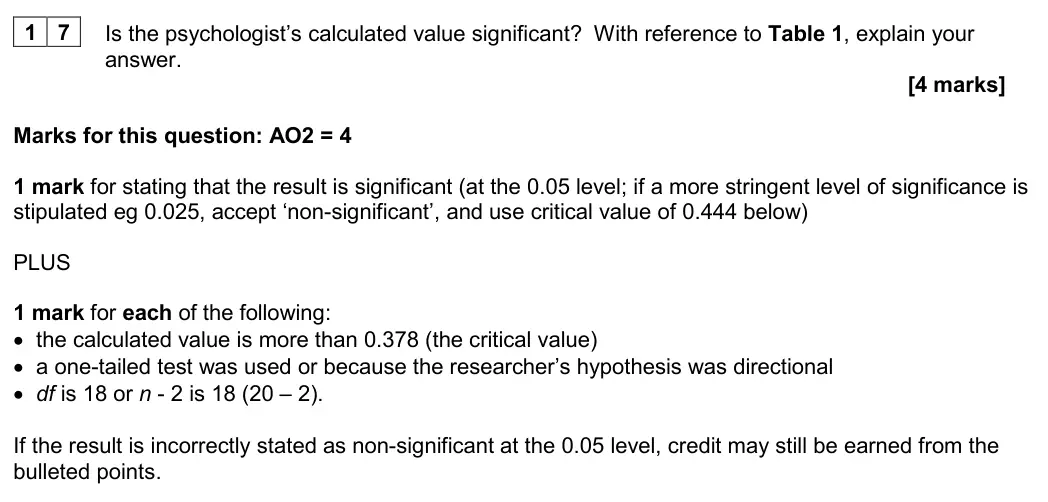
Similarly, a significant number of students did not attempt Question 17 (interpreting statistical results). Most students who answered this question did reasonably well. There were four marks available, and if any were missed it tended to be because students hadn’t grasped that it was a directional (one-tailed) hypothesis and/or hadn’t identified the correct degrees of freedom. Marks were awarded if there was clear annotation of the critical values table. It is important to note that a significant number of students failed to attempt Questions 15 and 17, potentially indicating a lack of preparation for the statistics element of the exam.
Notes from the mark scheme and report
1 mark significant at 0.05 + 1 each: 0.42 > critical value 0.378, one-tailed because directional hypothesis, df = 18 (N-2)
marks lost for missing one-tailed and/or wrong df
annotation of table credited
June 2022 · Paper 2 · Q157 marksAO2=7Research methods
Mark scheme, including level descriptors and indicative content
Examiner's comment
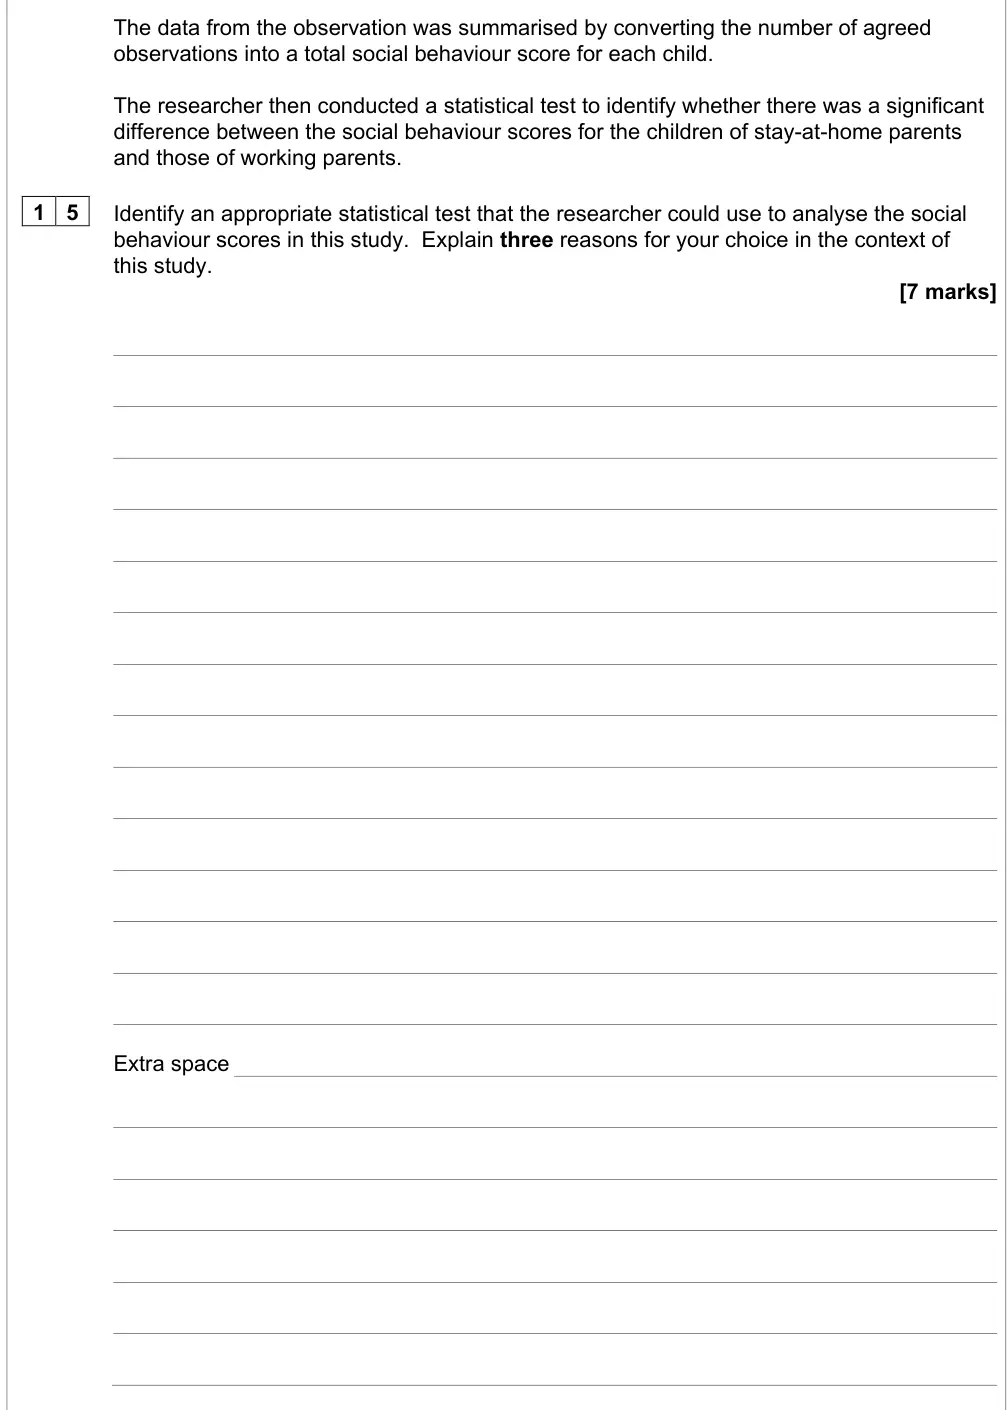
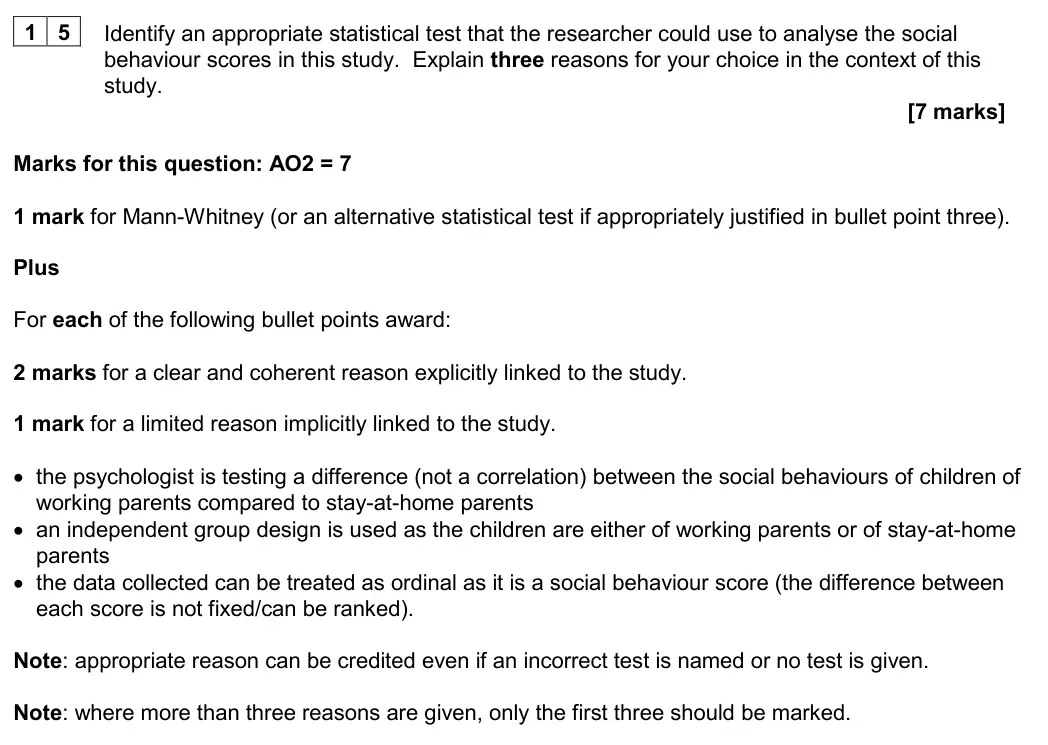
This question discriminated well. Most students remembered to explain their reasons for their choice of statistical test in the context of the study and there were some very clear, accurate and effectively applied responses seen. However, many students identified Chi-Squared test as an appropriate statistical test but did not explain how the data would be converted from ordinal to nominal. Some students suggested that the data was nominal because there were two conditions of the independent variable or because there were different behavioural categories used in the observation. Others incorrectly justified independent group design due to the children being observed separately/independently. Overall, the best explanations for a reason given were those regarding a test of difference.
Notes from the mark scheme and report
Mann-Whitney + three contextualised reasons (difference, independent groups - children of working vs stay-at-home parents, ordinal social behaviour scores), 2 marks each
Chi-squared without explaining conversion to nominal
independent groups wrongly justified by children being observed separately
June 2022 · Paper 3 · Q24 marksAO2=4Research methods
Mark scheme, including level descriptors and indicative content
Examiner's comment
Question 02 was usually very well answered and sometimes accompanied by a decision diagram.
Notes from the mark scheme and report
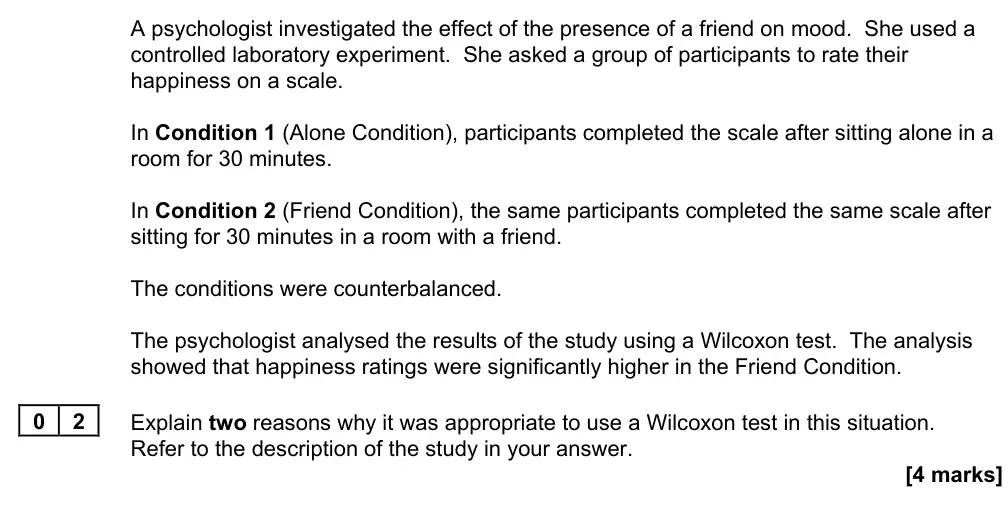
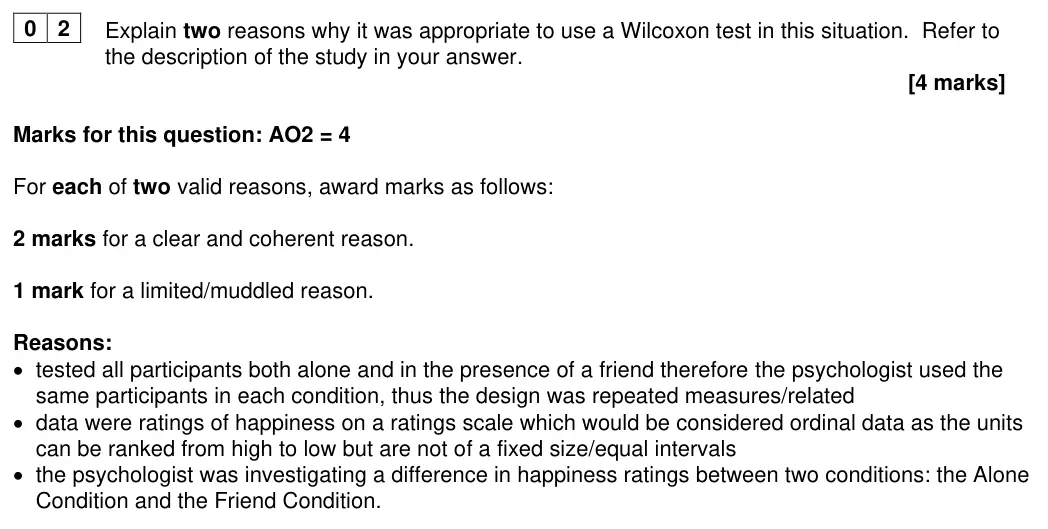
2 marks per reason, in context: same participants alone and with friend = repeated measures/related
happiness ratings = ordinal
testing for a difference between two conditions
well answered
November 2021 · Paper 1 · Q137 marksAO2=7Research methods
Mark scheme, including level descriptors and indicative content
Examiner's comment
Overall performance was disappointing, with many students not even attempting this question. There were some excellent answers, and a number of students earned marks for their reasoning even where the incorrect test was identified.
Notes from the mark scheme and report
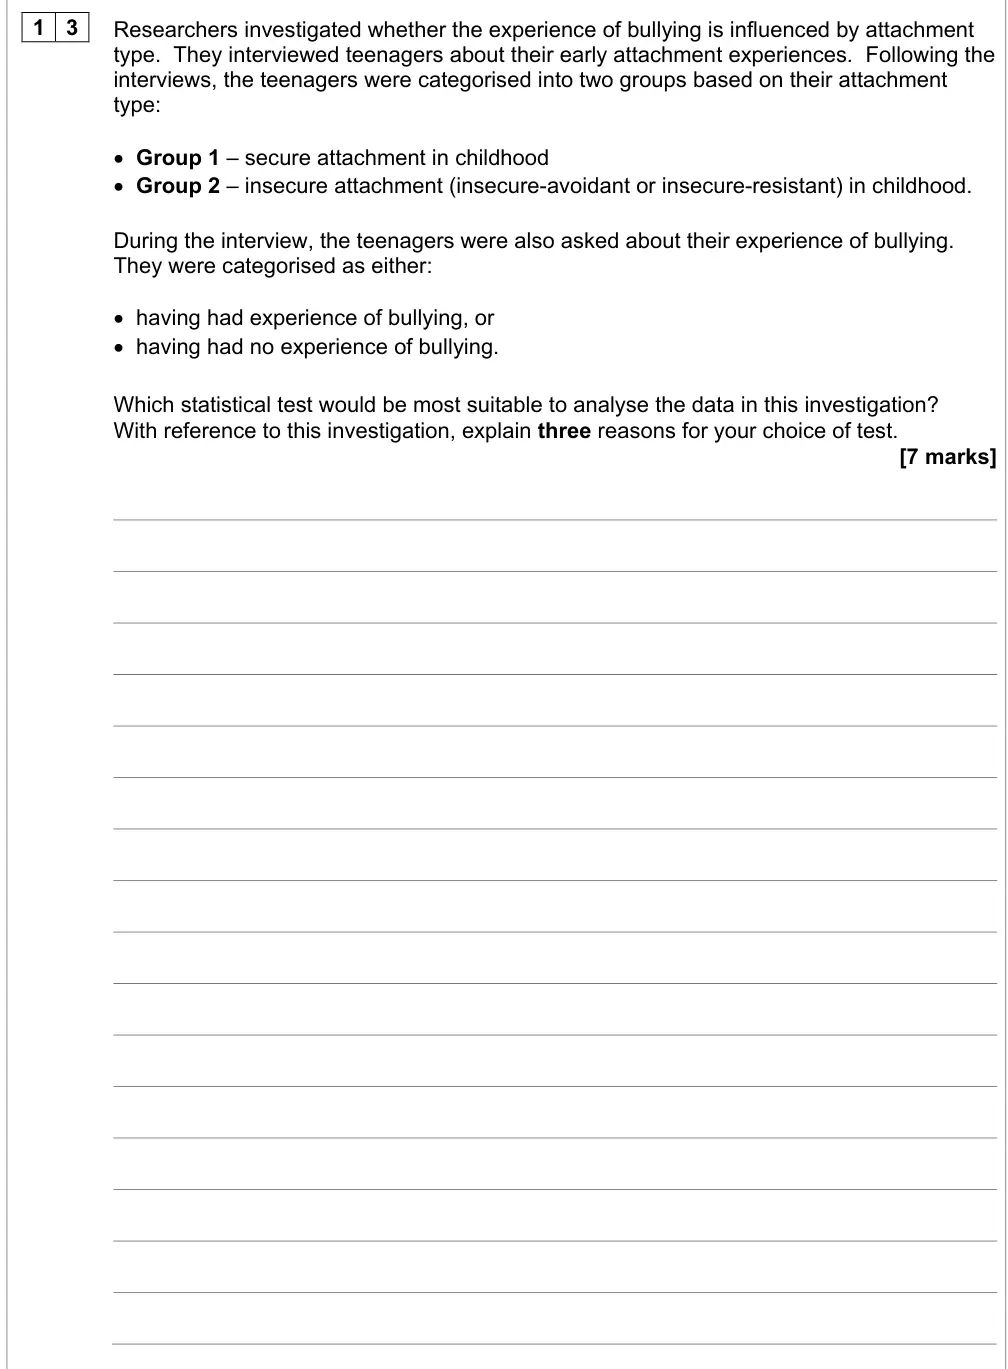
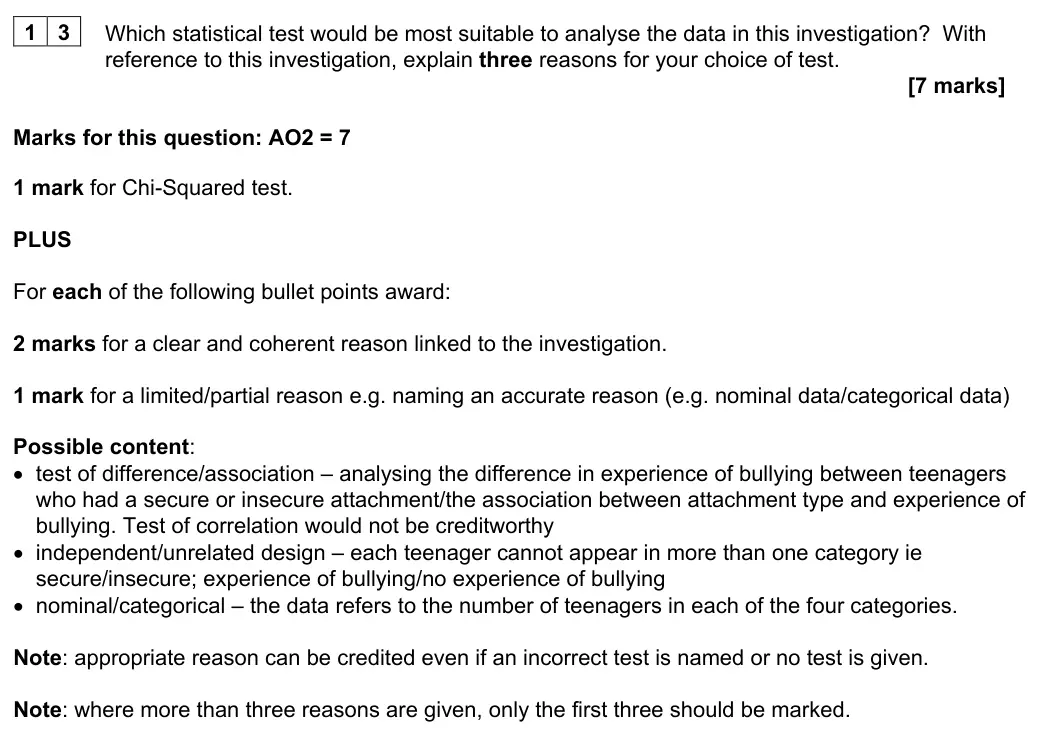
1 mark Chi-Squared + 3 reasons x 2 marks each linked to the study (difference/association, independent design, nominal data)
test of correlation not creditworthy
reasons credited even if wrong test
only first three reasons marked
many did not attempt
November 2021 · Paper 2 · Q204 marksAO2=4Research methods
Mark scheme, including level descriptors and indicative content
Examiner's comment
This question differentiated well but there were many students who did not attempt the question. Those attempting the question generally did well, especially on the first bullet point of the mark scheme. Some students did not refer to the description of the study in their answers, which limited them to a maximum of two marks.
Notes from the mark scheme and report
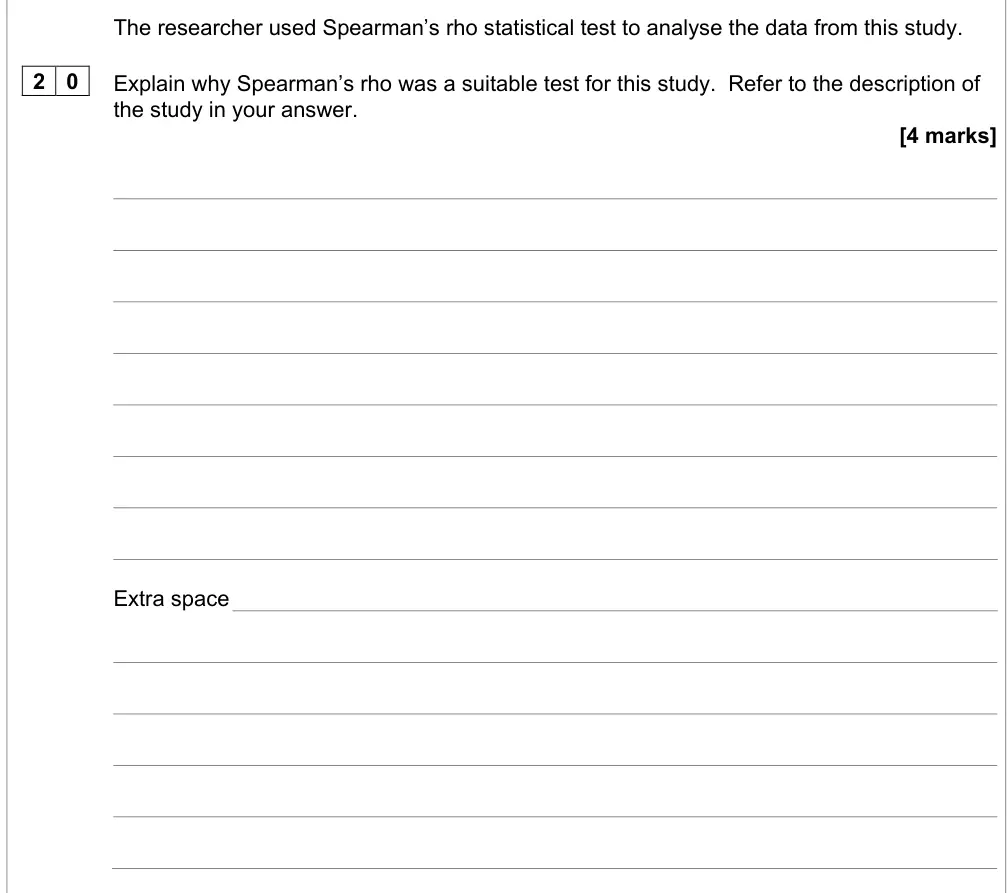
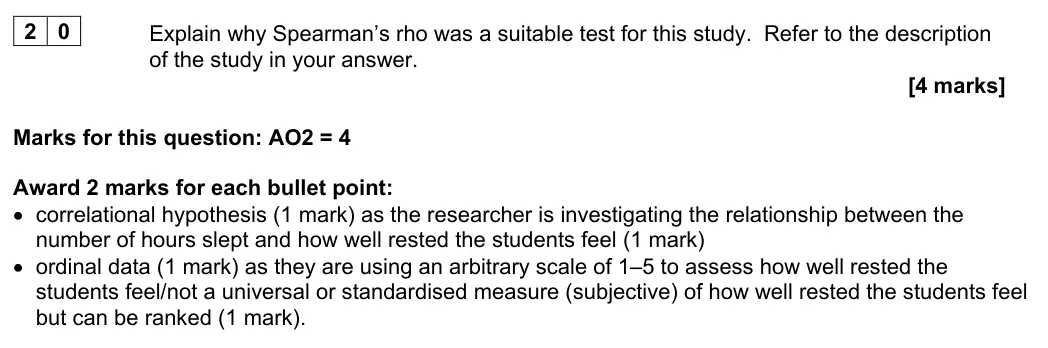
correlational hypothesis (relationship hours slept-restedness) + ordinal data (arbitrary 1-5 rating), 2 marks each
no reference to the study = max 2
many did not attempt
November 2021 · Paper 2 · Q214 marksAO2=4Research methods
Mark scheme, including level descriptors and indicative content
Examiner's comment
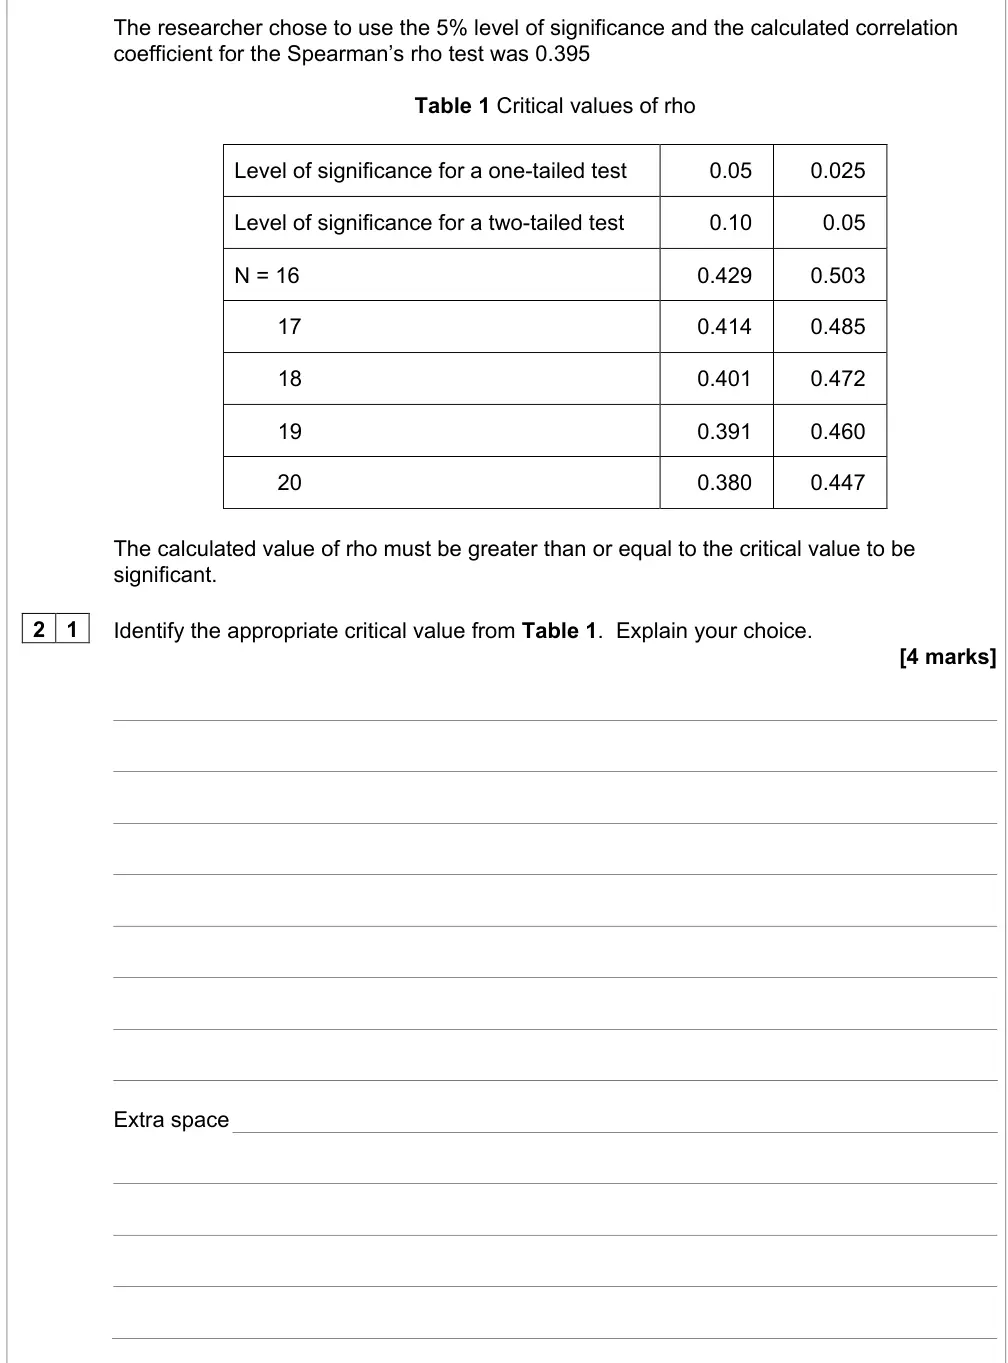
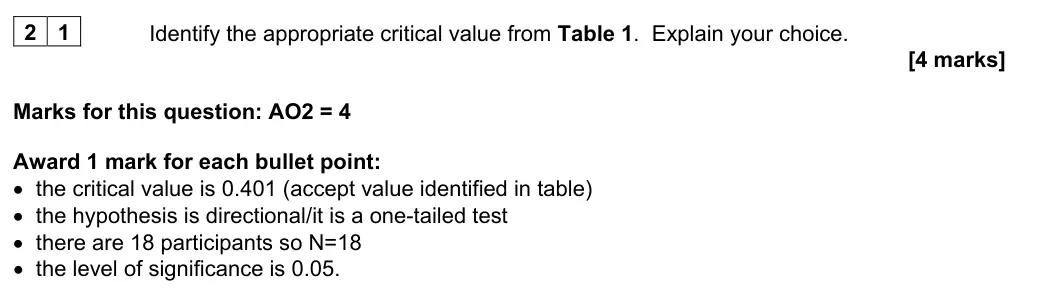
This question differentiated well, although there was a high proportion of the cohort who did not attempt the question. Most students who produced responses, achieved all 4 marks but there were still a lot of two-mark responses. The most common error was to use a two-tailed test and thus a critical value of 0.472.
Notes from the mark scheme and report
critical value 0.401: one-tailed (directional), N = 18, 0.05 level, 1 mark each
most common error using two-tailed (0.472)
many did not attempt
November 2021 · Paper 2 · Q222 marksAO2=2Research methodsEasy
Mark scheme, including level descriptors and indicative content
Examiner's comment
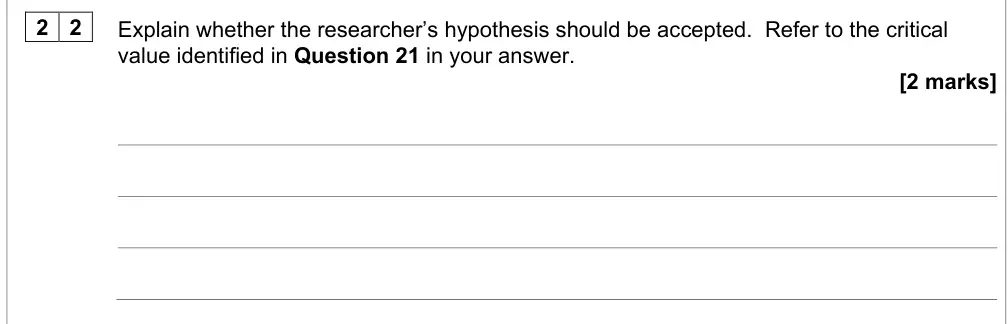
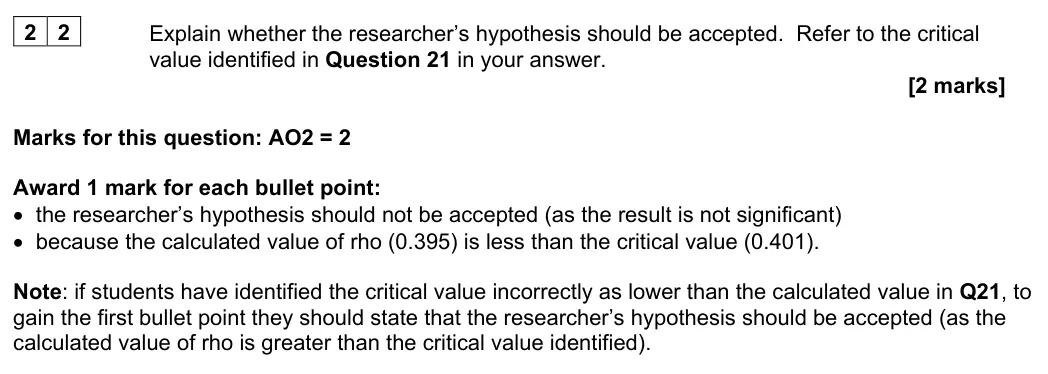
A lot of students did not attempt this question. The majority of those who answered the question obtained full marks, although some muddled the critical value and calculated value of rho. Some students who made errors in Q21, which meant that they identified the critical value as less than the calculated value, were able to gain follow through marks.
Notes from the mark scheme and report
hypothesis not accepted because 0.395 < 0.401 (not significant)
follow-through from Q21 allowed
muddling calculated and critical values
November 2021 · Paper 2 · Q232 marksAO2=2Research methodsHard
Mark scheme, including level descriptors and indicative content
Examiner's comment
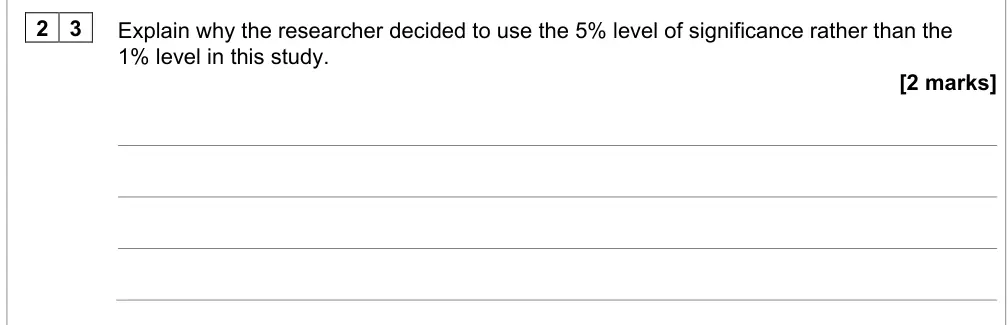
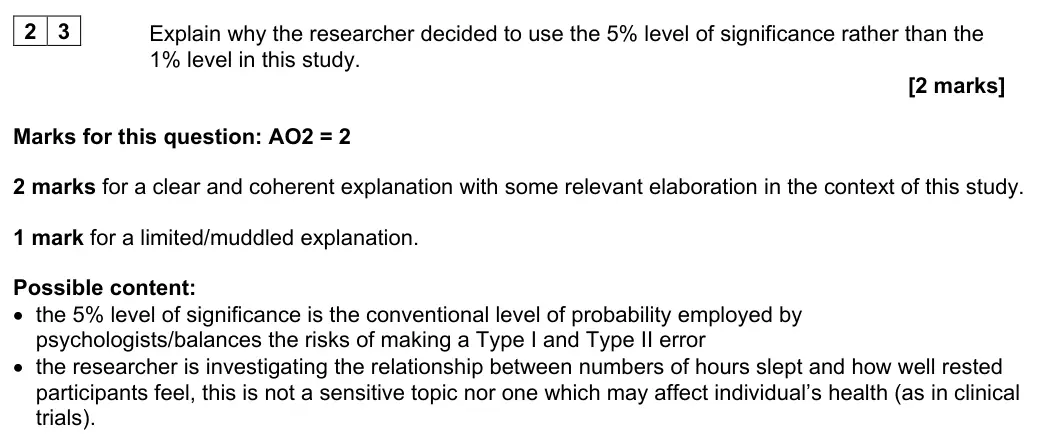
This question was generally not well answered, with the majority of students failing to achieve any marks. Too many students did not attempt the question, either due to gaps in knowledge or timing issues. Those who attempted the question often did not seem to have learned why the 5% level should be used and/or did not understand what this meant. Students who identified the 5% level of significance being the conventional level tended to gain credit but references to Type I and Type II errors were often muddled. Less than 3% of the cohort were able to explain why the researcher used the 5% level of significance, as opposed to the 1% level, in the context of the study.
Notes from the mark scheme and report
5% is conventional/balances Type I and Type II errors + not a sensitive or health-related topic in context
majority scored 0
under 3% contextualised
November 2021 · Paper 2 · Q242 marksAO2=2Research methods
Mark scheme, including level descriptors and indicative content
Examiner's comment
This question was not well answered with the majority of students unable to access the marks either due to not attempting the question or due to a lack of understanding of what a Type II error is. A lot of students incorrectly explained a Type II error to be an error made in the calculation. Approximately a third of the cohort were able to correctly explain what a Type II error was but failed to contextualise their answers. The small proportion of students who did understand what was meant by a Type II error and were able to explain it in the context of the study attained full marks.
Notes from the mark scheme and report
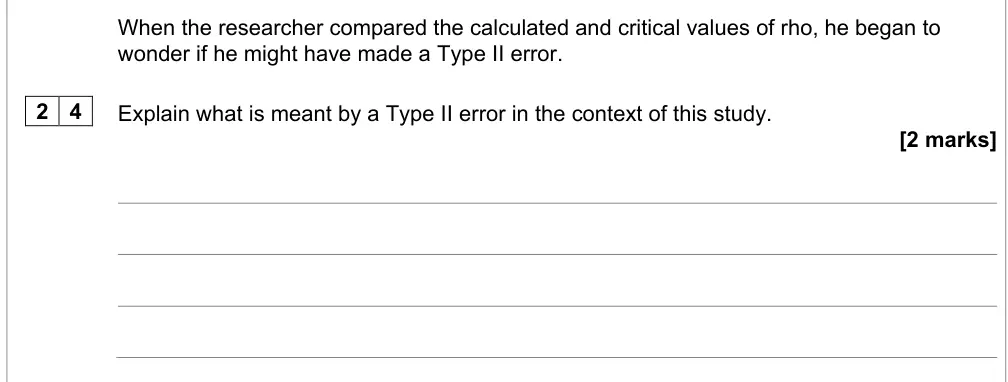
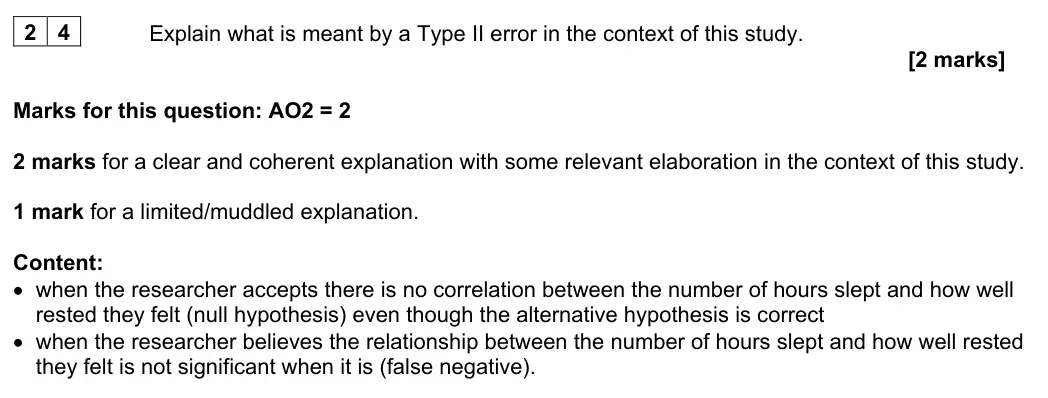
Type II = accepting the null (no correlation between hours slept and restedness) when there really is one (false negative), in context
many thought it was a calculation error
a third failed to contextualise
November 2021 · Paper 3 · Q44 marksAO3=4Research methods
Mark scheme, including level descriptors and indicative content
Examiner's comment
Most responses to Q04 showed some understanding of the process and purpose of statistical testing with a reasonable number referring to comparison of calculated and critical values. Although it was not necessary to choose a suitable test or give a rationale for the test choice, many students did follow that route.
Notes from the mark scheme and report
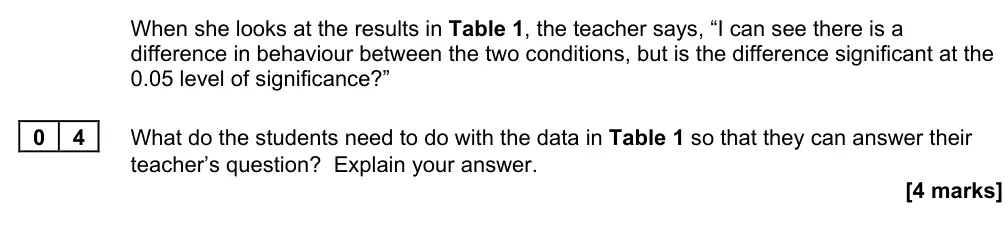
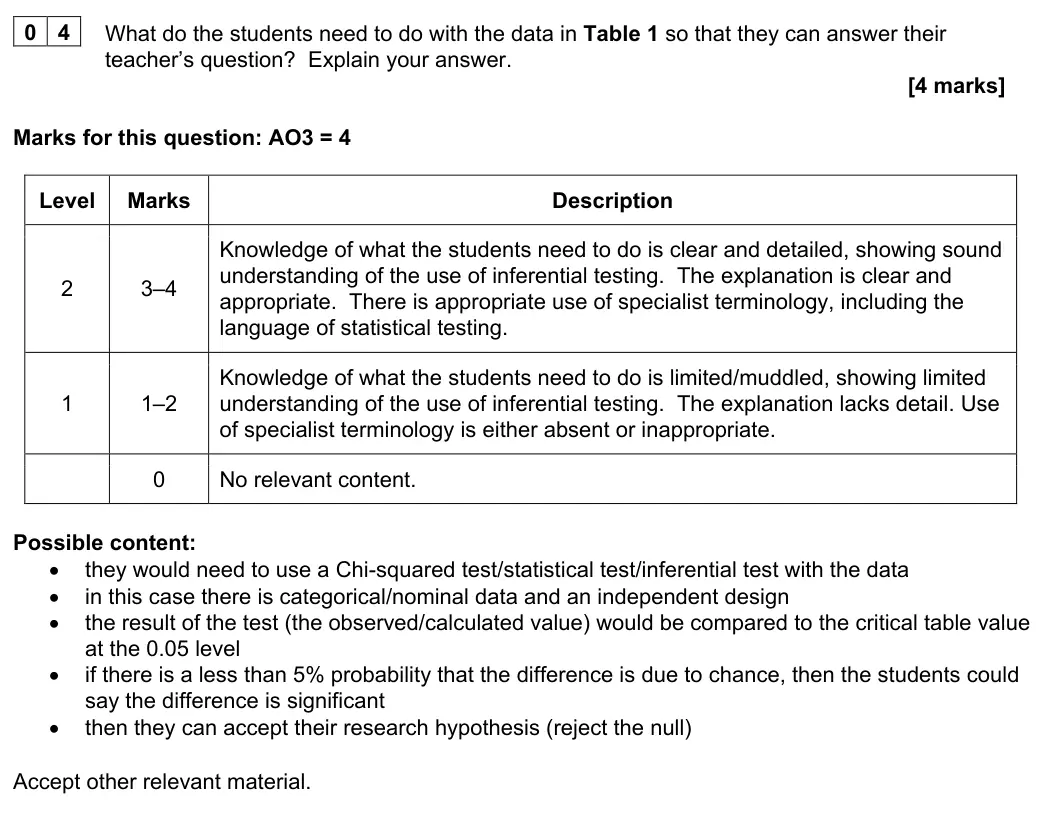
use an inferential test (Chi-squared: nominal data, independent design), compare calculated with critical value at 0.05, p < 0.05 -> significant, accept research hypothesis
test choice not required
November 2020 · Paper 2 · Q227 marksAO2=7Research methods
Mark scheme, including level descriptors and indicative content
Examiner's comment
Sadly, a large number of students did not attempt this question which was costly given the number of marks available. Those who answered the question achieved their marks for identifying the appropriate statistical test and explaining why the test would be appropriate but struggled to do so in the context of the study. It was good to see that some students were able to clearly and accurately contextualise their reasons and achieve full marks but this is a skill that teachers are advised to encourage students to practise, (justifying their choice of statistical test in context).
Notes from the mark scheme and report
Mann-Whitney (or unrelated t-test if data type justified) + three contextualised reasons (difference, independent groups, ordinal/skewed data) 2 marks each
only first three reasons marked
many did not attempt
reasons rarely contextualised
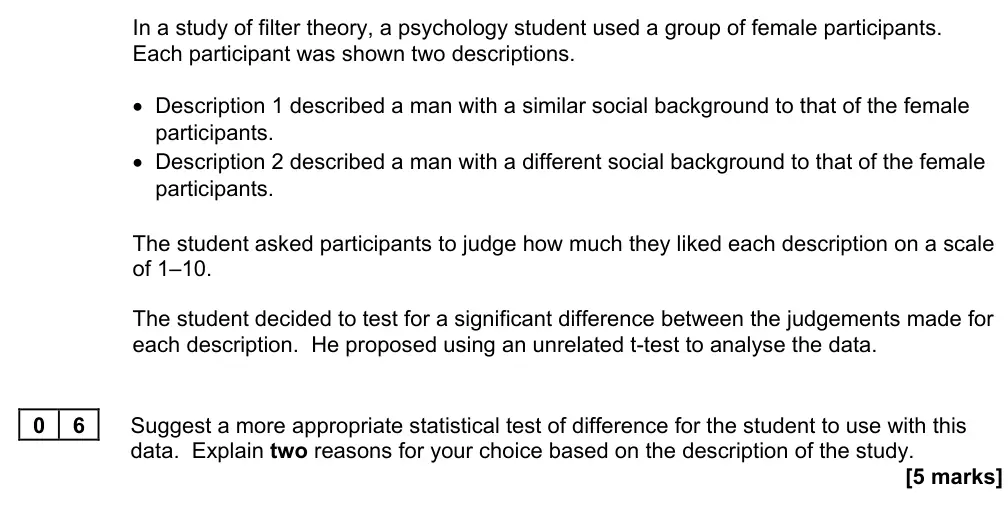
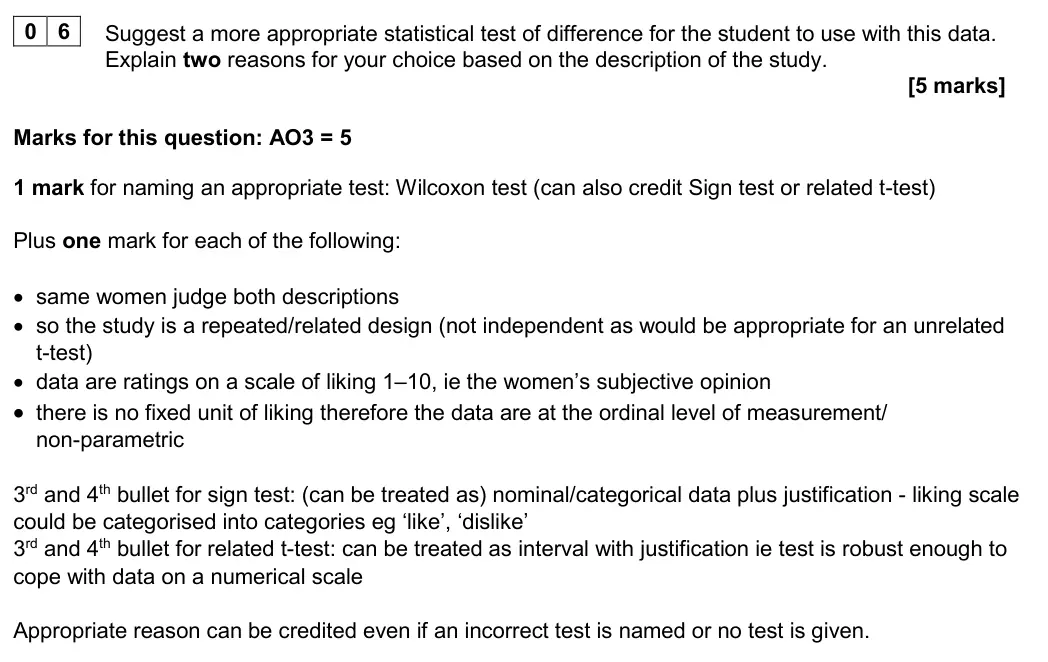
November 2020 · Paper 3 · Q65 marksAO3=5Research methods
Mark scheme, including level descriptors and indicative content
Examiner's comment
Most answers to the questions on statistical testing showed some relevant knowledge and understanding. Where an incorrect test was given students could still get some credit for relevant reasoning based on the scenario. Alternatives to the Wilcoxon test were credited (Sign and related-t) as these could have been made appropriate here, but once these had been credited any accompanying reasoning had to be consistent with the test given.
Notes from the mark scheme and report
1 mark test (Wilcoxon
also sign test or related t-test) + reasons: same women judge both = repeated/related design
1-10 liking ratings subjective = ordinal
reasons creditable even if wrong test named
November 2020 · Paper 3 · Q115 marksAO3=5Research methods
Mark scheme, including level descriptors and indicative content
Examiner's comment
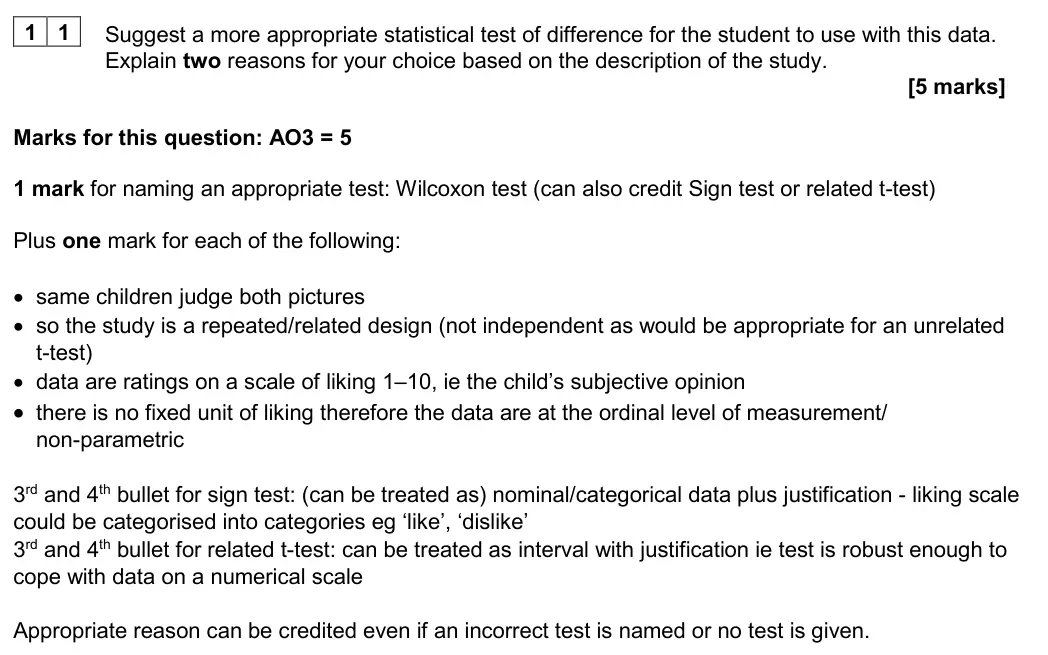
Most answers to the questions on statistical testing showed some relevant knowledge and understanding. Where an incorrect test was given students could still get some credit for relevant reasoning based on the scenario. Alternatives to the Wilcoxon test were credited (Sign and related-t) as these could have been made appropriate here, but once these had been credited any accompanying reasoning had to be consistent with the test given.
Notes from the mark scheme and report
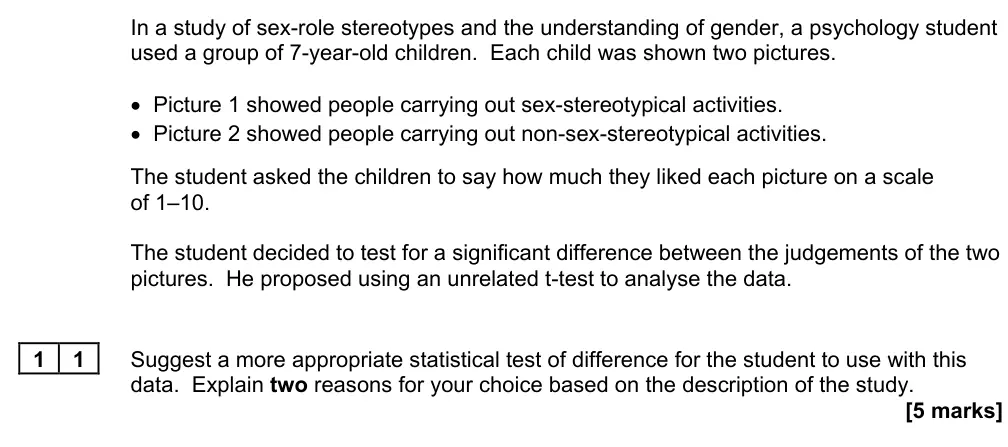
stem is about sex-role stereotypes (removed in v1.4) but marks need only test choice
Wilcoxon (or sign/related t) + same children = related design + ratings = ordinal
November 2020 · Paper 3 · Q165 marksAO3=5Research methods
Mark scheme, including level descriptors and indicative content
Examiner's comment
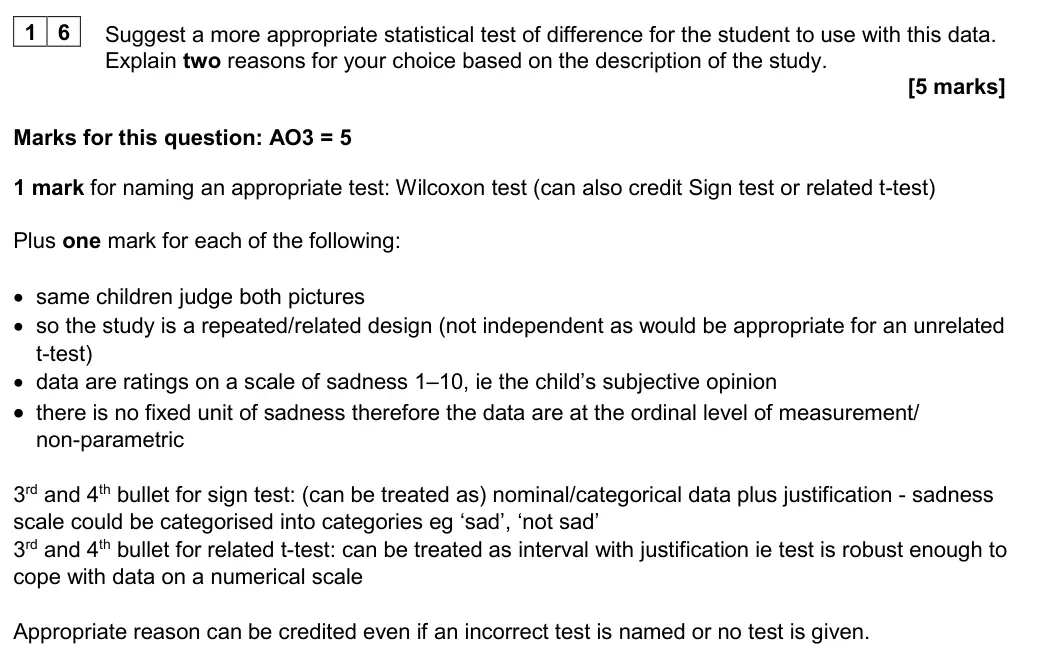
Most answers to the questions on statistical testing showed some relevant knowledge and understanding. Where an incorrect test was given students could still get some credit for relevant reasoning based on the scenario. Alternatives to the Wilcoxon test were credited (Sign and related-t) as these could have been made appropriate here, but once these had been credited any accompanying reasoning had to be consistent with the test given.
Notes from the mark scheme and report
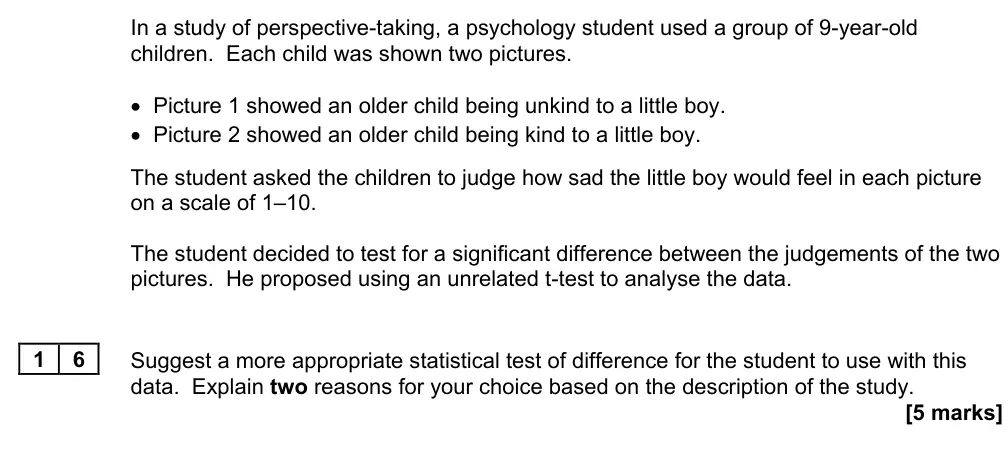
Wilcoxon (or sign/related t) + same children judge both = related design + sadness ratings = ordinal
reasons creditable even if wrong test named
June 2019 · Paper 1 · Q34 marksAO2=4Research methods
Mark scheme, including level descriptors and indicative content
Examiner's comment
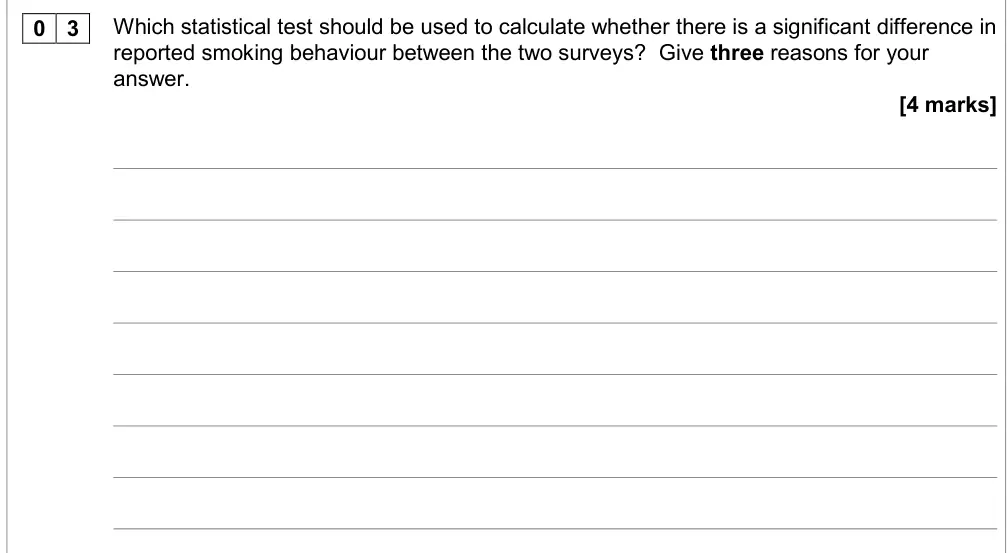
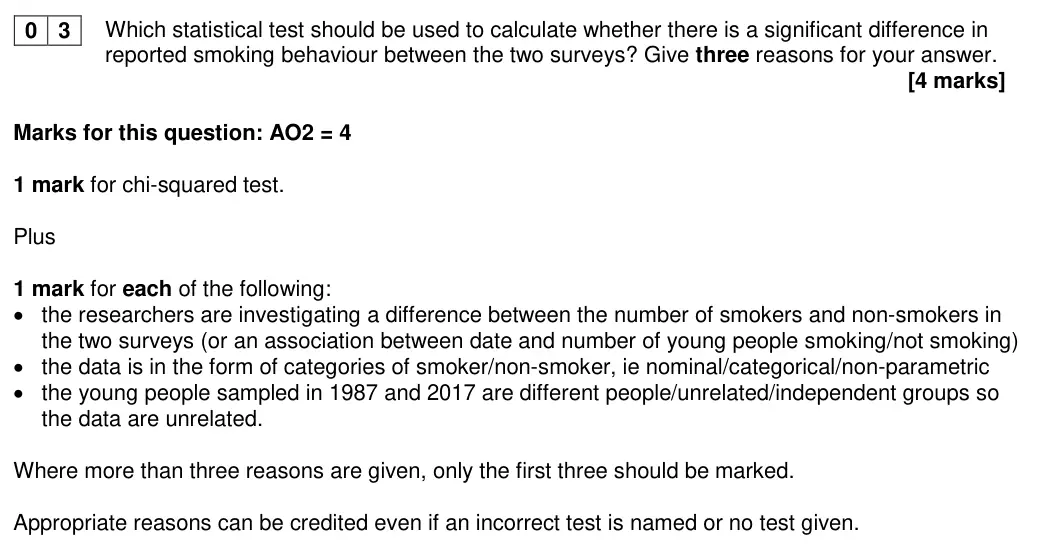
Exceptions were question 3, where a significant minority of answers demonstrated a lack of understanding of statistics and experimental design, and question 10, on economic implications of research into the role of fathers in attachment. To achieve full marks students had to identify the chi square test as a test of difference for nominal/categorical data using an independent/unrelated design. As marks were awarded for identifying the reasons correctly even if the wrong test was named, most students did reasonably well on this question. However, a significant minority did poorly, referring for example to correlations, interval data, related design, sign test or t-test etc, reflecting a weak understanding of statistics and experimental design.
Notes from the mark scheme and report
chi-squared + test of difference/association, nominal data (smoker/non-smoker), independent groups
reasons credited even if wrong test named
first three reasons only
June 2019 · Paper 2 · Q222 marksAO2=2Calculation
Mark scheme, including level descriptors and indicative content
Examiner's comment
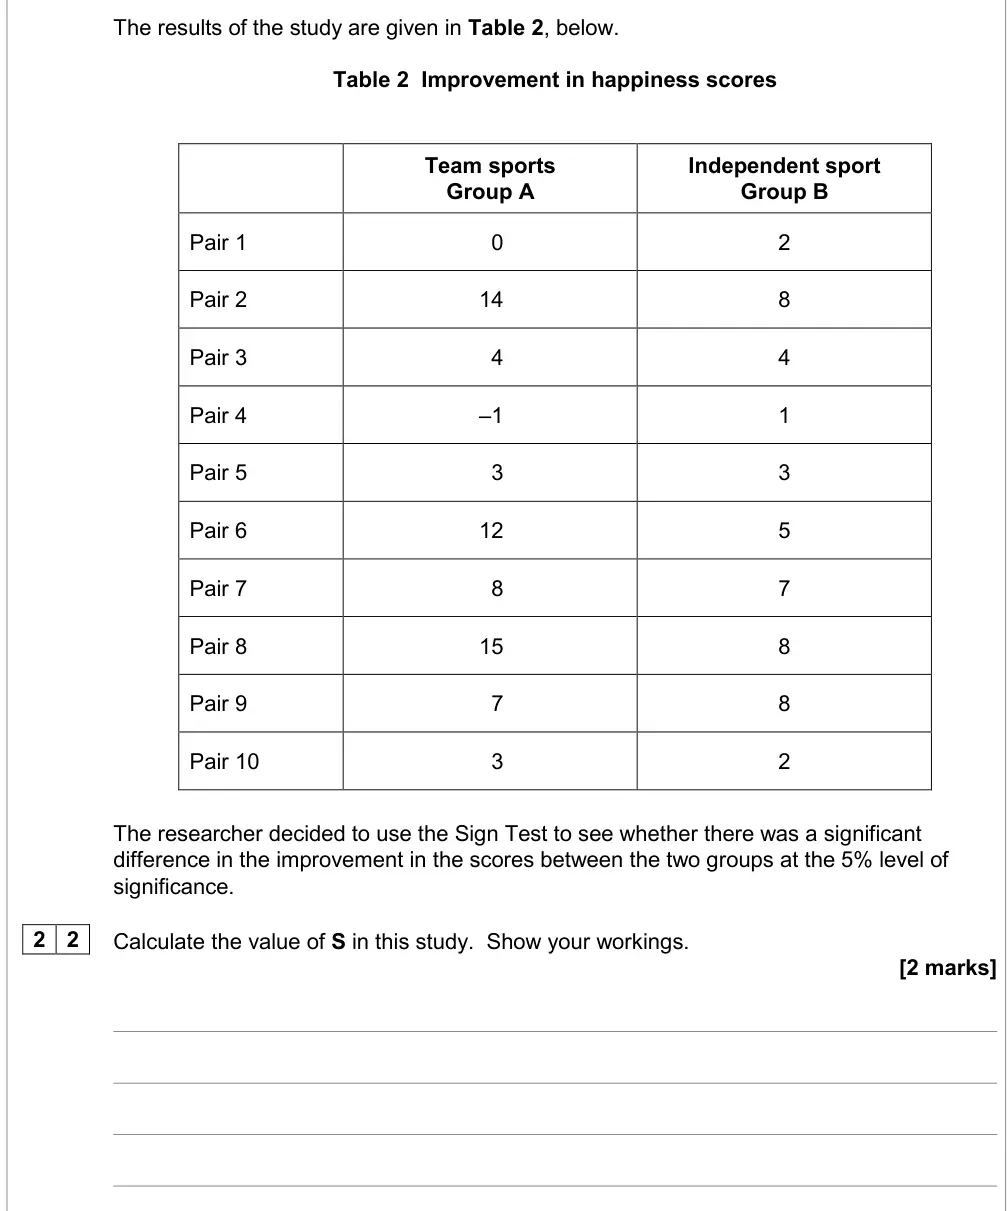
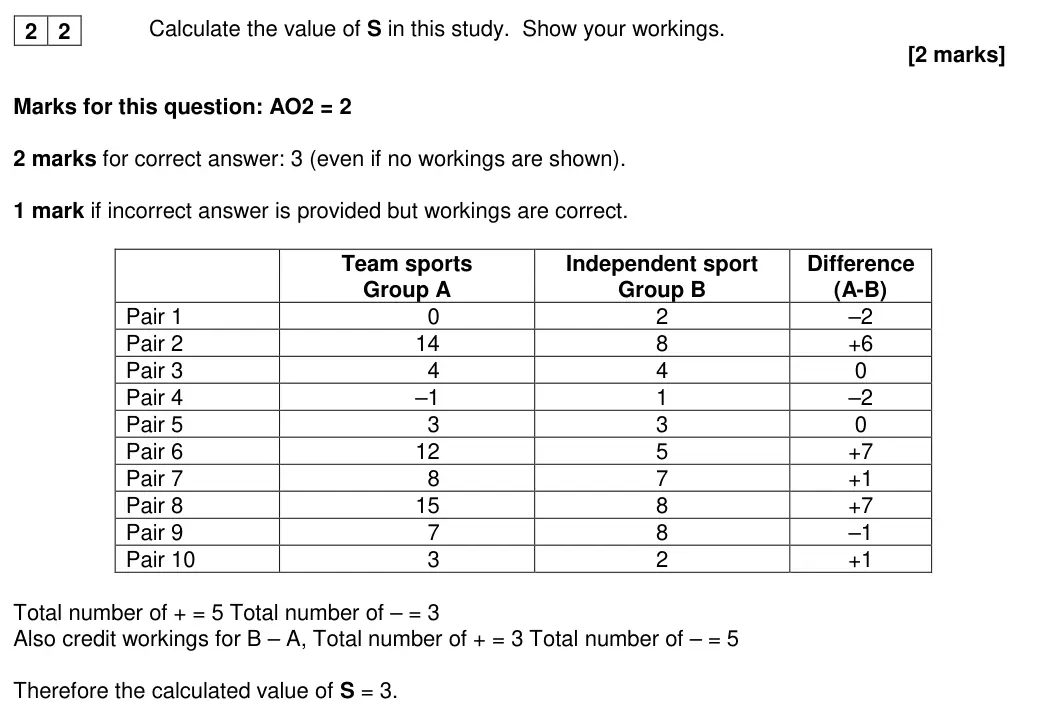
This question produced a mixed response. Many students appeared well prepared, providing a clear and correct response, often with correct workings shown. On the other hand, many others appeared to have no idea with many responses left blank. It was good to see students giving their workings as many achieved credit for these despite giving an incorrect answer. A surprising number of students calculated S to be 2, by cancelling out pair 4 from the table or taking 3 away from 5, whilst others added up the total numbers of positive and negatives to give an S of 5.
Notes from the mark scheme and report
S = 3 (5 plus, 3 minus, 2 ties discarded)
common errors S = 2 (subtracting) or S = 5
many blanks
June 2019 · Paper 2 · Q232 marksAO2=2Research methods
Mark scheme, including level descriptors and indicative content
Examiner's comment
A surprising number of students did not attempt this question, whilst others just wrote whether it was significant or not without any justification. A common mistake was to take the wrong critical value from the table, with a lot of students using N=10 incorrectly and therefore giving a critical value of 1.
Notes from the mark scheme and report
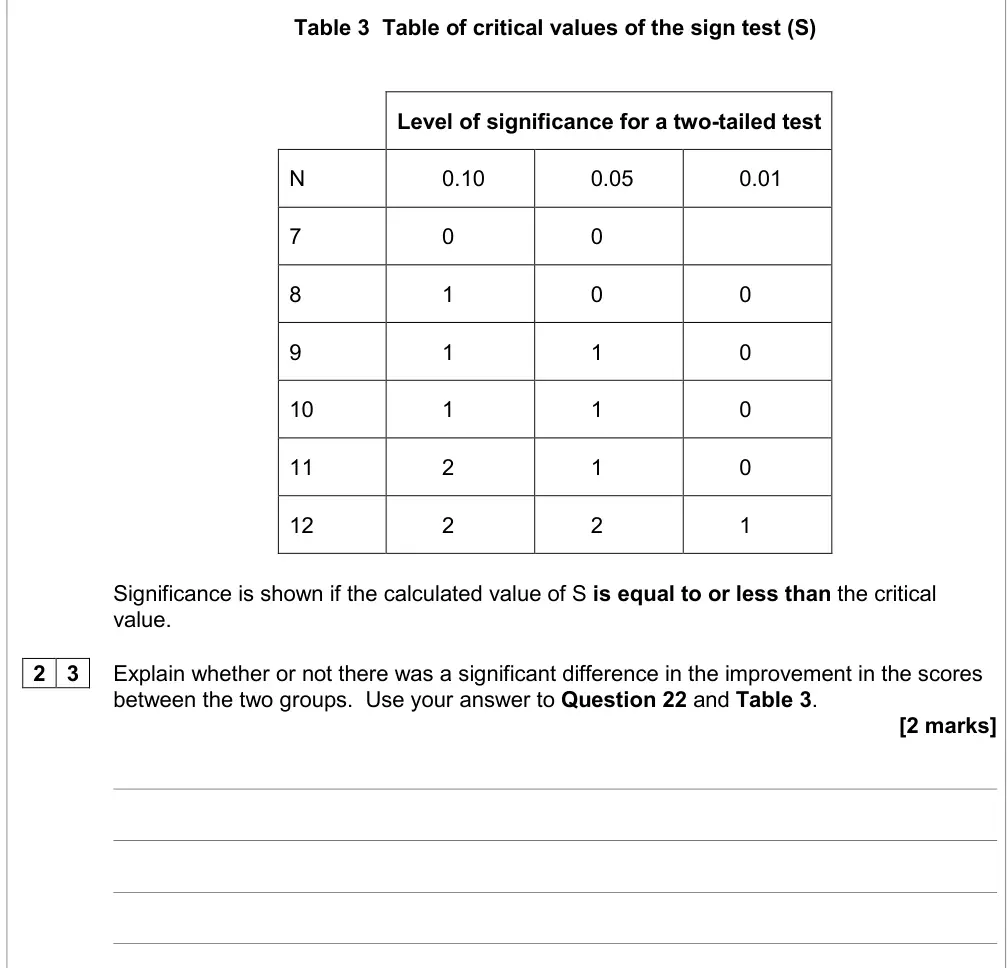
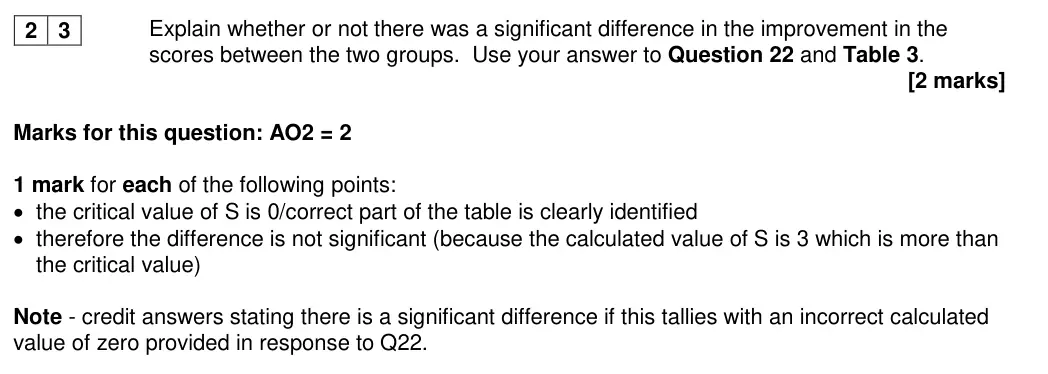
N = 8 after ties removed, critical value 0 at 0.05 two-tailed, so not significant
common error using N = 10 (critical value 1)
answers with no justification
error carried forward accepted from Q22
June 2019 · Paper 2 · Q274 marksAO2=2, AO3=2Research methods
Mark scheme, including level descriptors and indicative content
Examiner's comment
This question discriminated well. Most students were able to identify a range of correct reasons but often got the name of the test incorrect. Those who chose an unrelated t-test were able to gain credit for justifying this by identifying the data as interval data, which was considered acceptable at this level. Some students suggested Chi-Square test as a suitable test but many were unable to justify why the data collected would be at a nominal level.
Notes from the mark scheme and report
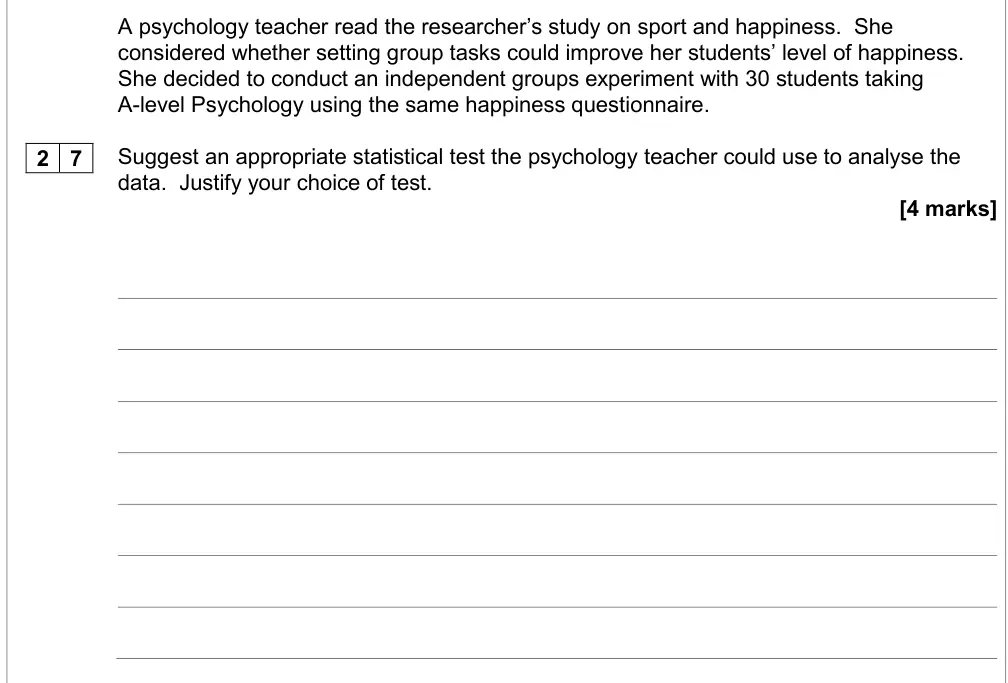
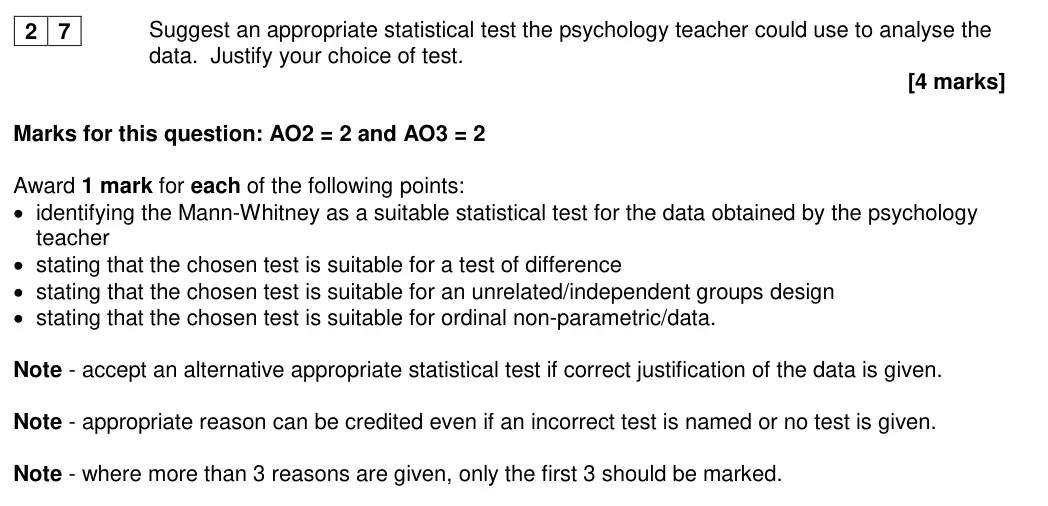
Mann-Whitney: test of difference, independent groups, ordinal data (1 mark each, max first 3 reasons)
unrelated t-test accepted if justified by interval data
reasons credited even if test wrong
Chi-squared rarely justified
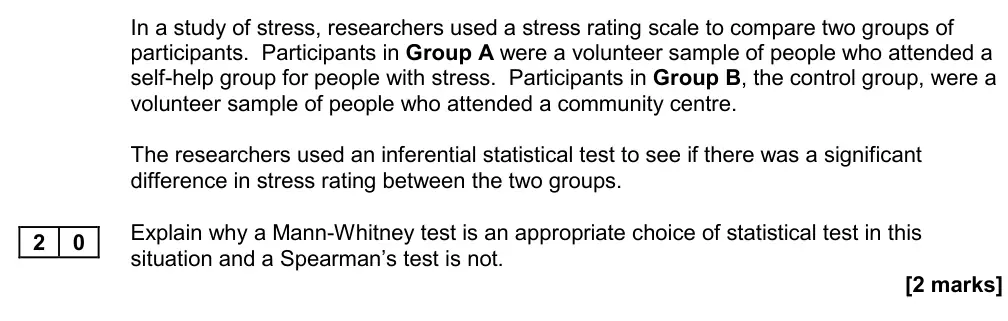
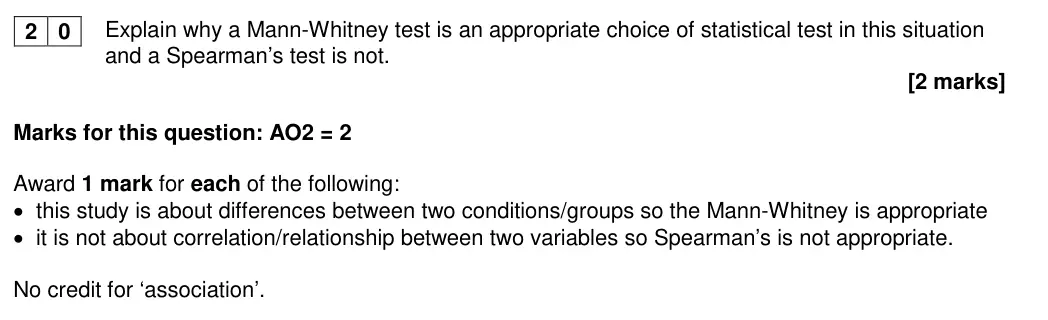
June 2019 · Paper 3 · Q122 marksAO2=2Research methods
Mark scheme, including level descriptors and indicative content
Examiner's comment
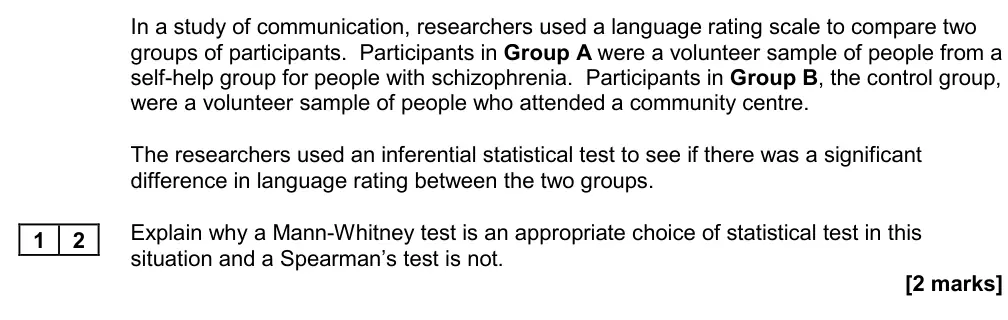
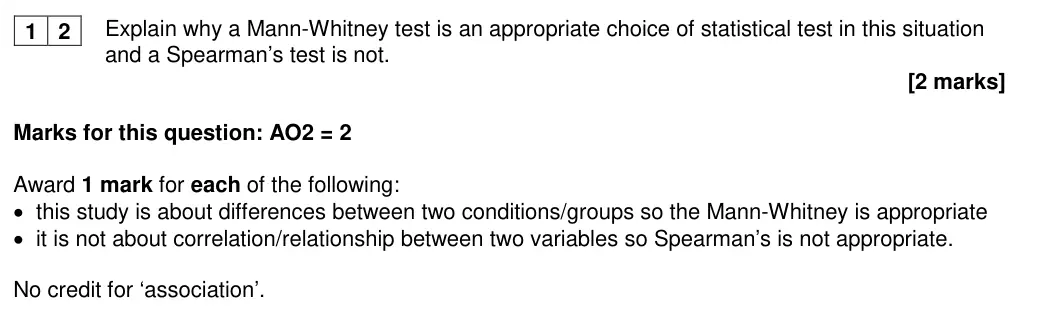
This question discriminated between those students who could apply their knowledge and those who just reiterated information from a test decision chart or similar. The most effective answers were the most economical ones which simply stated ‘because Mann-Whitney tests for a difference whereas Spearman’s tests for a correlation/relationship’. Some students got the right answer but took a very long time to get there because they recounted all the conditions for each test, incidentally happening upon difference and correlation along the way. Many students noted that Mann-Whitney was for differences but forget to mention that Spearman’s was for correlation, or mistakenly suggested that Spearman’s was a test of association. This confusion perhaps arose because many test decision charts have the alternate heading ‘correlation/association’. Some answers gained no credit because they focused on factors affecting choice of test that were irrelevant to the question, for example, the level of measurement or the experimental design.
Notes from the mark scheme and report
Mann-Whitney tests difference between two groups
Spearman's tests correlation/relationship
'association' not credited
level of measurement/design irrelevant here
June 2019 · Paper 3 · Q162 marksAO2=2Research methods
Mark scheme, including level descriptors and indicative content
Examiner's comment
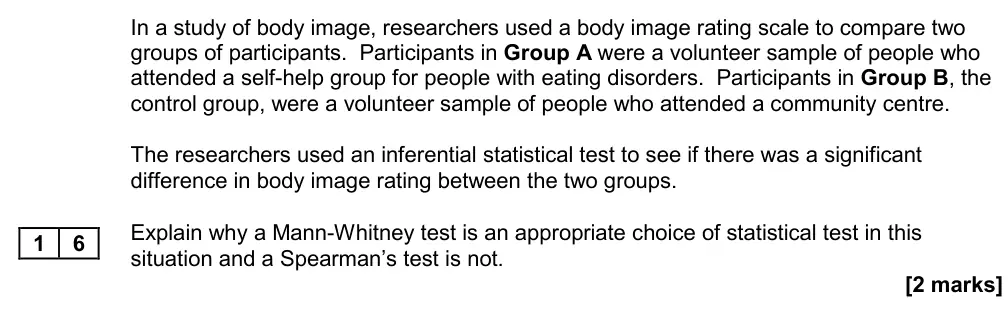
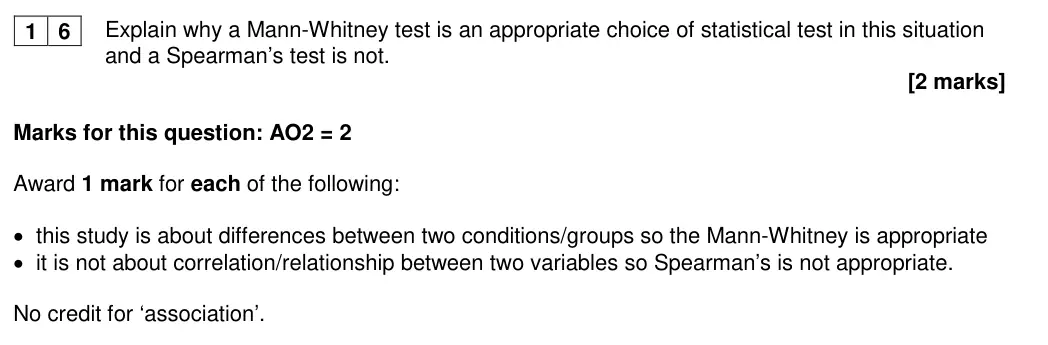
This question discriminated between those students who could apply their knowledge and those who just reiterated information from a test decision chart or similar. The most effective answers were the most economical ones which simply stated ‘because Mann-Whitney tests for a difference whereas Spearman’s tests for a correlation/relationship’. Some students got the right answer but took a very long time to get there because they recounted all the conditions for each test, incidentally happening upon difference/correlation along the way. Many students noted that Mann- Whitney was for differences but forget to mention that Spearman’s was for correlation, or mistakenly suggested that Spearman’s was a test of association. This confusion perhaps arose because many test decision charts have the alternate heading ‘correlation/association’. Some answers gained no credit because they focused on factors affecting choice of test that were irrelevant to the question, for example, the level of measurement or the experimental design.
Notes from the mark scheme and report
Mann-Whitney = difference between two groups
Spearman's = correlation
'association' not credited
June 2019 · Paper 3 · Q202 marksAO2=2Research methods
Mark scheme, including level descriptors and indicative content
Examiner's comment
This question discriminated between those students who could apply their knowledge and those who just reiterated information from a test decision chart or similar. The best answers were the most economical ones which simply stated ‘because Mann-Whitney tests for a difference whereas Spearman’s tests for a correlation/relationship’. Some students got the right answer but took a very long time to get there because they recounted all the conditions for each test, incidentally happening upon difference/correlation along the way. Many students noted that Mann-Whitney was for differences but forget to mention that Spearman’s was for correlation, or mistakenly suggested that Spearman’s was a test of association. This confusion perhaps arose because many test decision charts have the alternate heading ‘correlation/association’. Some answers gained no credit because they focused on factors affecting choice of test that were irrelevant to the question, for example, the level of measurement or the experimental design.
Notes from the mark scheme and report
Mann-Whitney = difference between two groups
Spearman's = correlation
'association' not credited
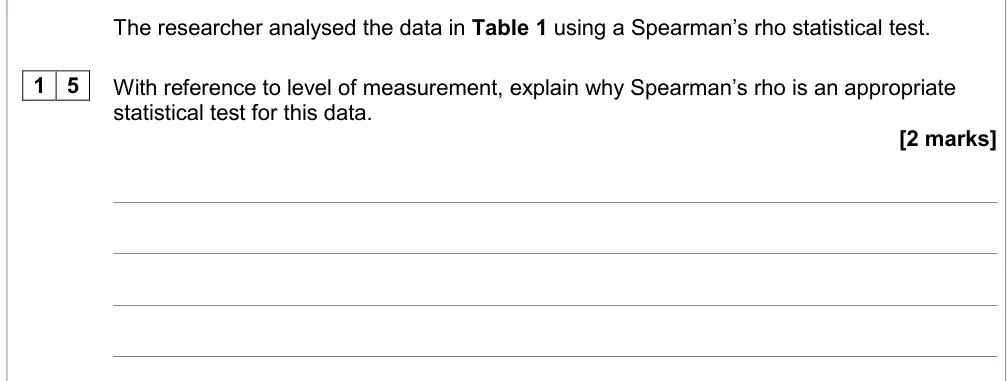
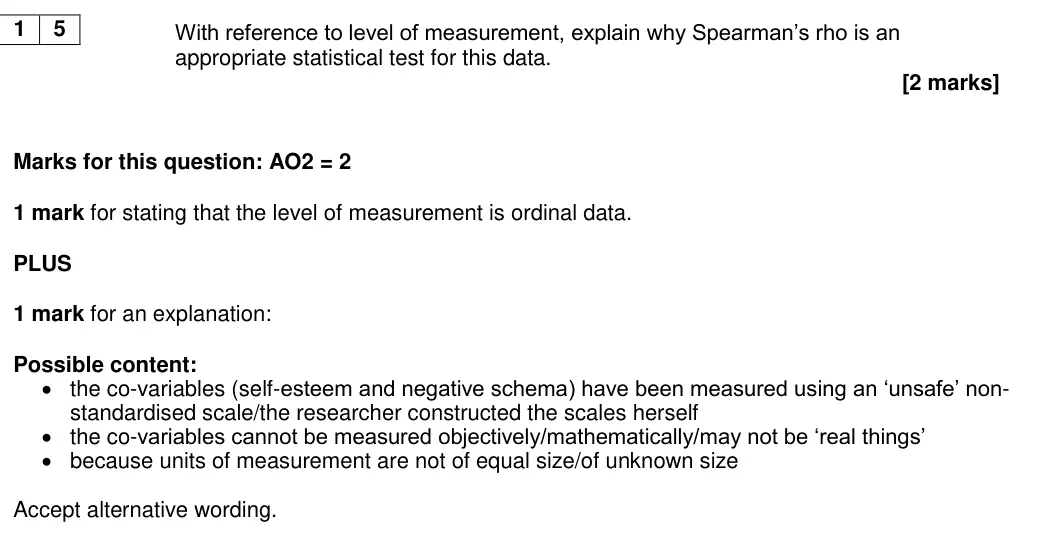
June 2018 · Paper 1 · Q152 marksAO2=2Research methods
Mark scheme, including level descriptors and indicative content
Examiner's comment
This question required reference to ‘level of measurement’. Although the majority of answers could identify ordinal data for 1 mark, very few went on to characterise ordinal data or why this study produced ordinal data, which would have fully justified the use of Spearman’s rho.
June 2018 · AS Paper 2 · Q64 marksAO2=4Research methods
Mark scheme, including level descriptors and indicative content
Examiner's comment
There were some excellent responses to this question in which students demonstrated clear and detailed understanding of why a sign test would be an appropriate statistical test to use on the data in this study. Unfortunately, although some responses were clear and detailed, a minority failed to apply this to the data in this study and were limited to Level 1. Some students appeared to have very limited or no knowledge of the sign test and there were a number of ‘blank’ responses where no answer was attempted. Additionally, some students only demonstrated knowledge of how to perform a sign test not reasons why it would be used. It is expected that as the Sign test is the only introduction to statistical testing, students will be aware of the reason(s) why statistical testing is applied to raw data of the type fitting application of a Sign test. There were many possible accurate responses to this question and students could choose one in detail or more than one in less detail. It is important to note that although students could refer to level of measurement there is no requirement for them to know this information to be able to answer this question, as it does not appear on the AS level specification.
Notes from the mark scheme and report
test of difference, one group tested twice (repeated measures), chance vs real effect, nominal/category data (level of measurement credited but not expected at AS)
unapplied answers = Level 1
describing how to do the test not credited
June 2018 · Paper 2 · Q262 marksAO2=2Research methods
Mark scheme, including level descriptors and indicative content
Examiner's comment
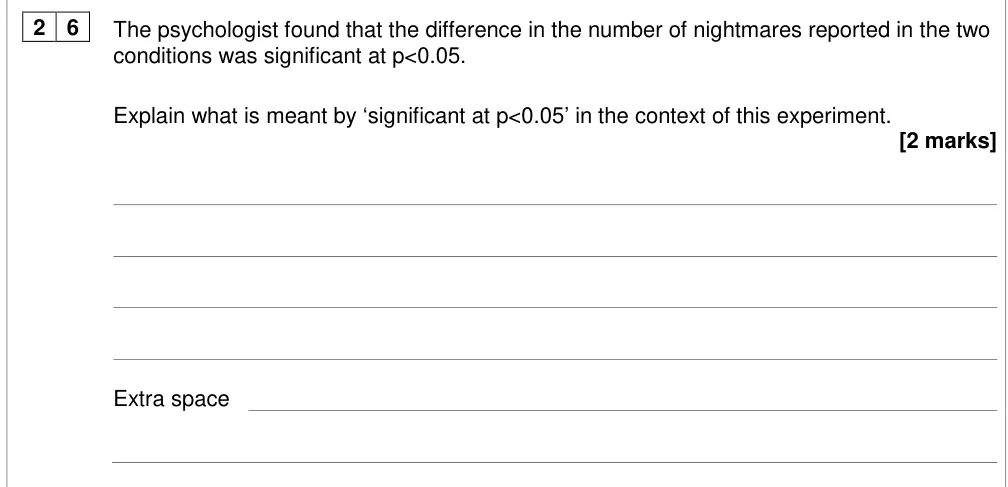
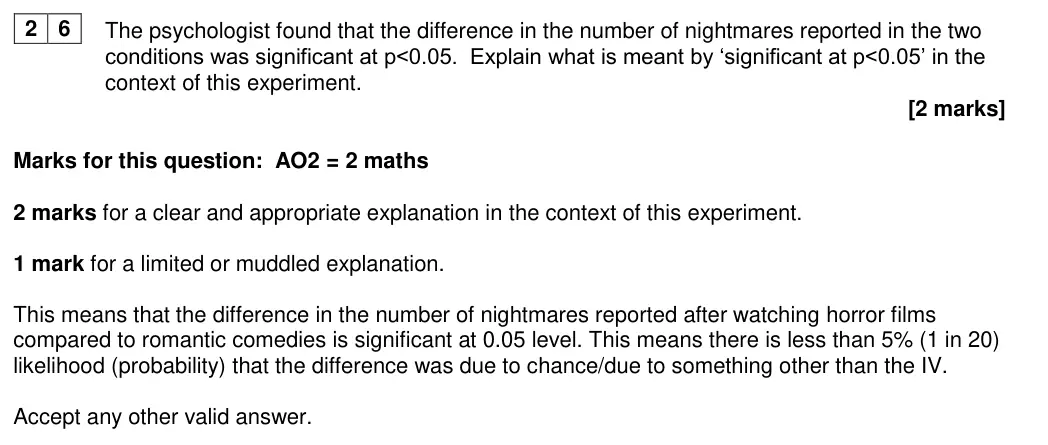
This question was a good differentiator, with some excellent responses by students who clearly explained what ‘significant at p<0.05’ meant and successfully managed to do so in the context of the experiment. Weaker students generally gave a rote learned reason for why psychologists generally use the 5% level or failed to contextualise their response. Unfortunately, many students failed to explain that the ‘<0.05’ sign meant less than 5%. Teachers should ensure that students are familiar with the mathematical symbols required by the new specification.
Notes from the mark scheme and report
less than 5% probability the difference in nightmares was due to chance, in context
many failed to explain '<0.05' means less than 5%
rote answers about why 5% is used
June 2017 · Paper 1 · Q42 marksAO2=2Research methods
Mark scheme, including level descriptors and indicative content
Examiner's comment
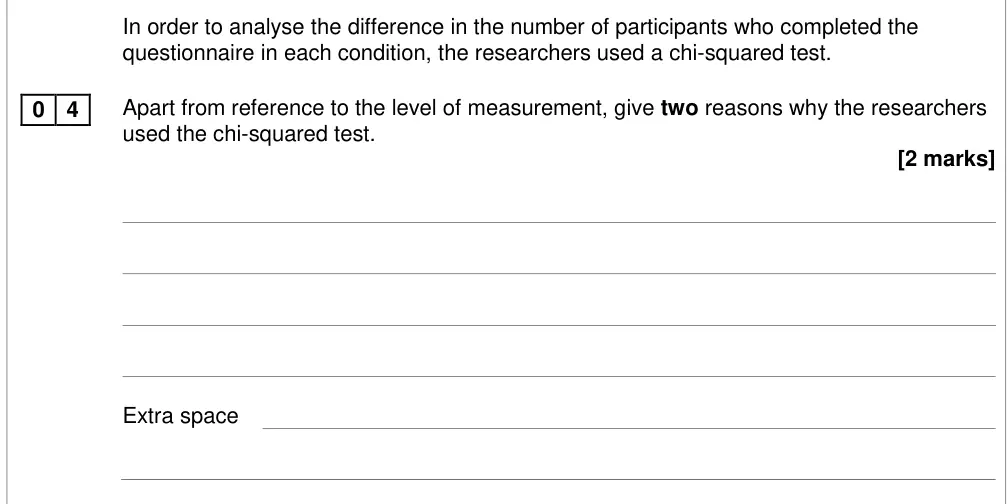
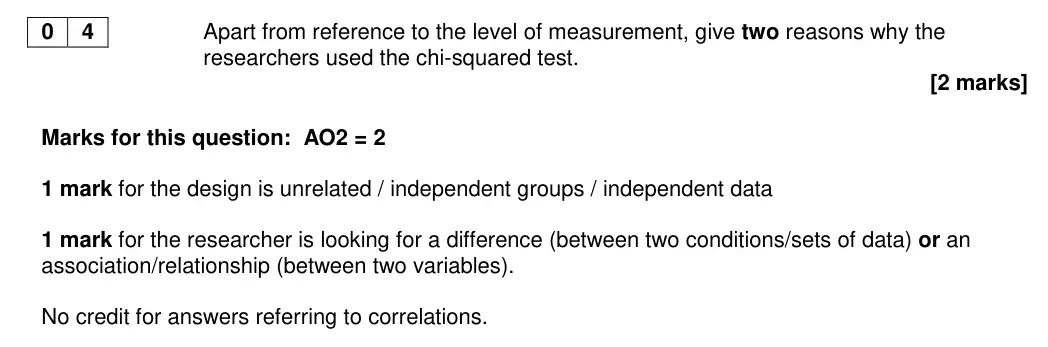
Despite the injunction a number of students still referred to the level of measurement as a reason for using chi-square. Otherwise this question was done well, with many answers covering the requirement for independent data and a test of difference (between conditions) or association (between variables). Answers referring to correlation did not receive credit.
Notes from the mark scheme and report
independent groups/unrelated design + test of difference/association
level of measurement excluded by the question yet many still gave it
correlation = 0
June 2017 · Paper 1 · Q52 marksAO2=2Research methods
Mark scheme, including level descriptors and indicative content
Examiner's comment
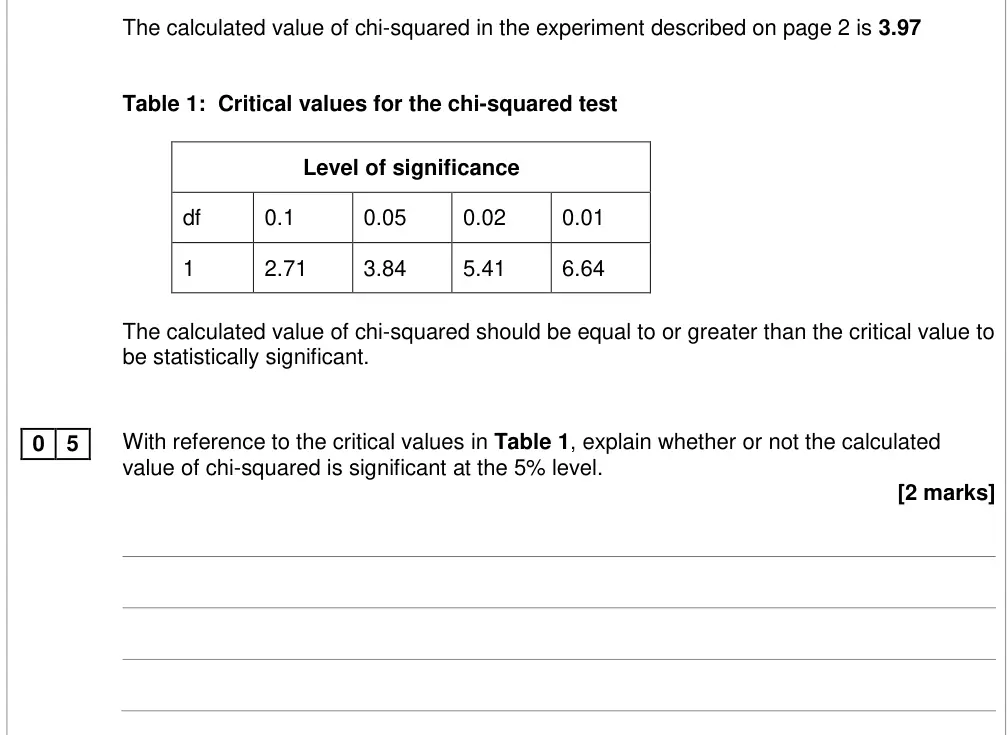
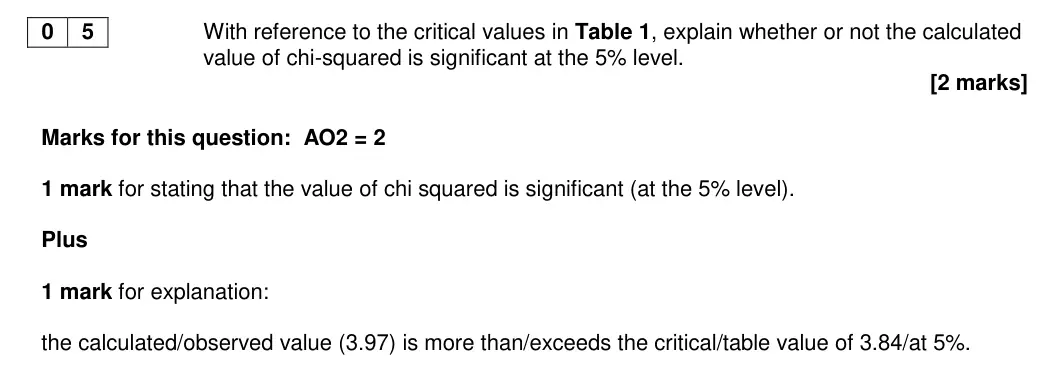
The majority of students demonstrated understanding the relationship between calculated and critical values, and the link to the chosen significance level. A few were confused as to which was the calculated and which was the critical value.
Notes from the mark scheme and report
significant: 3.97 exceeds critical value 3.84 at 0.05
some confused calculated and critical values
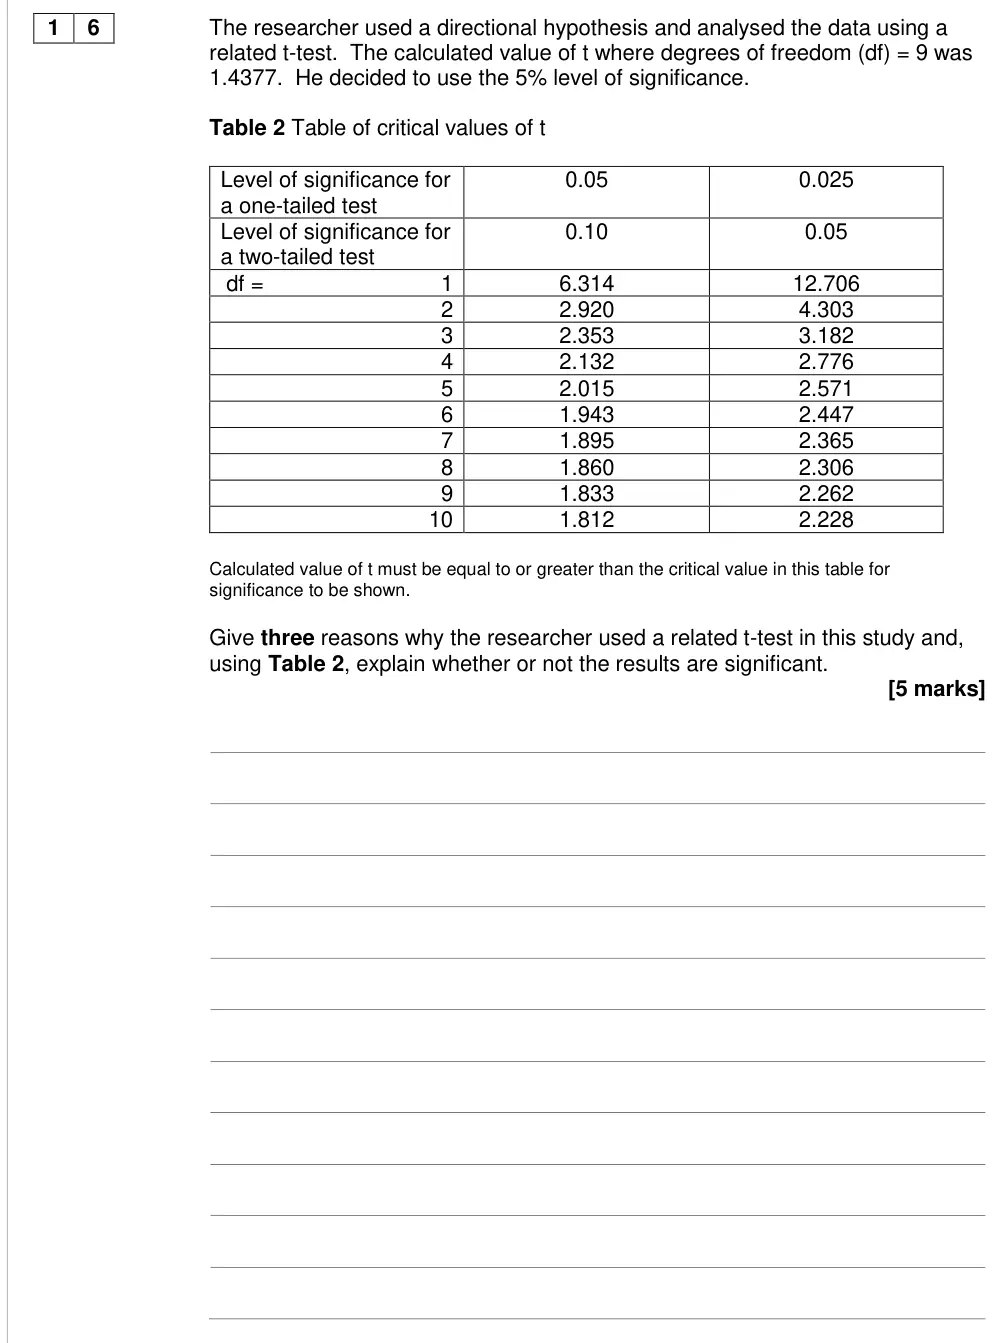
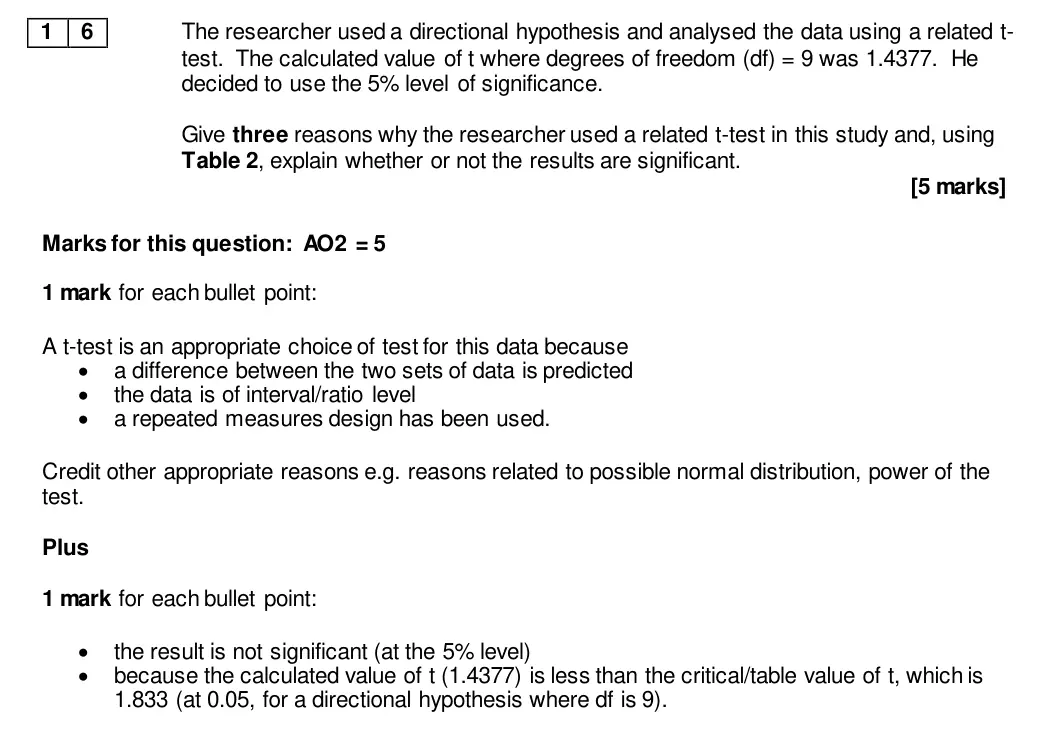
June 2017 · Paper 2 · Q165 marksAO2=5Research methodsEasy
Mark scheme, including level descriptors and indicative content
Examiner's comment
Questions that discriminated the best were 03, 04, 09, 16, 17 and 21. This question was generally answered very well, with the majority of students achieving all five marks. Impressively, nearly all students identified the points in mark scheme for choice of test and most could justify why the result was not significant, although a few picked the wrong critical value from the table.
Notes from the mark scheme and report
3 reasons (difference, interval data, repeated measures) + not significant because 1.4377 < critical value 1.833 (one-tailed, df 9)
some picked wrong critical value
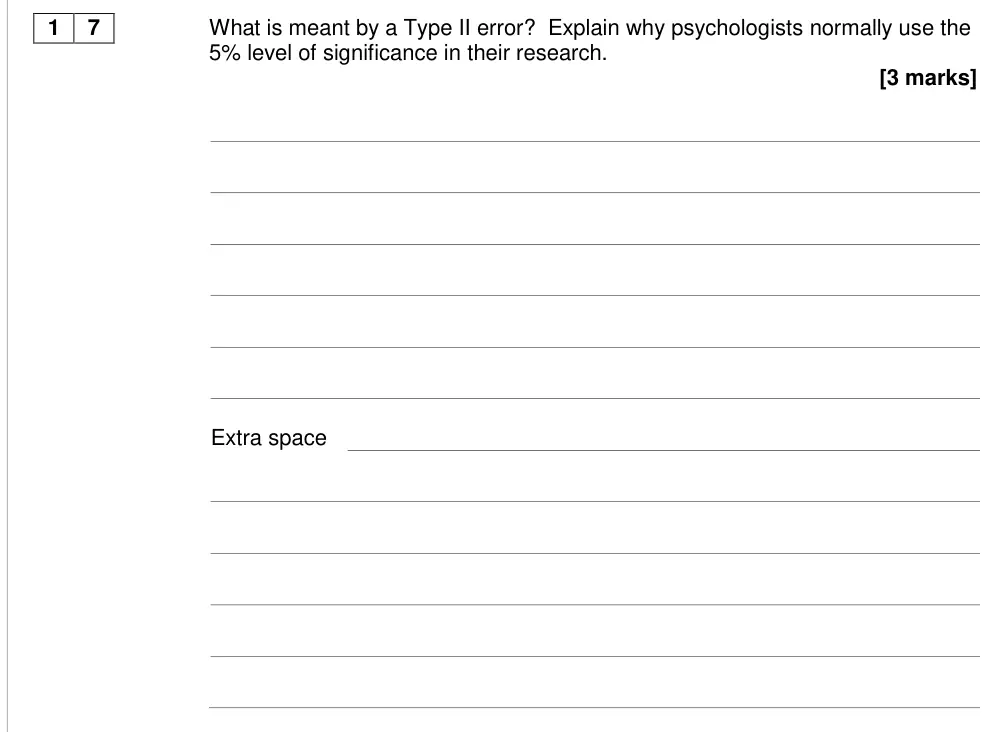
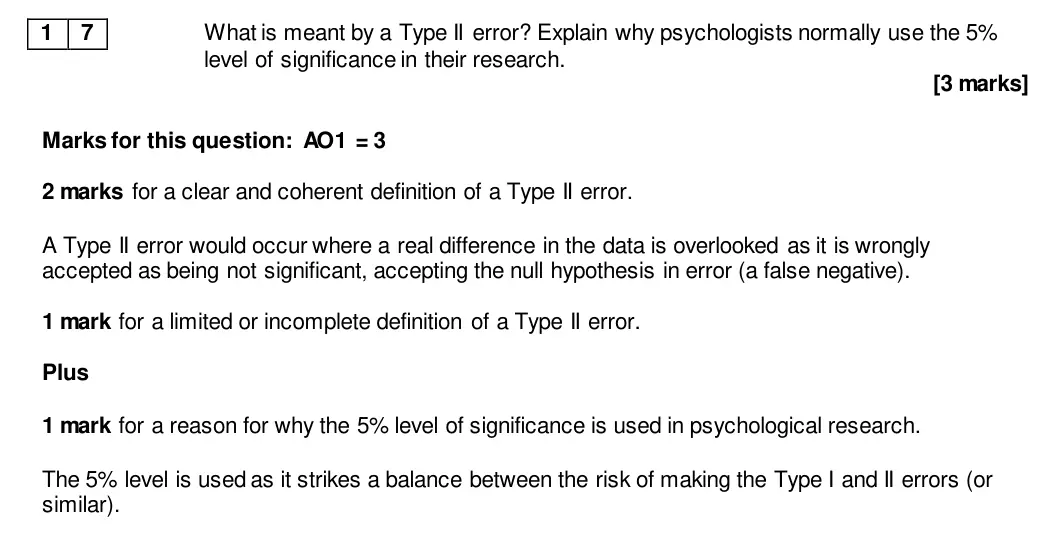
June 2017 · Paper 2 · Q173 marksAO1=3Research methods
Mark scheme, including level descriptors and indicative content
Examiner's comment
Questions that discriminated the best were 03, 04, 09, 16, 17 and 21. Many students could correctly define a Type II error, although there was some limited descriptions and some confusion between Type I and Type II errors. Few students managed a coherent response to the second part of question, requiring an explanation as to why the 5% level is normally used in research. Many were not clear about the balance between making Type I and Type II errors, suggesting that a 5% level prevented these errors from occurring. Weaker students did little beyond stating that it is used because of convention.
Notes from the mark scheme and report
2 marks Type II definition (false negative, null wrongly retained) + 1 mark 5% balances risk of Type I and II errors
'convention' only not credited
confusion between Type I and II
Specimen set 2 · Paper 1 · Q124 marksAO2=4Research methods
Mark scheme, including level descriptors and indicative content
Notes from the mark scheme and report
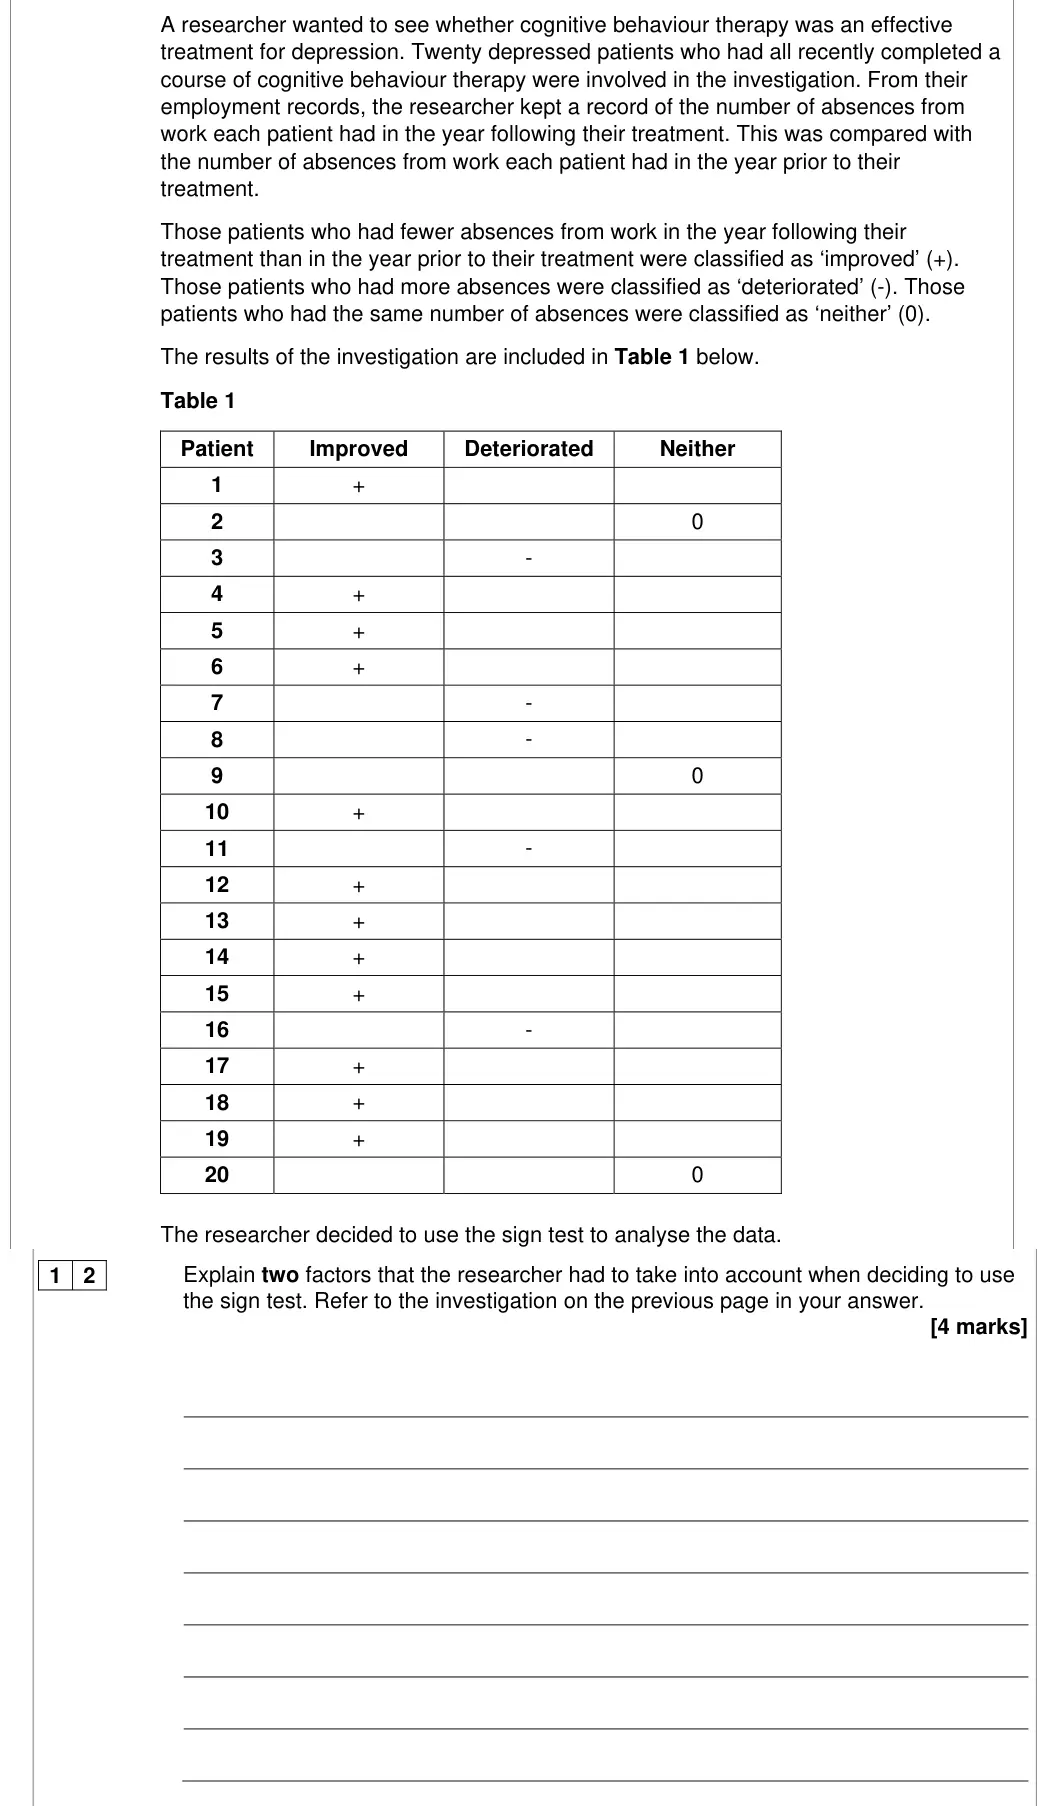
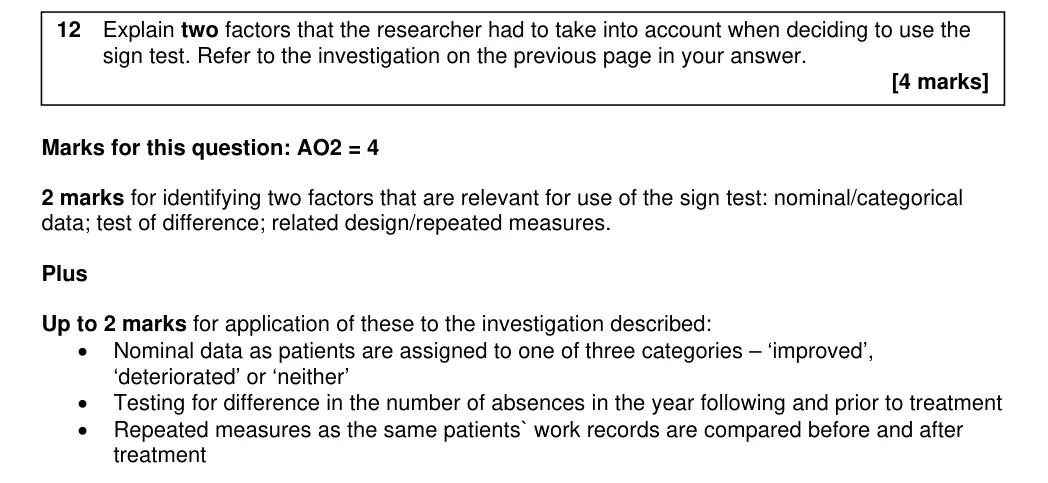
2 marks for factors (nominal data, test of difference, related/repeated measures design) + 2 for application to the absence-record study
Specimen set 2 · Paper 1 · Q132 marksAO2=2Calculation
Mark scheme, including level descriptors and indicative content
Notes from the mark scheme and report
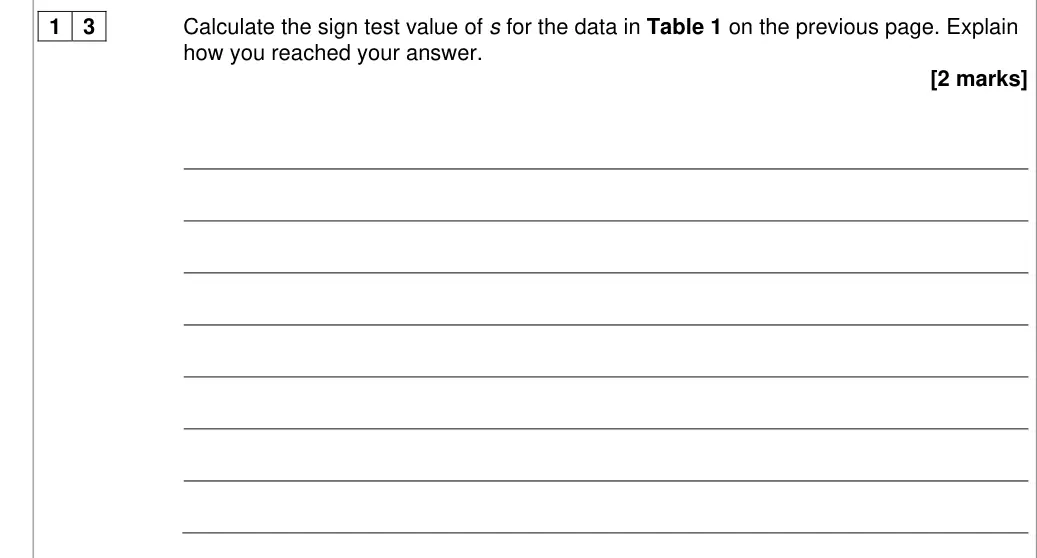
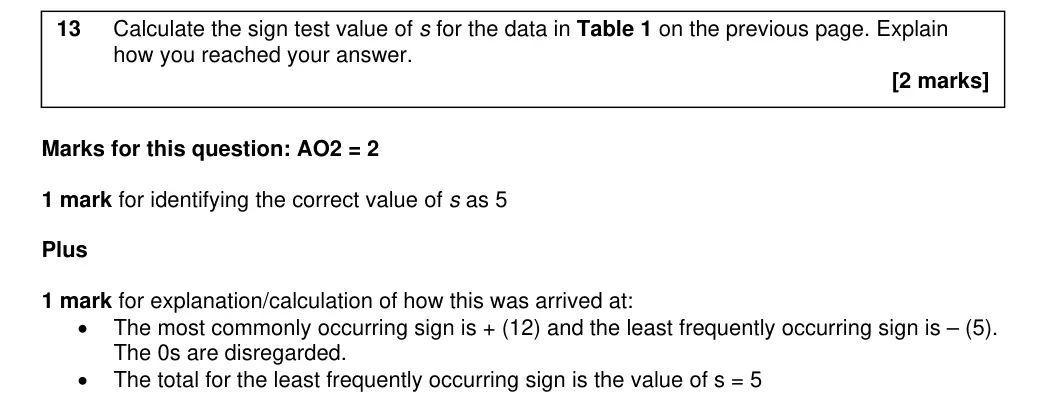
s = 5
12 +, 5 -, 3 zeros disregarded
s is the less frequent sign
Specimen set 2 · Paper 1 · Q142 marksAO2=2Research methods
Mark scheme, including level descriptors and indicative content
Notes from the mark scheme and report
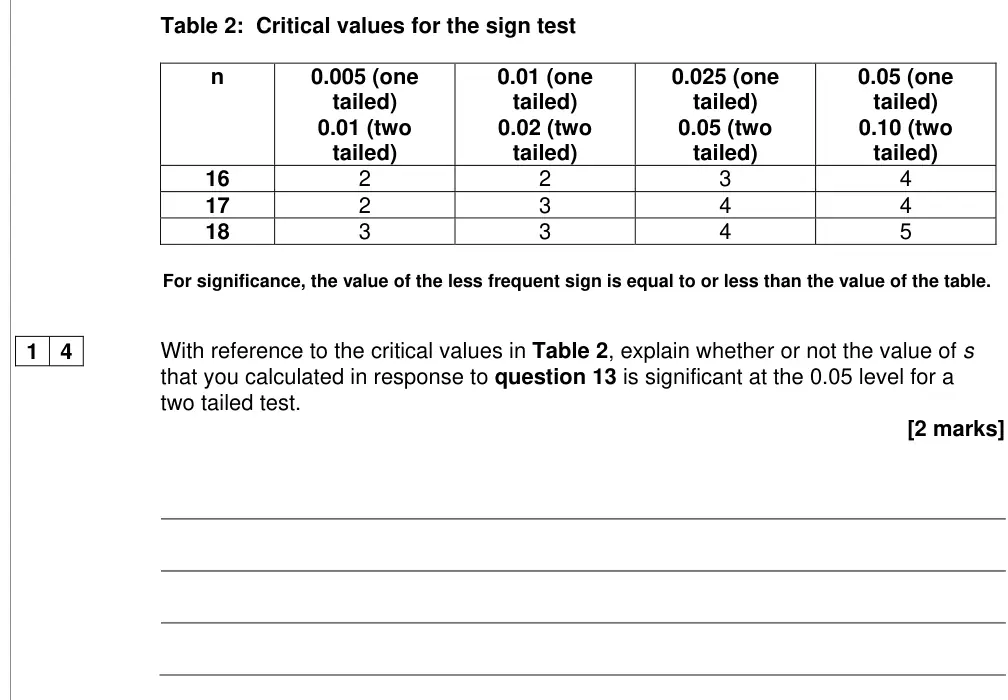
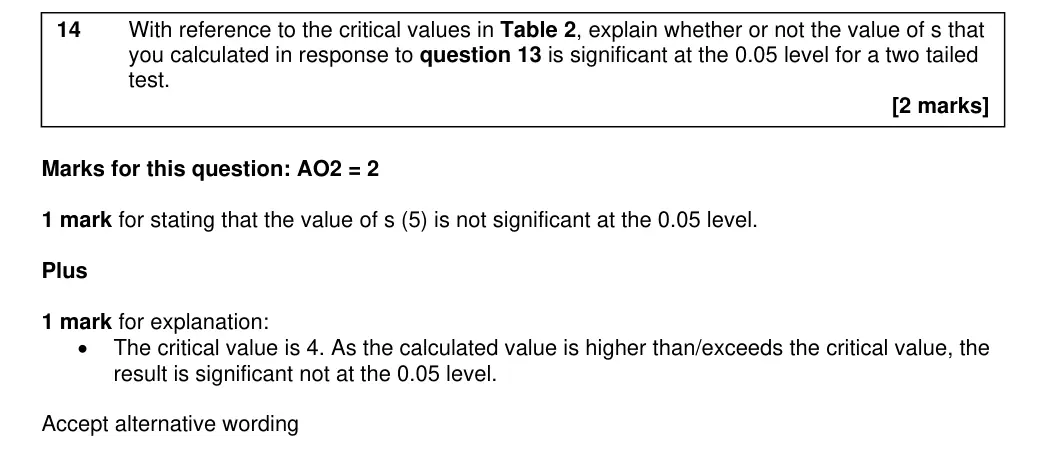
not significant + explanation: N = 17, critical value 4, s = 5 exceeds it
Specimen set 2 · Paper 2 · Q143 marksAO2=3Research methods
Mark scheme, including level descriptors and indicative content
Notes from the mark scheme and report
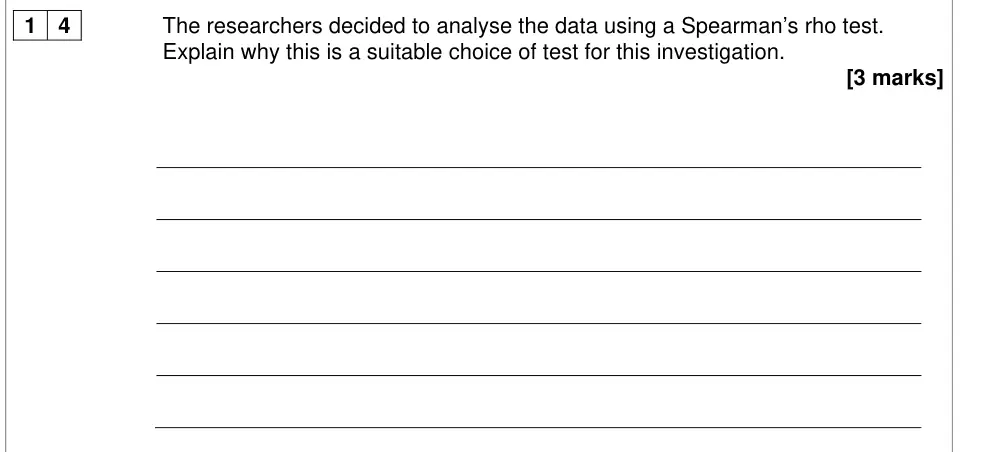
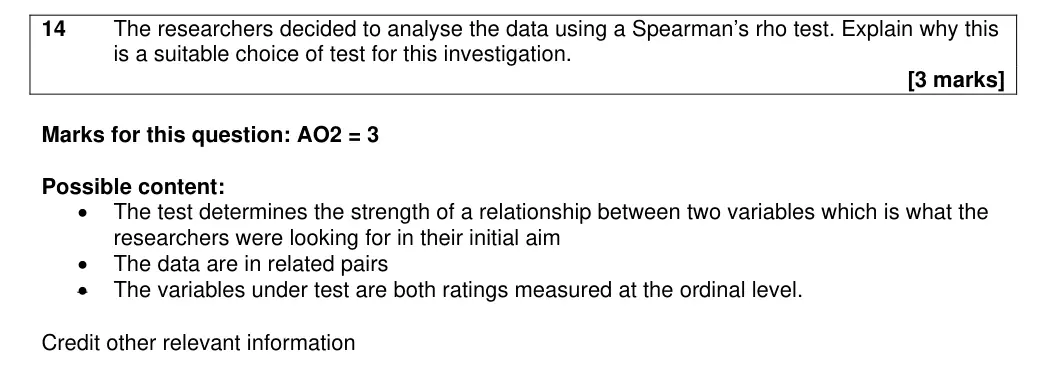
test of relationship/correlation, related pairs of data, ordinal (ratings) data
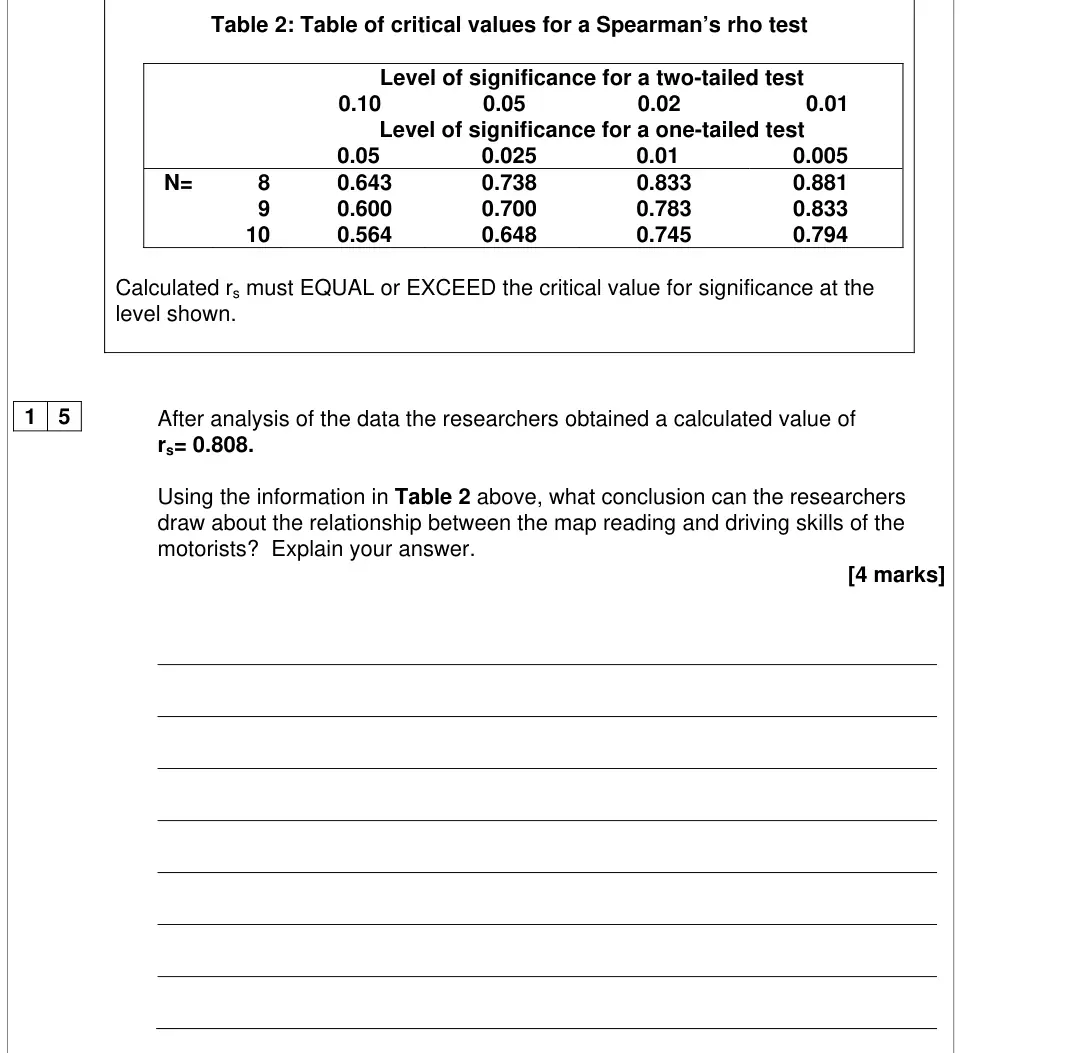
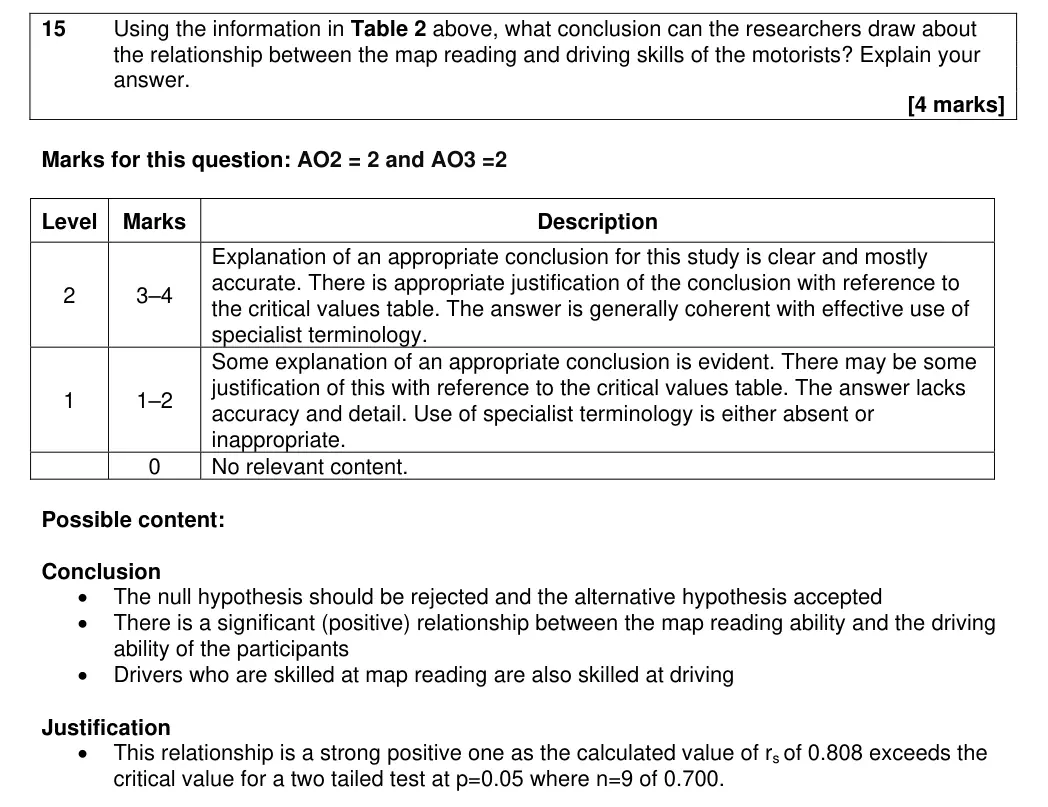
Specimen set 2 · Paper 2 · Q154 marksAO2=2, AO3=2Research methods
Mark scheme, including level descriptors and indicative content
Notes from the mark scheme and report
reject null, significant positive relationship
justify: rs 0.808 exceeds critical value 0.700 for two-tailed p=0.05, N=9 (non-directional hypothesis)
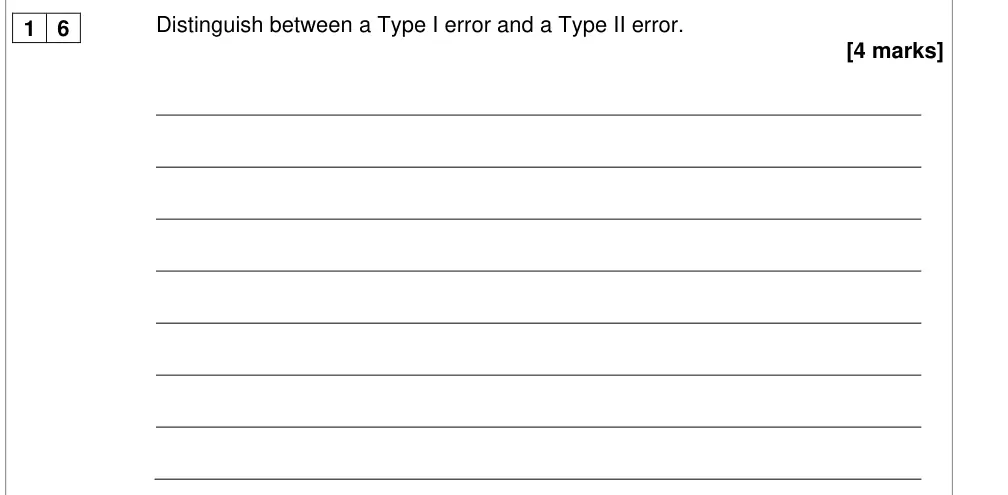
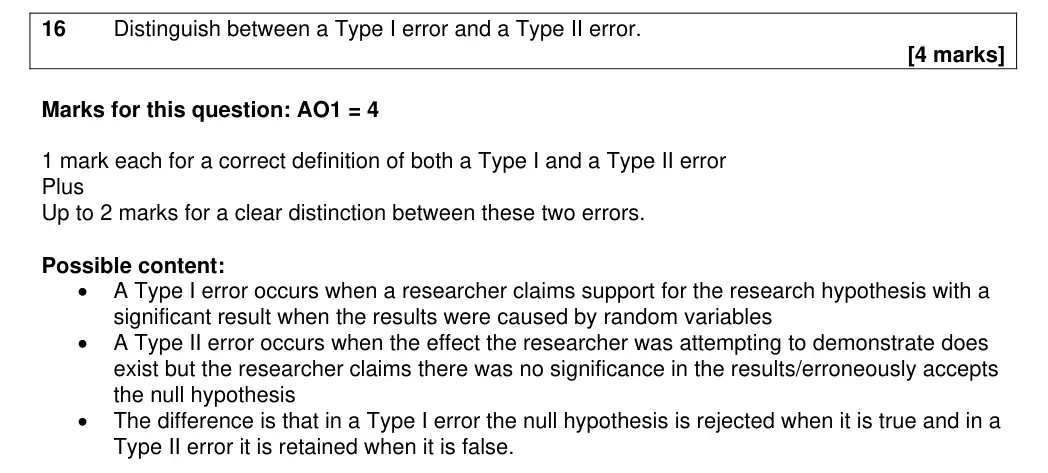
Specimen set 2 · Paper 2 · Q164 marksAO1=4Research methods
Mark scheme, including level descriptors and indicative content
Notes from the mark scheme and report
1 mark each definition + up to 2 for clear distinction (Type I: null wrongly rejected
Type II: null wrongly retained)
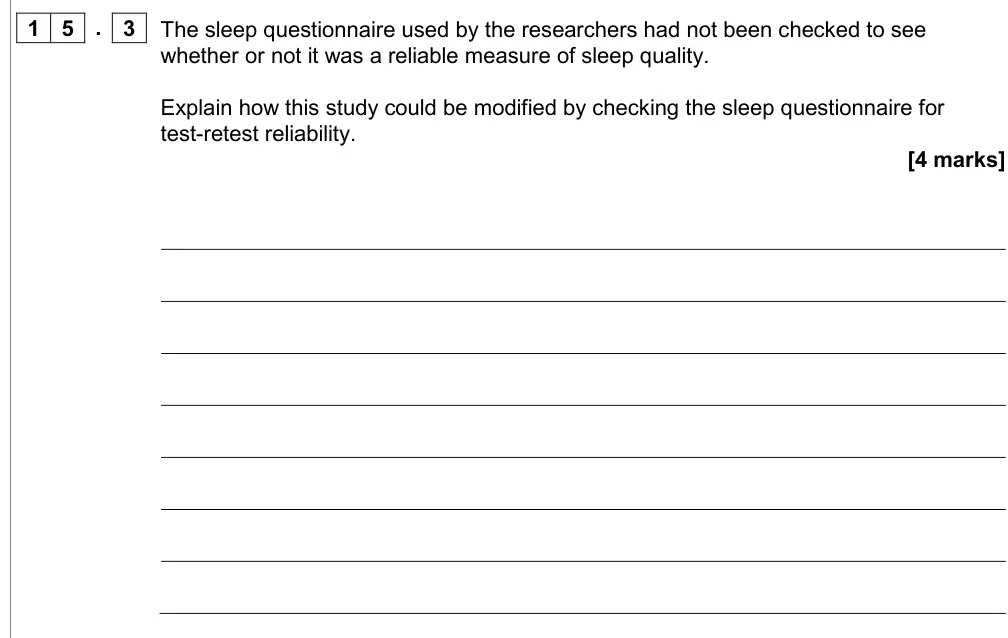
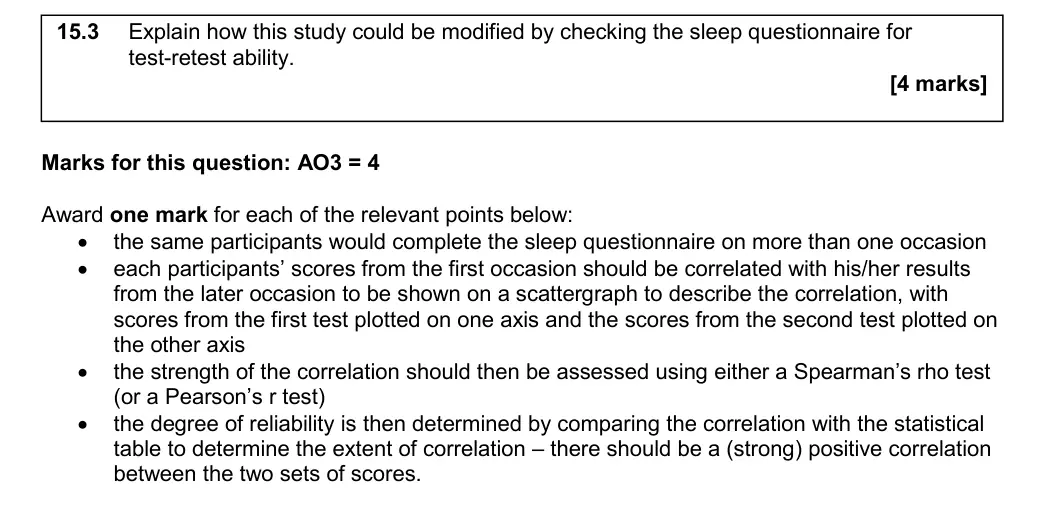
Specimen set 1 · Paper 1 · Q15.34 marksAO3=4Research methods
Mark scheme, including level descriptors and indicative content
Notes from the mark scheme and report
same participants complete questionnaire twice
correlate scores (scattergram)
Spearman's rho/Pearson's r
compare with critical value, strong positive correlation needed
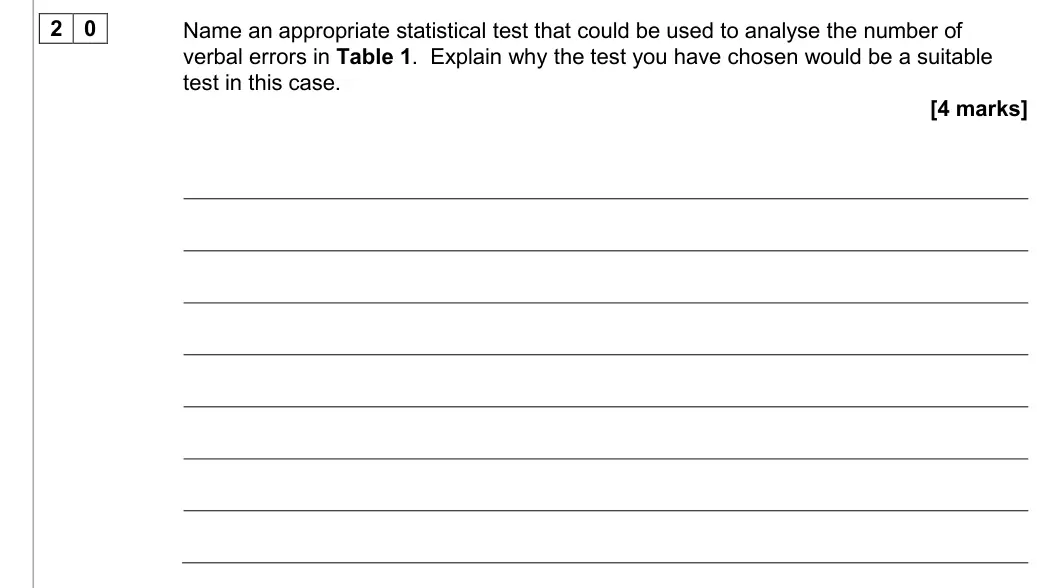
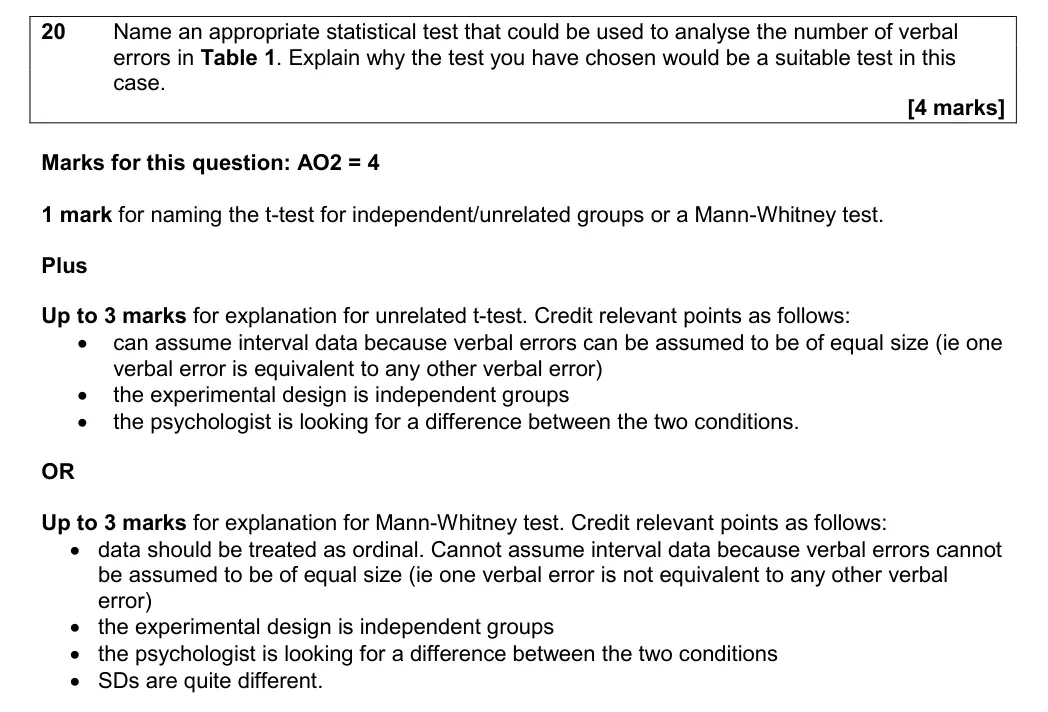
Specimen set 1 · Paper 2 · Q204 marksAO2=4Research methods
Mark scheme, including level descriptors and indicative content
Notes from the mark scheme and report
1 mark unrelated t-test or Mann-Whitney + up to 3: interval (or ordinal) data, independent groups, test of difference
SDs quite different supports Mann-Whitney
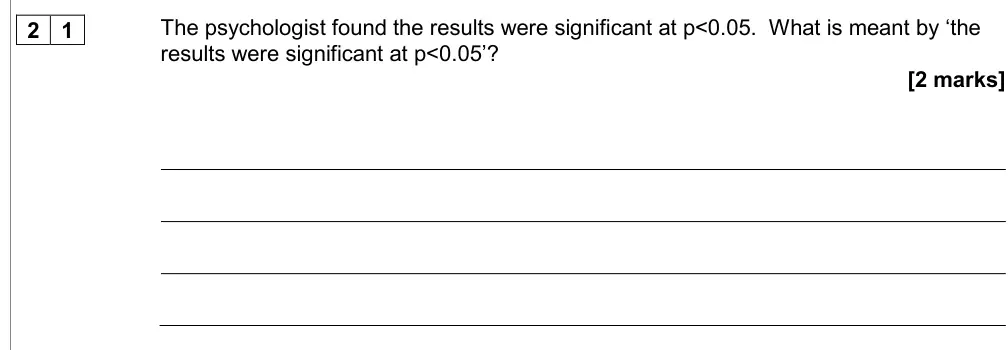
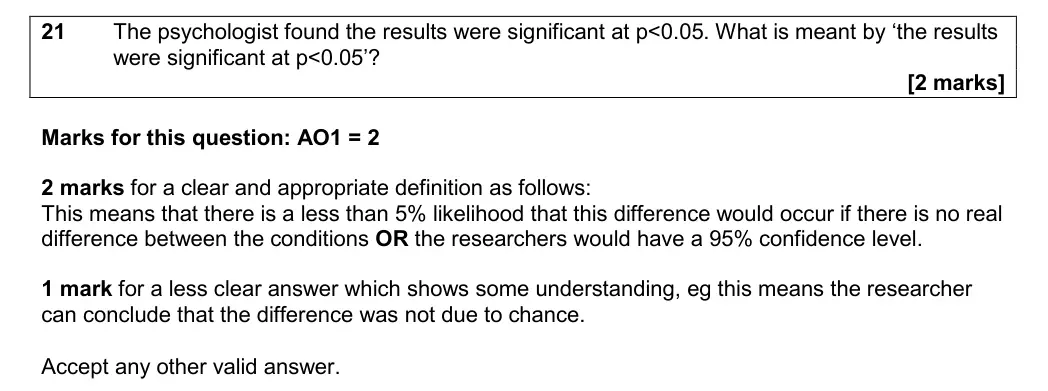
Specimen set 1 · Paper 2 · Q212 marksAO1=2Research methods
Mark scheme, including level descriptors and indicative content
Notes from the mark scheme and report
2 marks: less than 5% probability the difference would occur if no real difference (or 95% confidence)
'not due to chance' = 1 mark
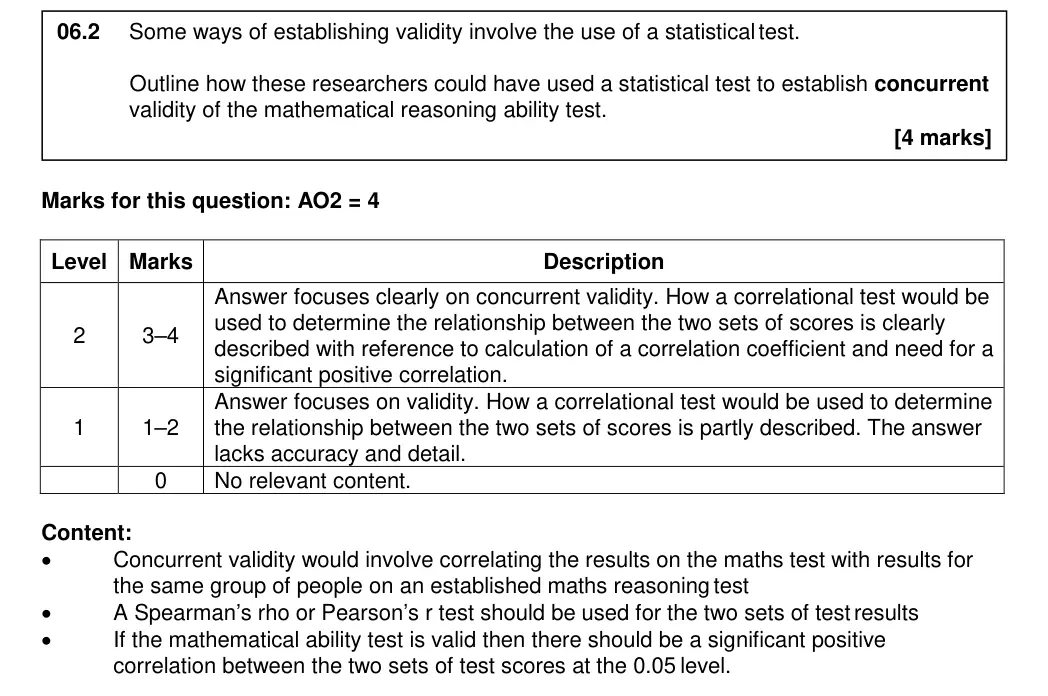
Specimen set 1 · Paper 3 · Q6.24 marksAO2=4Research methods
Mark scheme, including level descriptors and indicative content
Notes from the mark scheme and report
correlate scores with an established maths reasoning test on the same people
Spearman's rho or Pearson's r
valid if significant positive correlation
must focus on concurrent validity for Level 2
Work with an AQA psychology tutor
Essays not reaching the top band? Book a session with Andy, a former AQA examiner.