Research methods: data handling and analysis Paper 2
Paper
Paper 2
Level
AS and A level
Spec
4.2.3.2, 8 statements on the 2025 specification
Since 2016
179 question parts, 0 sixteen-mark essays, 14 multiple-choice items, plus 3 parts on content removed in 2025
Notes, key studies and practice items for this topic are being written by our tutors. The past-paper questions below are ready now.
Specification statements
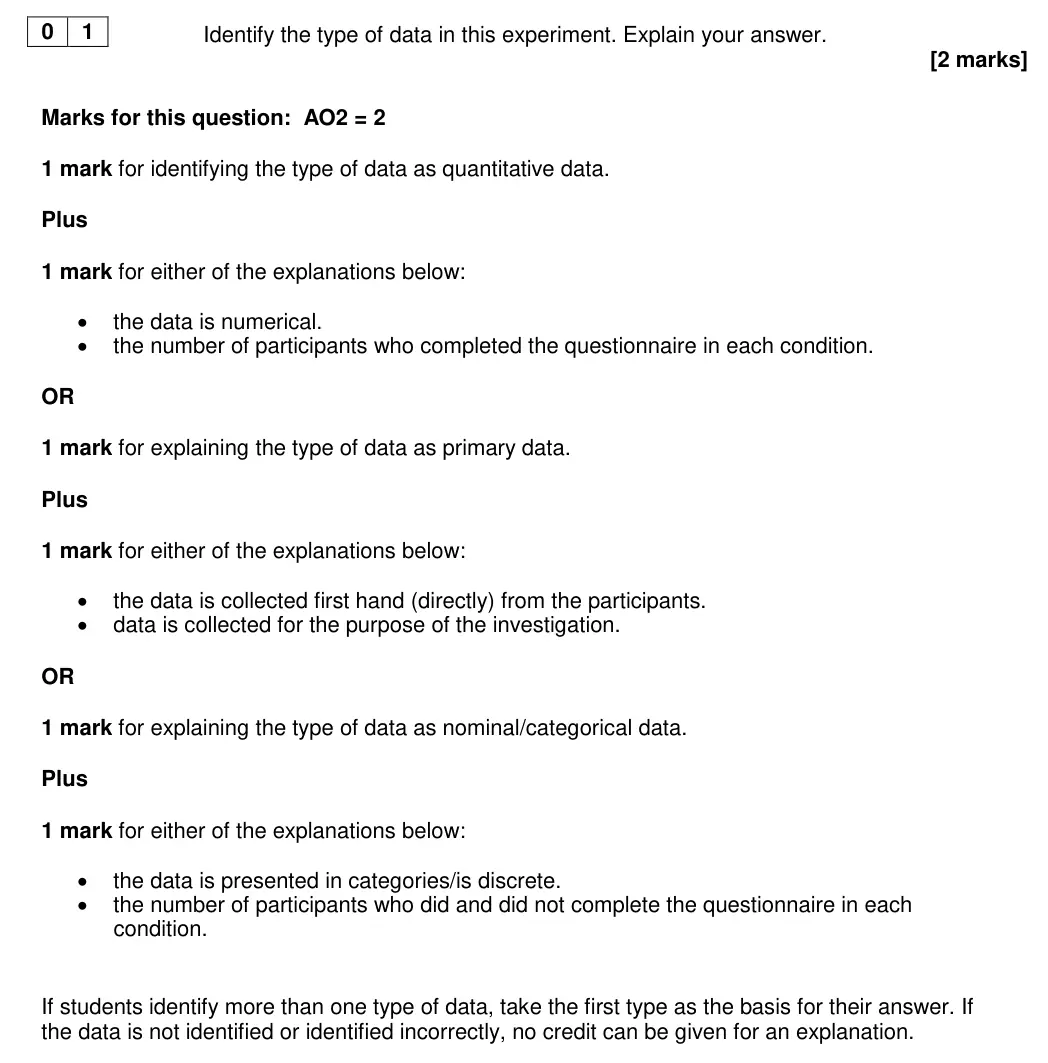
4.2.3.2-01 Quantitative and qualitative data; the distinction between qualitative and quantitative data collection techniques.AS
4.2.3.2-02 Primary and secondary data, including meta-analysis.AS
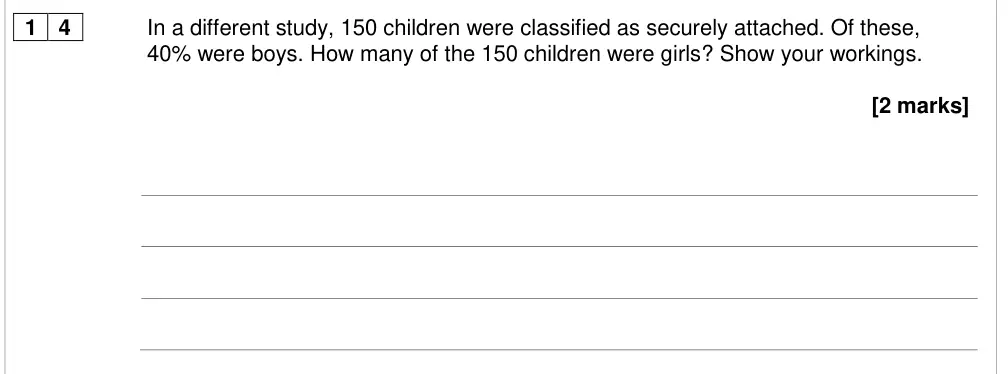
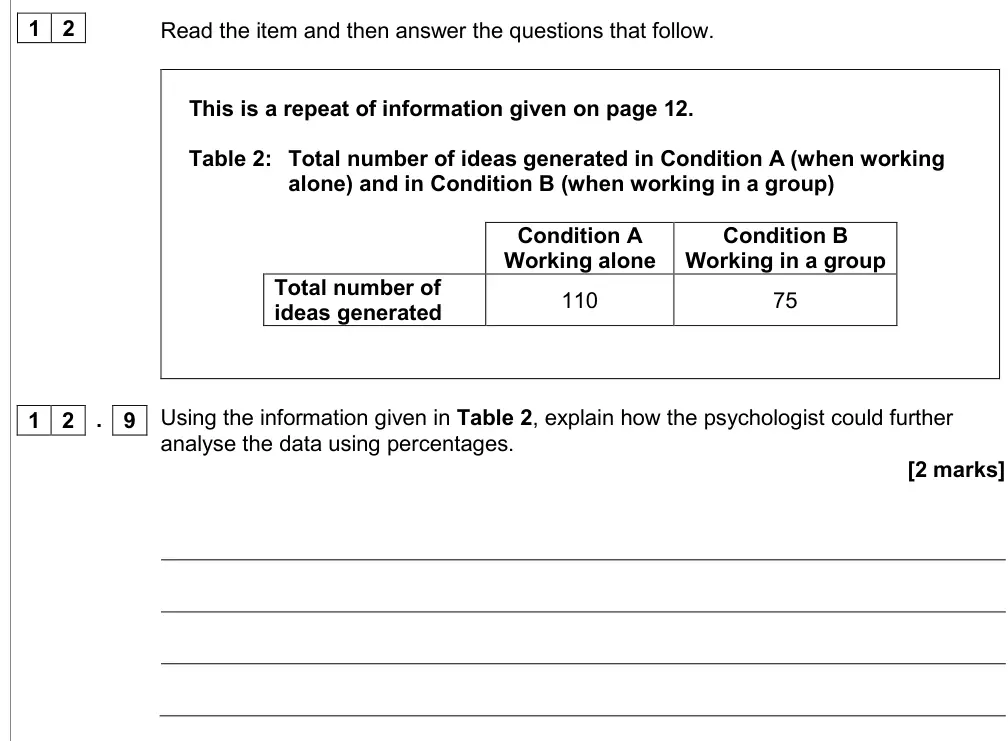
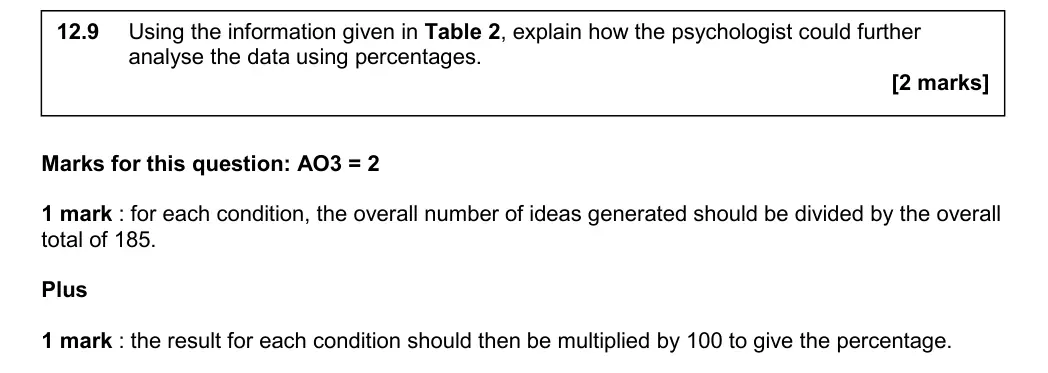
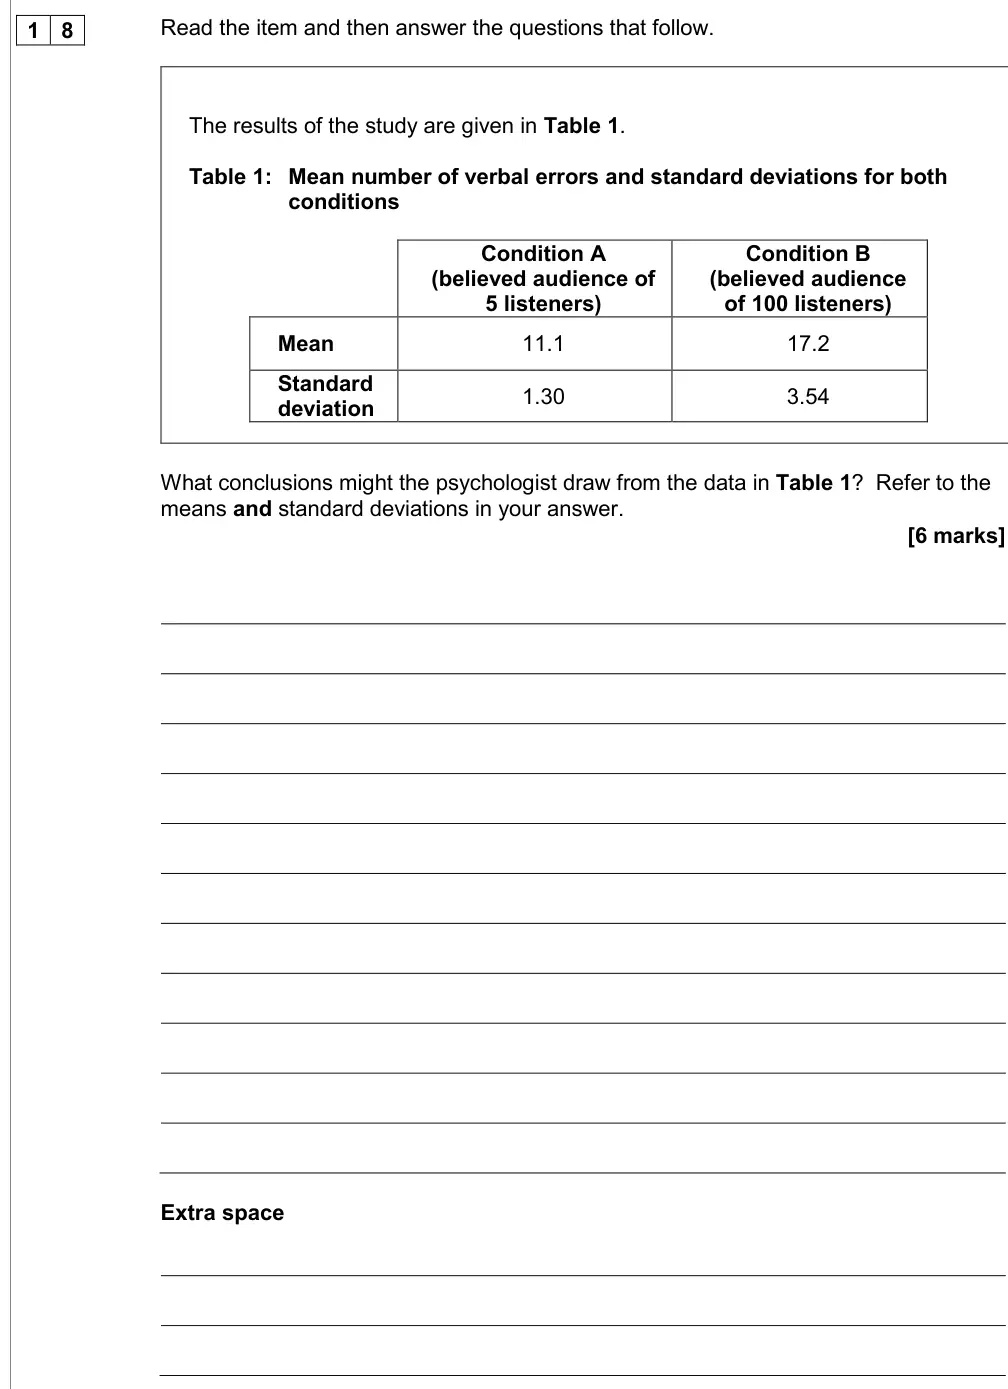
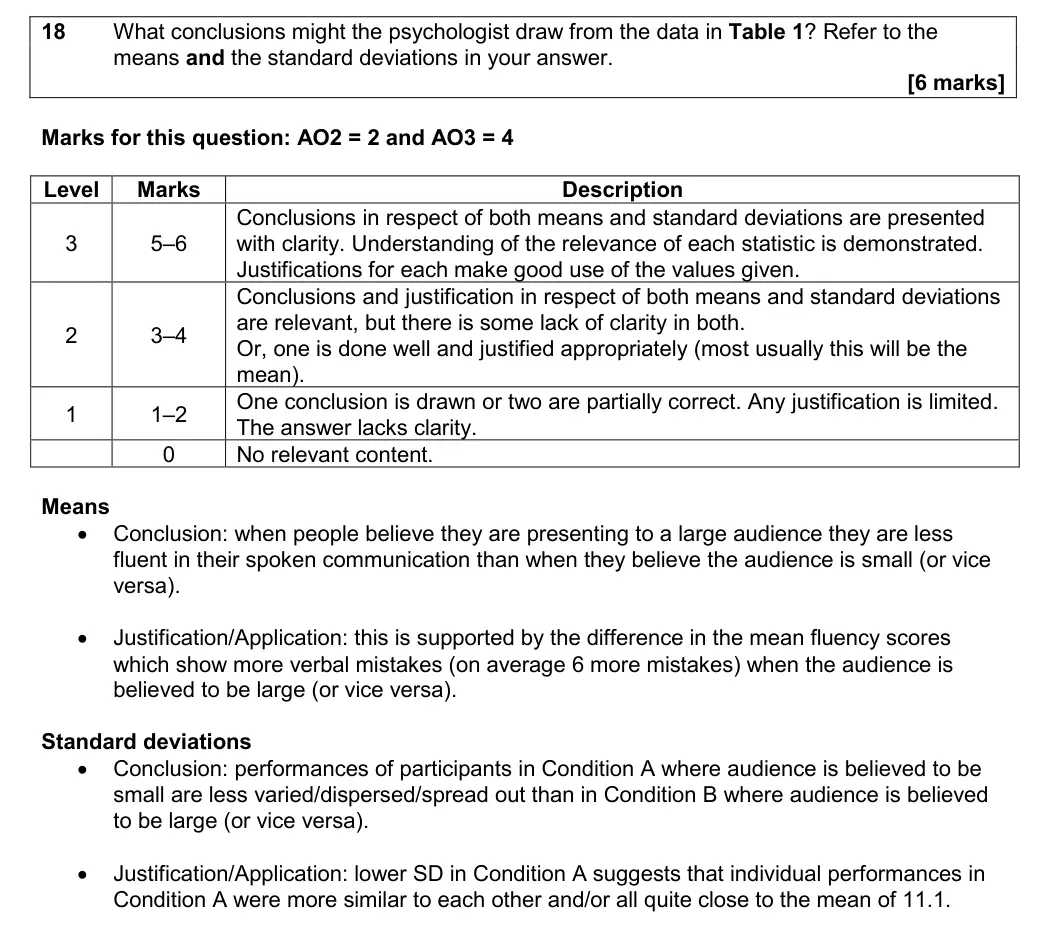
4.2.3.2-03 Descriptive statistics: measures of central tendency – mean, median, mode; calculation of mean, median and mode; measures of dispersion; range and standard deviation; calculation of range; calculation of percentages; positive, negative and zero correlations.AS
4.2.3.2-04 Presentation and display of quantitative data: graphs, tables, scattergrams, bar charts, histograms.AS
4.2.3.2-05 Distributions: normal and skewed distributions; characteristics of normal and skewed distributions.AS
4.2.3.2-06 Analysis and interpretation of correlation, including correlation coefficients.
4.2.3.2-07 Levels of measurement: nominal, ordinal and interval.
Tap a question to zoom it. Mark scheme and examiner's comment open under each question.
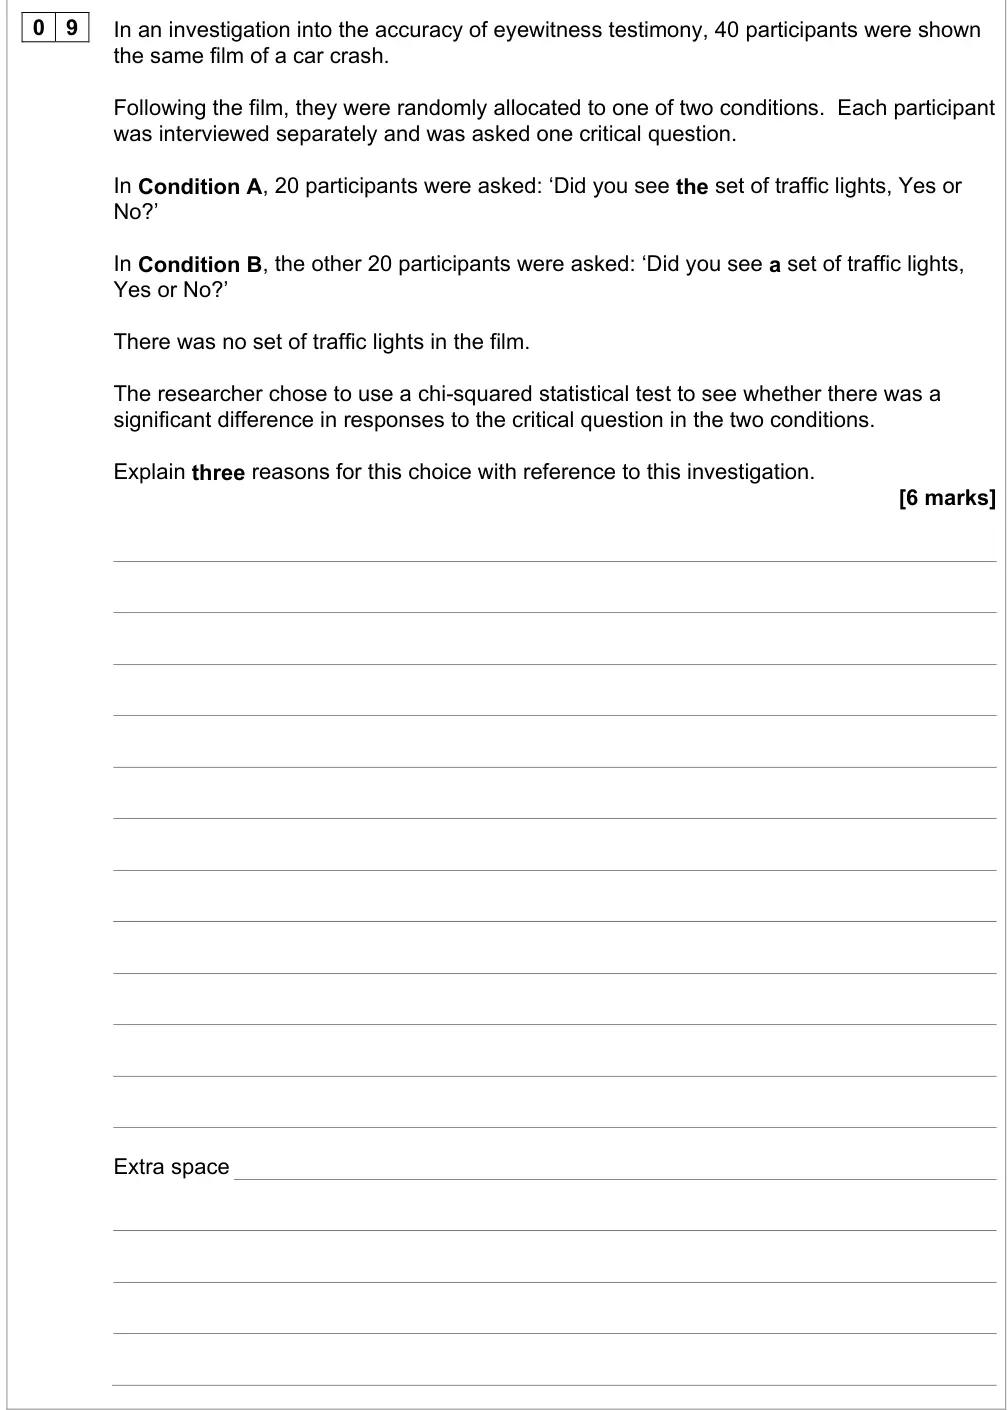
June 2025 · Paper 1 · Q96 marksAO2=6Research methodsMedium
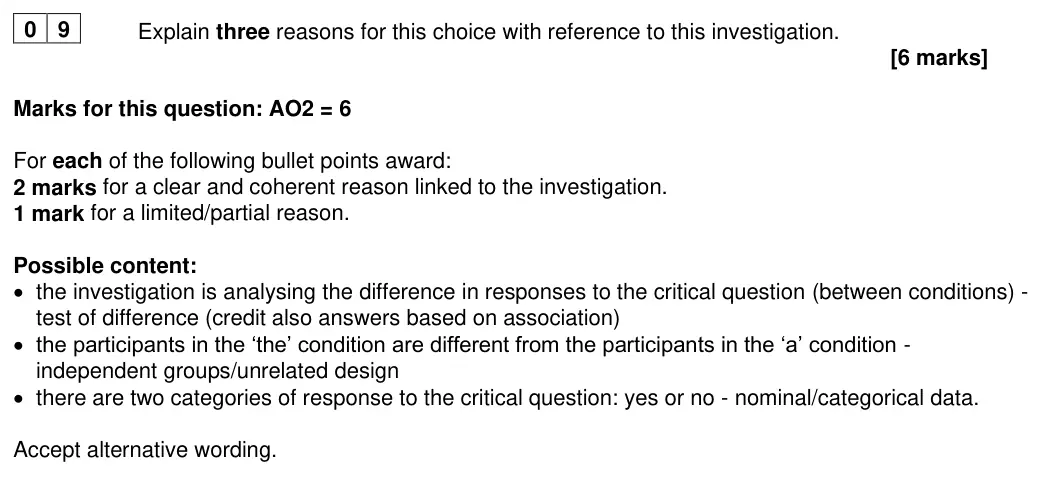
Mark scheme, including level descriptors and indicative content
Examiner's comment
In addition, students generally performed well in research methodology, for example, question 9 and question 17. The ability to justify the choice of an inferential test is seemingly getting stronger in this paper, with over 40% of students gaining 5 or 6 marks. Many students (more than 64%) were able to give at least one contextualised reason for using the chi square test. The average mark for this question was 3.78, with fewer than 9% of students scoring no marks.
Notes from the mark scheme and report
3 reasons x 2 marks linked to the study: test of difference (association accepted), independent groups ('the' vs 'a' conditions), nominal data (yes/no)
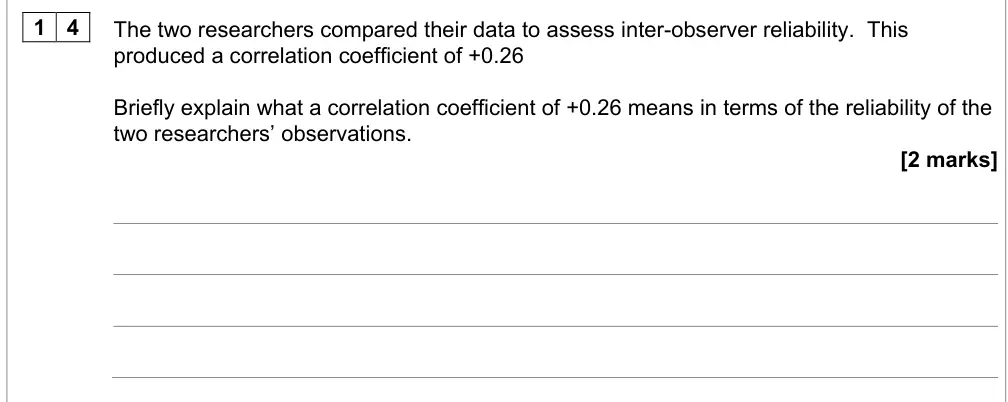
June 2025 · Paper 1 · Q142 marksAO2=2Research methods
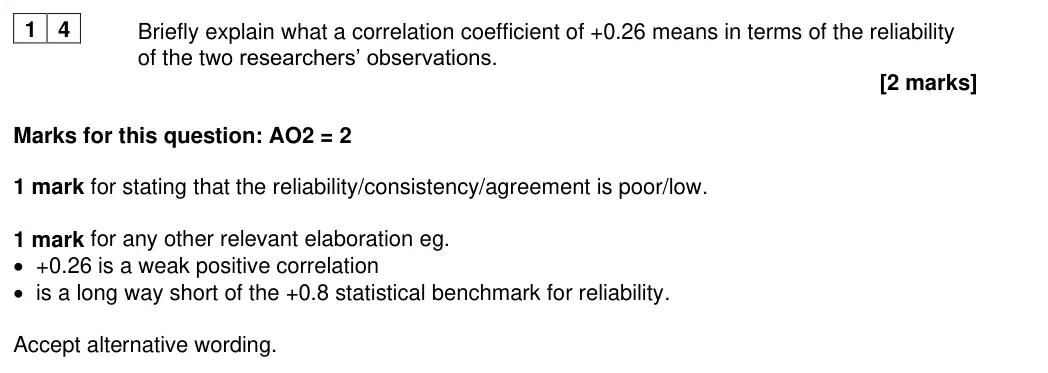
Mark scheme, including level descriptors and indicative content
Examiner's comment
This was typically answered well by students who were largely able to deduce that a correlational coefficient of +0.26 indicated low inter-observer reliability. Effective reference to a more desirable correlational coefficient of +0.8 was frequently made.
Notes from the mark scheme and report
1 mark low/poor reliability + 1 mark elaboration (weak positive correlation
well below +0.8 benchmark)
June 2025 · AS Paper 1 · Q15.12 marksAO2=2Research methods
Mark scheme, including level descriptors and indicative content
Examiner's comment
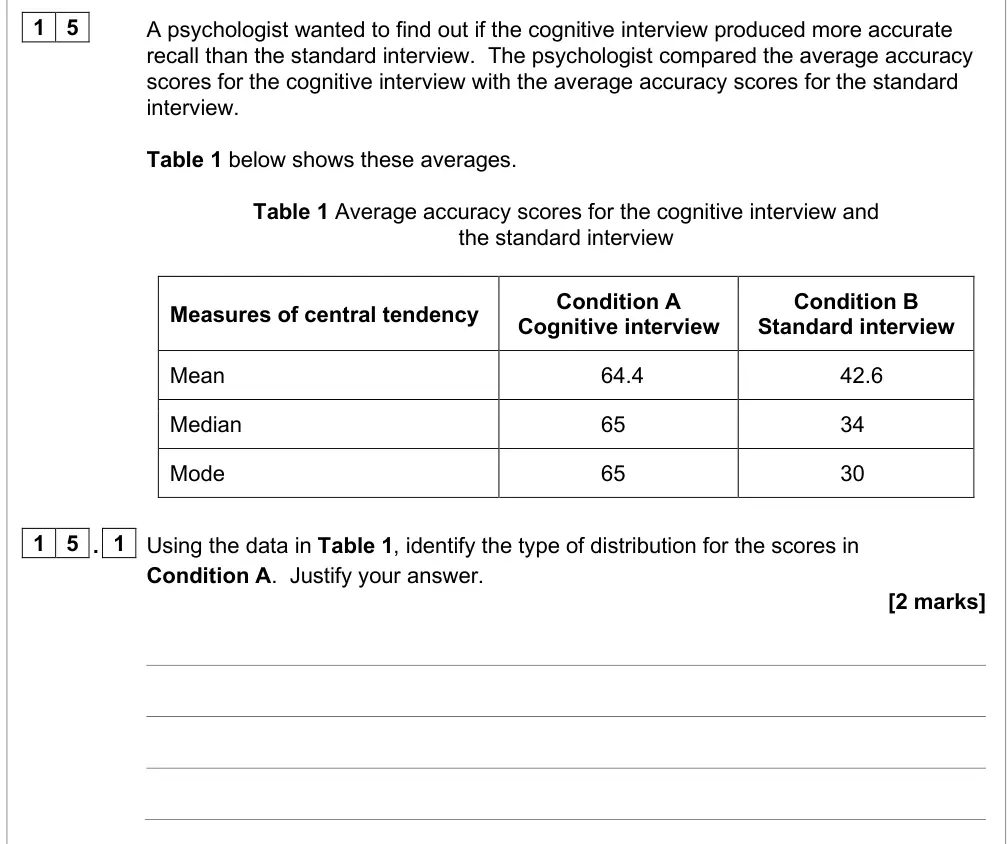
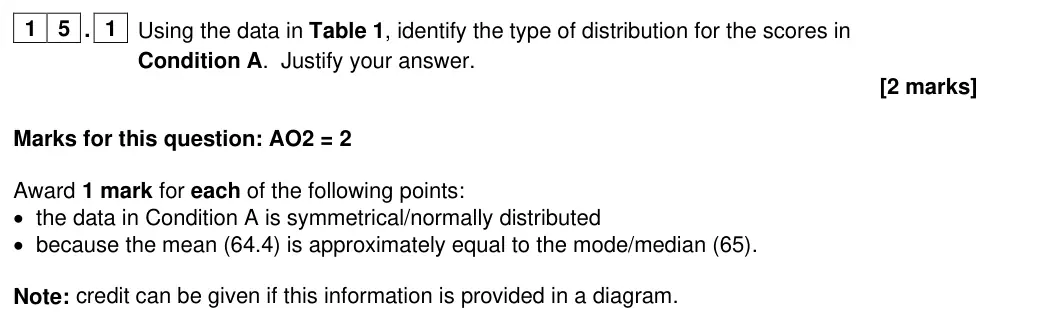
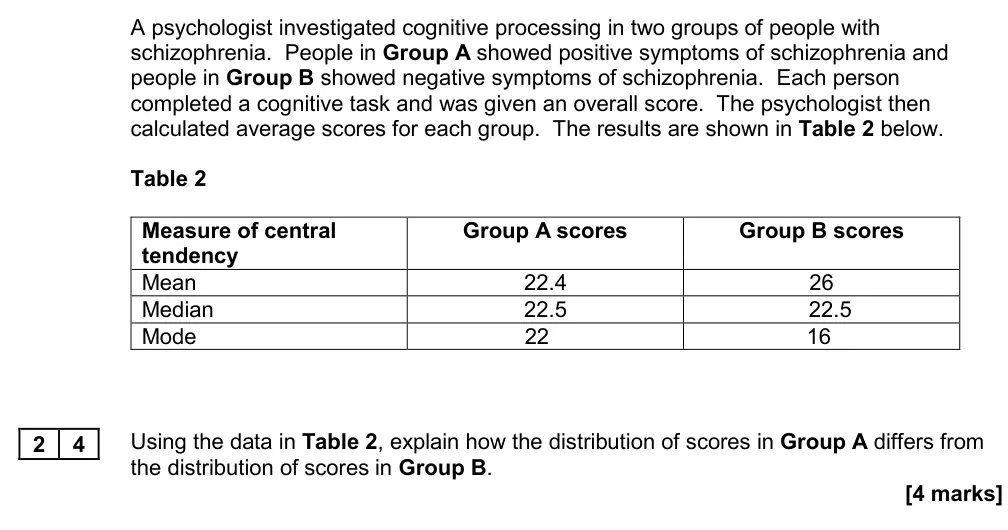
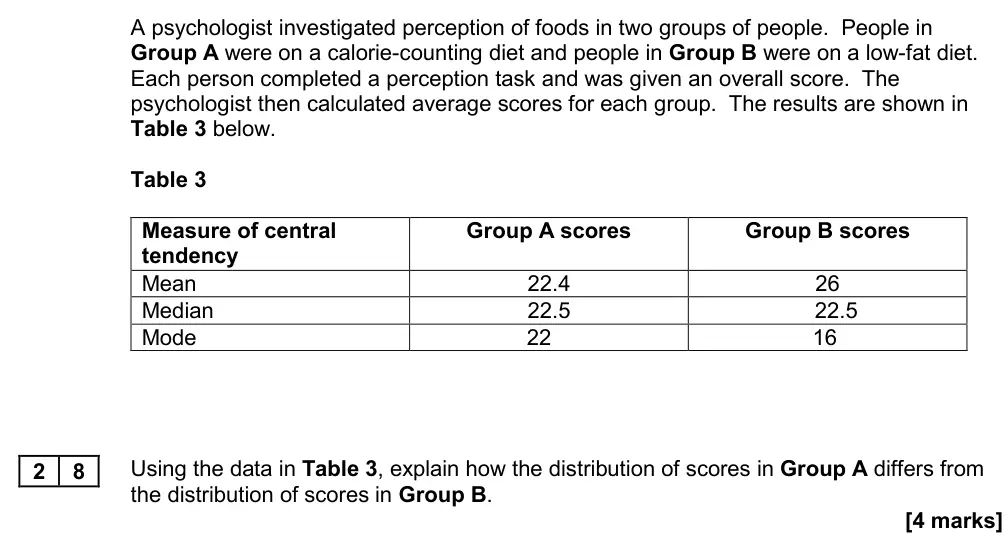
These two questions, worth two marks each involved identifying types of distribution and justifying the answer. Some students identified both distributions correctly and gave justifications based on the pattern of central tendency scores. However, far too many students did not recognise that the measures of central tendency in Q15.1 were close enough to merit a normal distribution. Some students only received the justification mark because they were able to give the correct pattern in the measures of central tendency but named the distribution incorrectly. Some students only wrote that the measures of central tendency varied, or they re-stated the values in the table but did not describe the pattern. There were also various invented answers e.g. a close distribution. These questions had the highest percentages of being not attempted and the lowest means seen across the paper.
Notes from the mark scheme and report
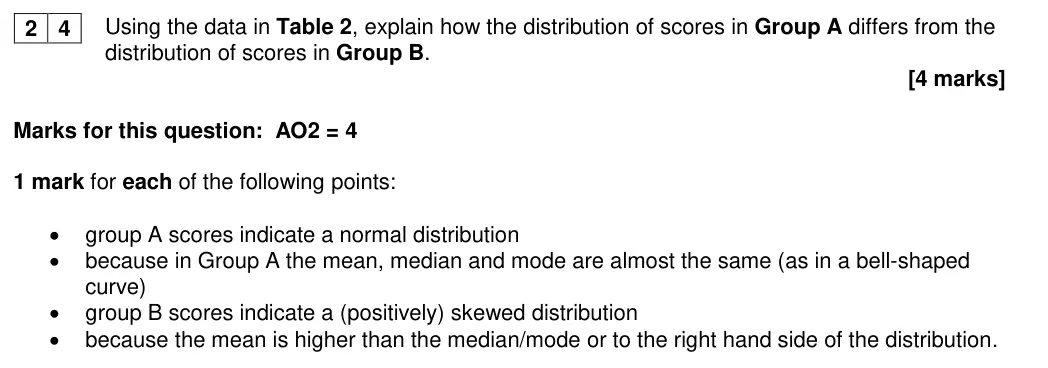
normal/symmetrical because mean is approximately equal to median/mode
many did not see the values were close enough for normal
among the most often unattempted items
June 2025 · AS Paper 1 · Q15.22 marksAO2=2Research methods
Mark scheme, including level descriptors and indicative content
Examiner's comment
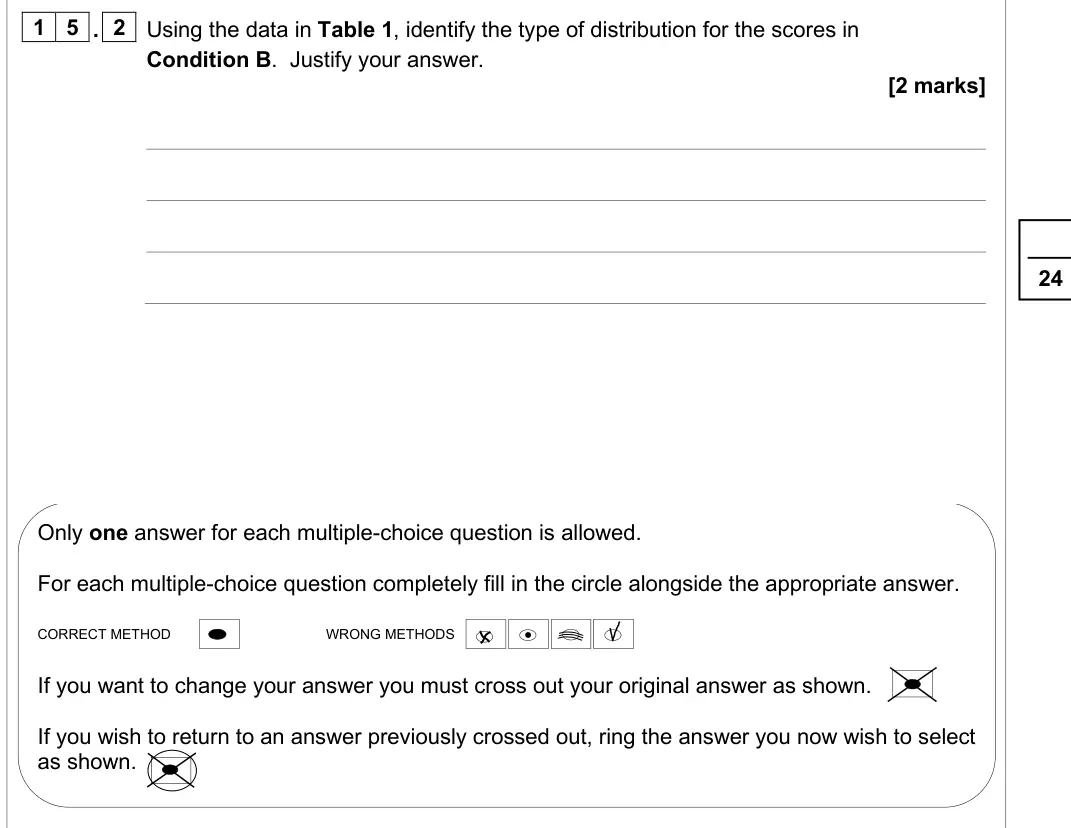
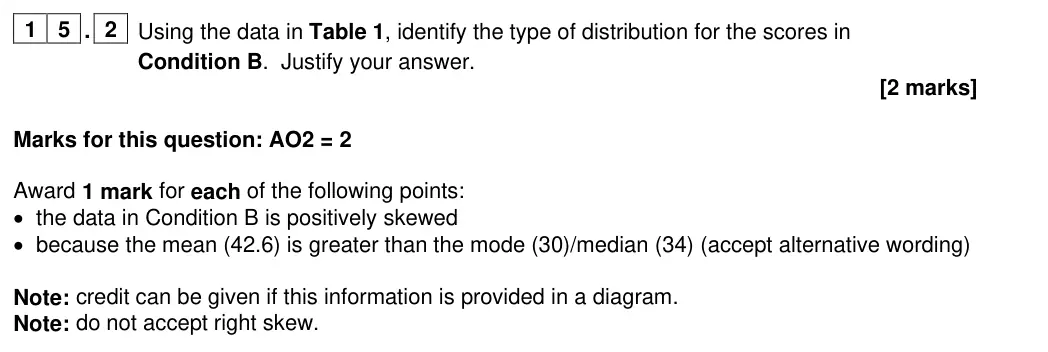
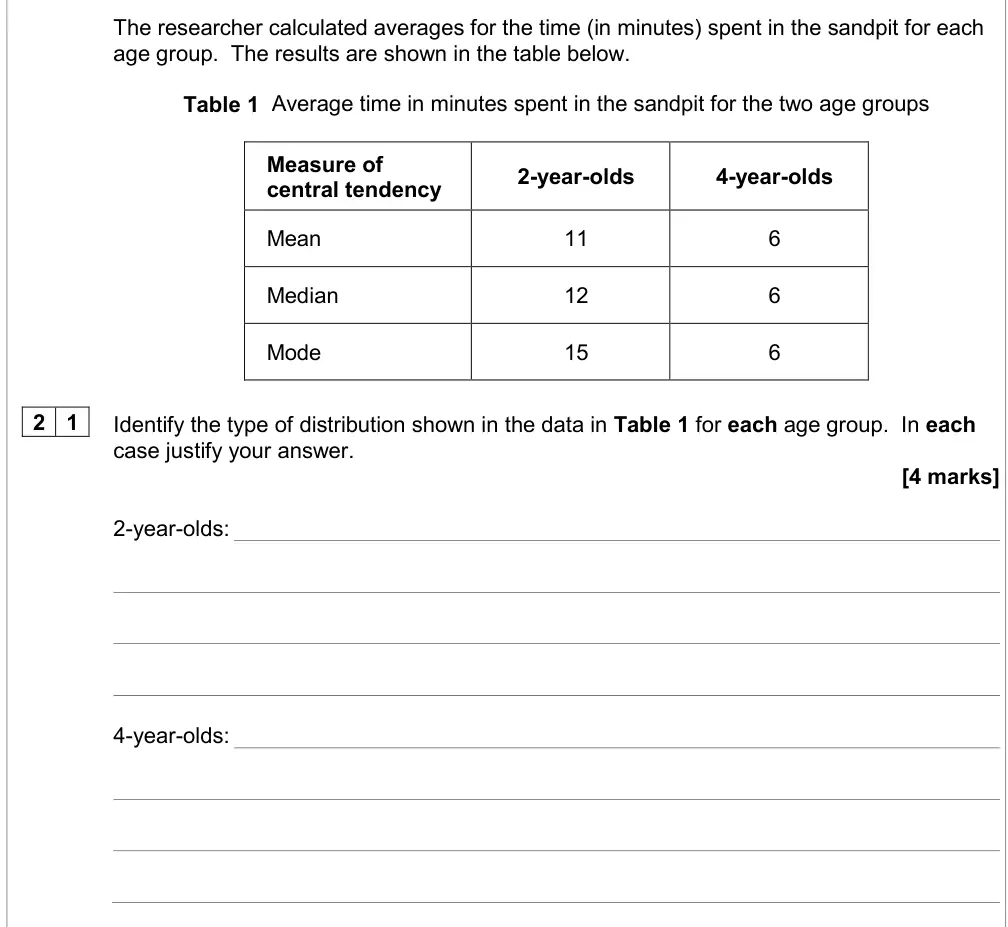
These two questions, worth two marks each involved identifying types of distribution and justifying the answer. Some students identified both distributions correctly and gave justifications based on the pattern of central tendency scores. Too many students also forgot to write ‘skew’ in their answer for Q15.2. It was not enough to simply say ‘positive’ distribution. Some students only received the justification mark because they were able to give the correct pattern in the measures of central tendency but named the distribution incorrectly. Some students only wrote that the measures of central tendency varied, or they re-stated the values in the table but did not describe the pattern. There were also various invented answers e.g. a close distribution. These questions had the highest percentages of being not attempted and the lowest means seen across the paper.
Notes from the mark scheme and report
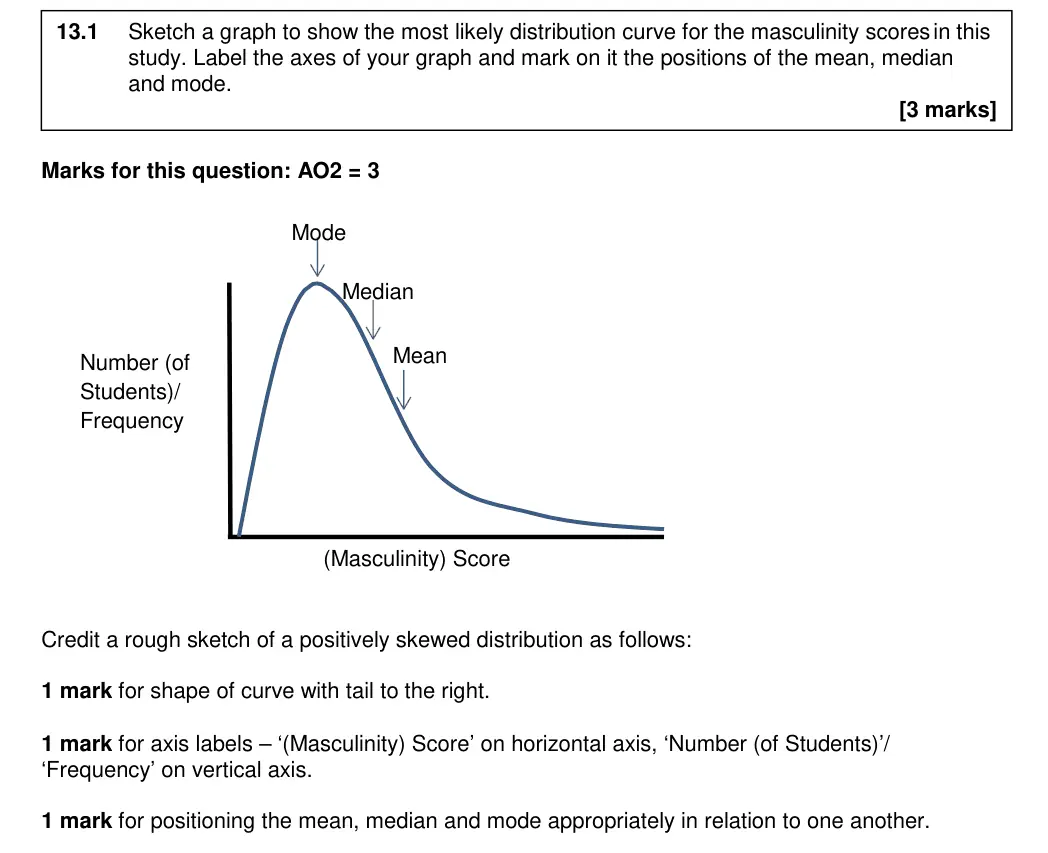
positively skewed because mean > median > mode
must say 'skew' ('positive' alone not credited)
'right skew' not accepted
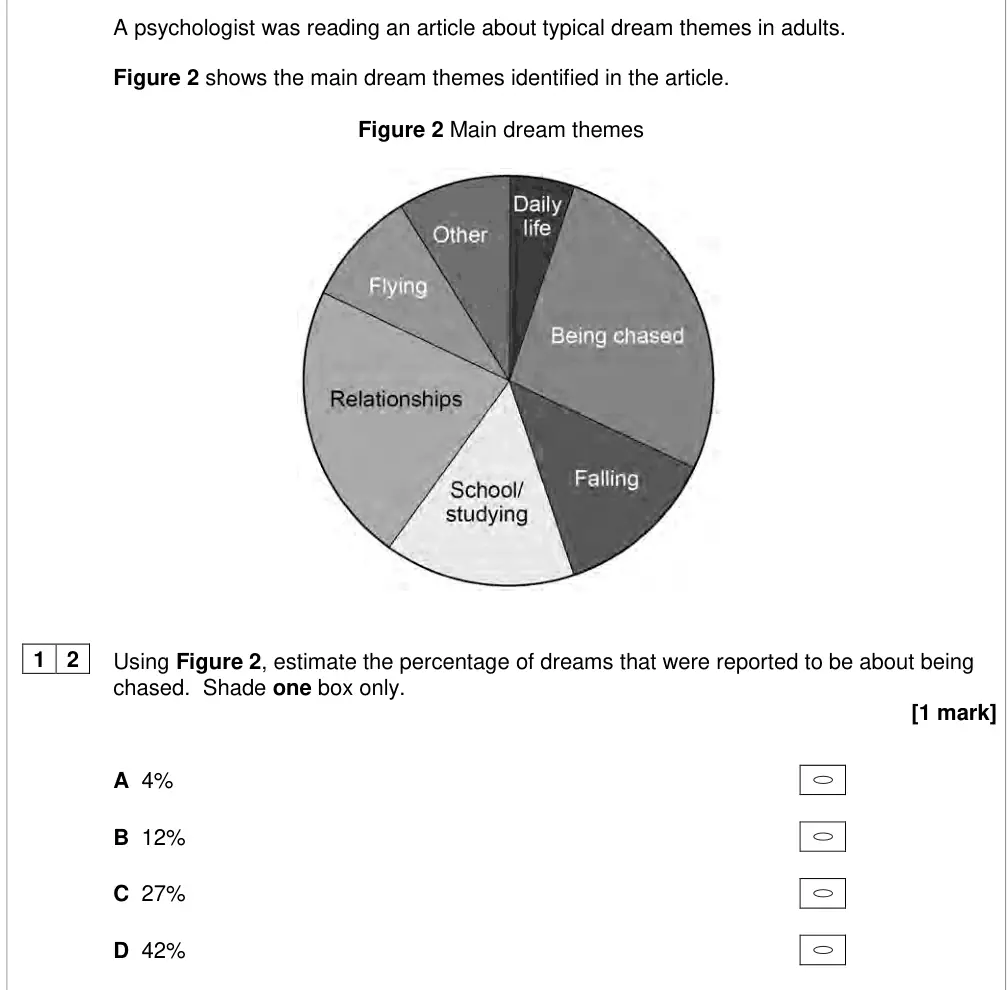
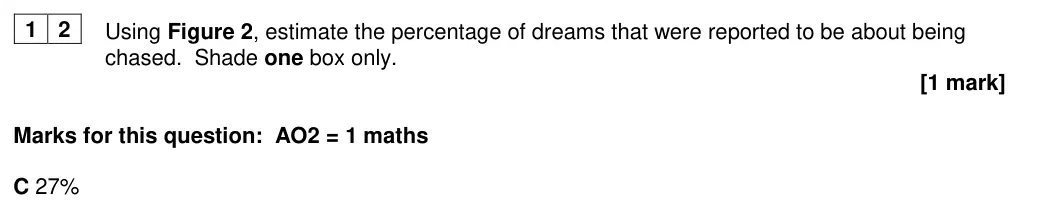
June 2025 · AS Paper 1 · Q161 markAO2=1Multiple choiceEasy
Answer
B
Mark scheme, including level descriptors and indicative content
Examiner's comment
This was a very accessible multiple-choice question with over 90% of the students able to identify the correct answer. Very few students did not attempt the question, and most students marked only one answer.
Notes from the mark scheme and report
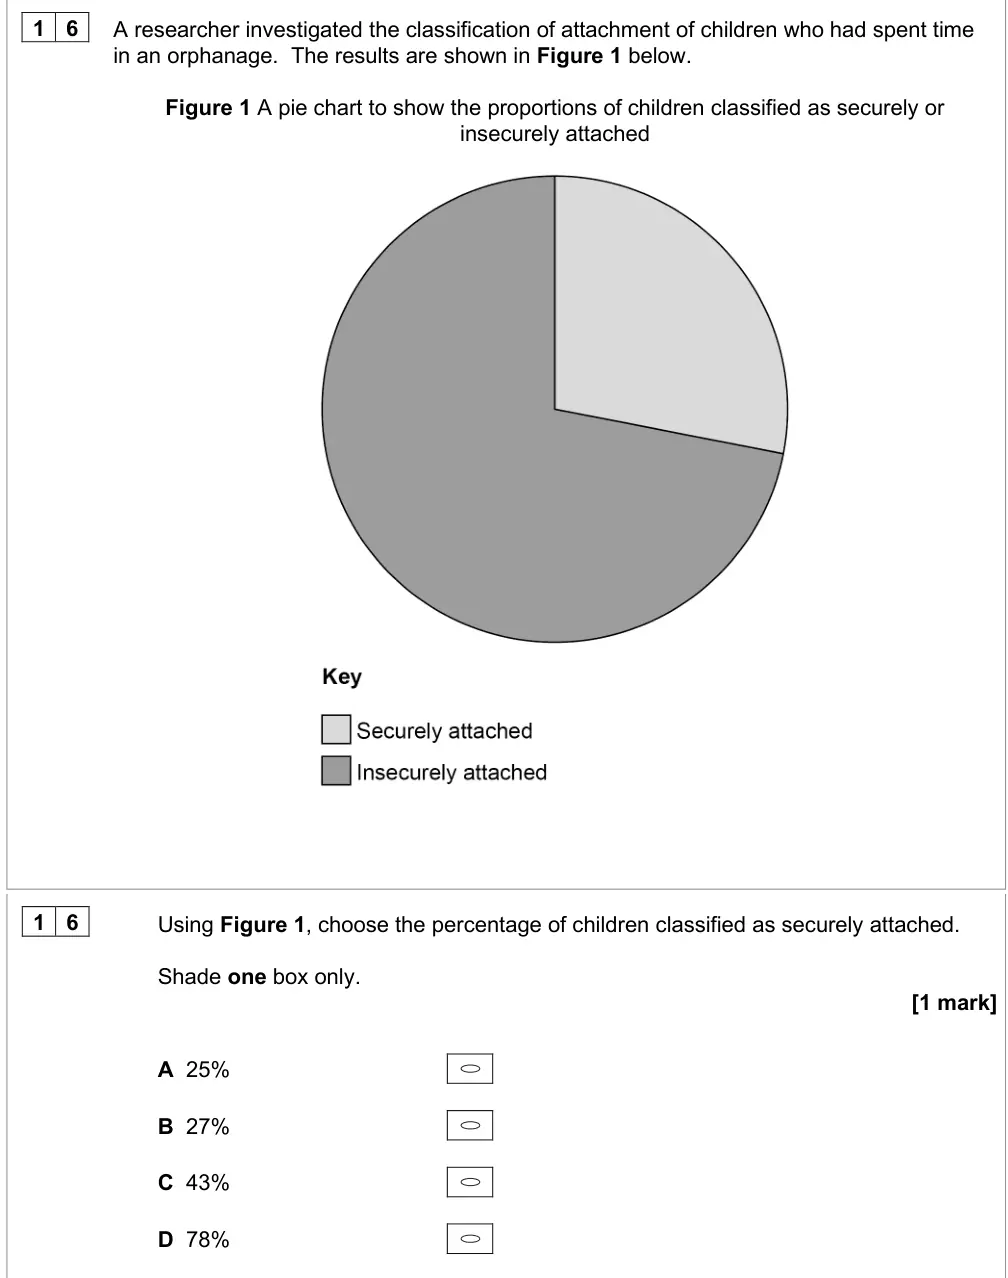
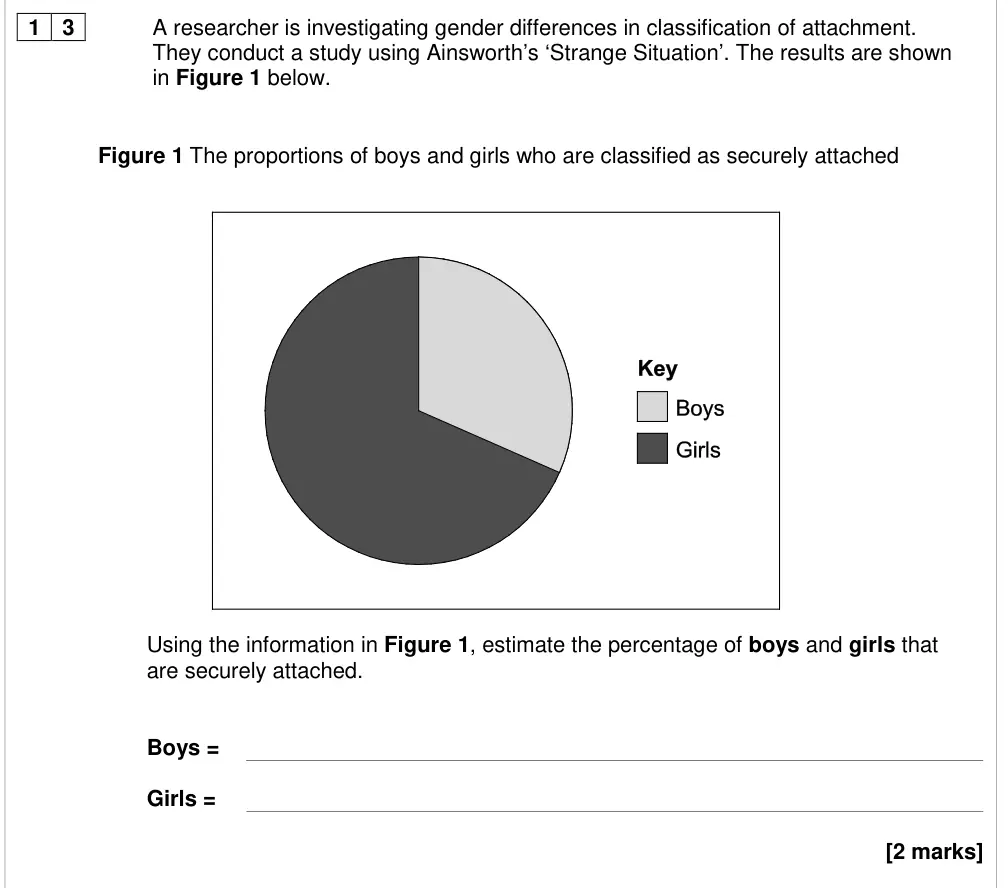
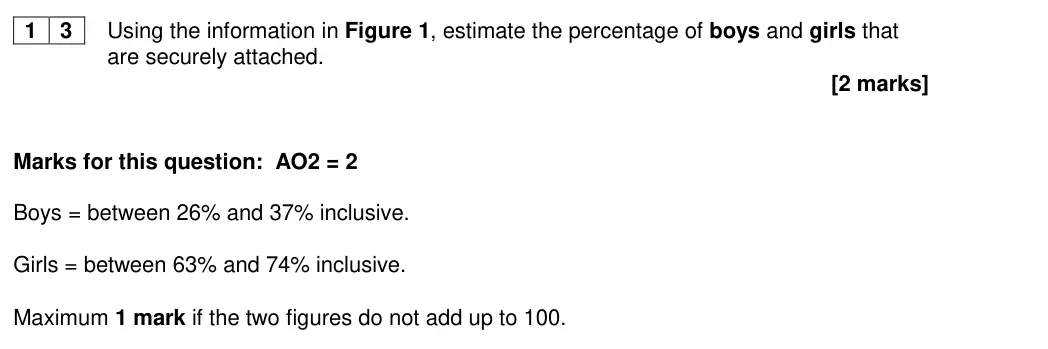
read percentage from a pie chart
correct answer B (27%)
June 2025 · AS Paper 1 · Q172 marksAO2=2Research methods
Mark scheme, including level descriptors and indicative content
Examiner's comment
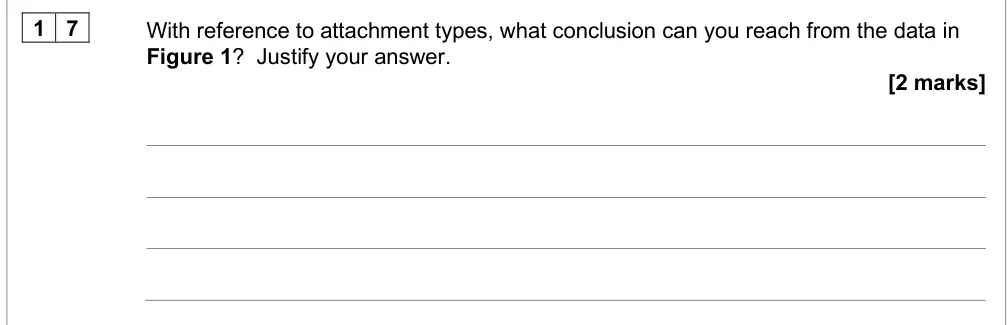
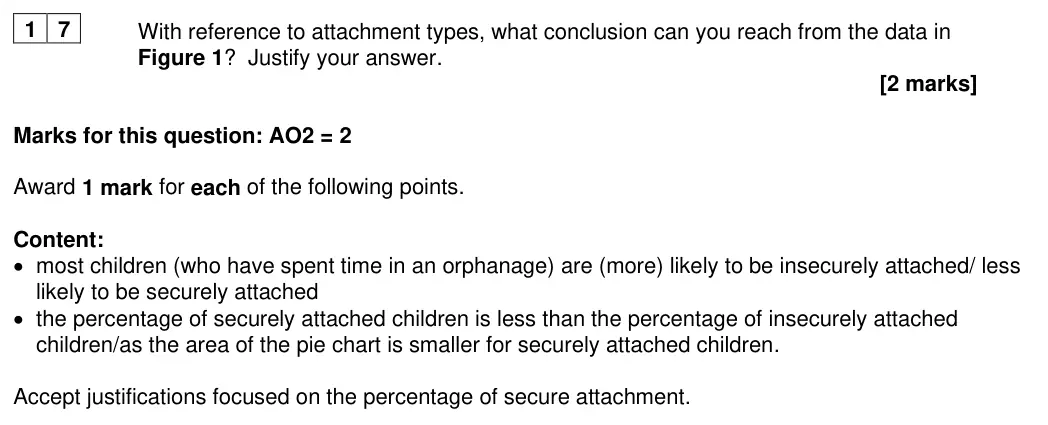
This question was a follow up to Q16, asking students to draw a conclusion about attachment types using the data in the pie chart. Approximately 25% of students referred to the fact that children who had spent time in an orphanage were more likely to be insecurely attached/ less likely to be securely attached and gave an appropriate reference to the pattern of data in the pie chart. Many answers were unable to gain the second mark for the question, either lacking clarity by writing about children ‘mostly being insecure,’ rather than ‘most children’ being insecure, or because of a lack of justification through reference to the data. Some tried to explain why this type of attachment might have occurred by referring to the data in the pie chart which did not address the question.
Notes from the mark scheme and report
conclusion: children who spent time in an orphanage are more likely to be insecurely attached + justification from the pie chart
'mostly insecure' lacked clarity
explaining why rather than concluding not credited
June 2025 · Paper 2 · Q134 marksAO2=4Research methods
Mark scheme, including level descriptors and indicative content
Examiner's comment
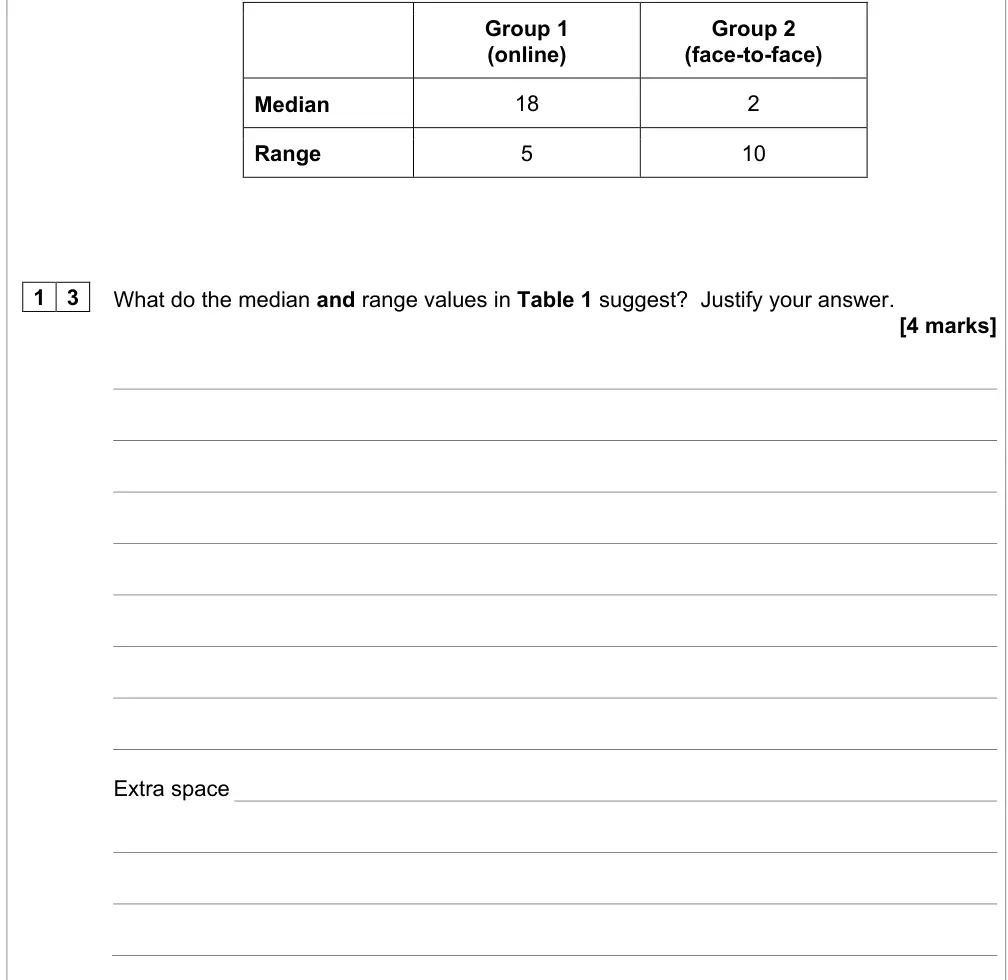
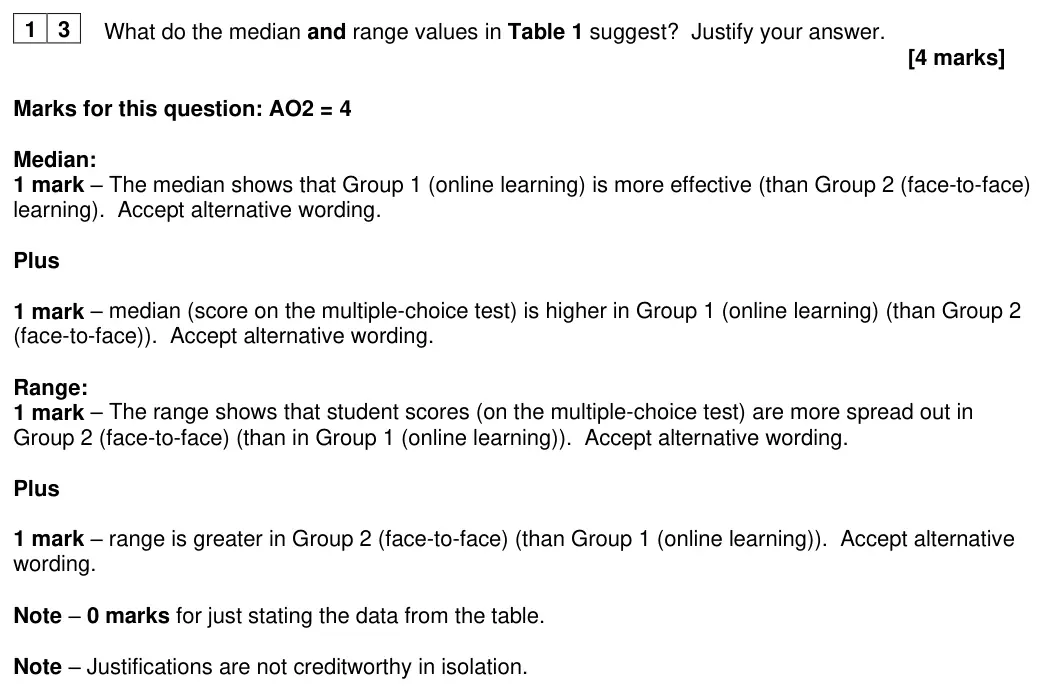
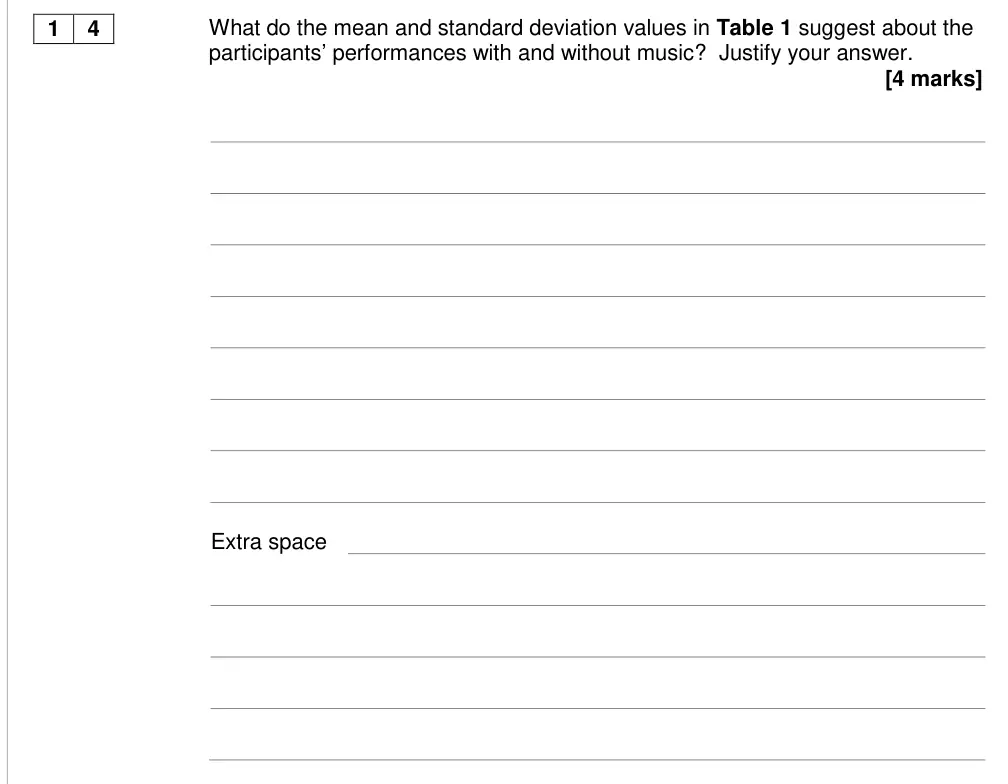
This question yielded mixed results. Some students were well prepared and provided accurate and concise responses, gaining all the available marks. Most students were able to offer a suggestion, and many answers also included correct justifications. There were many irrelevant definitions of the median and range. Some justifications did not move beyond restating the data. Students are reminded to use comparative terms when they refer to the data in the table. Overall, interpretation of the median appeared to be more challenging than the range.
Notes from the mark scheme and report
1 mark each for interpretation (online more effective
face-to-face scores more spread out) + justification (higher median
larger range)
restating data = 0
justifications not creditworthy alone
median interpretation harder
June 2025 · Paper 2 · Q142 marksAO2=2Research methods
Mark scheme, including level descriptors and indicative content
Examiner's comment
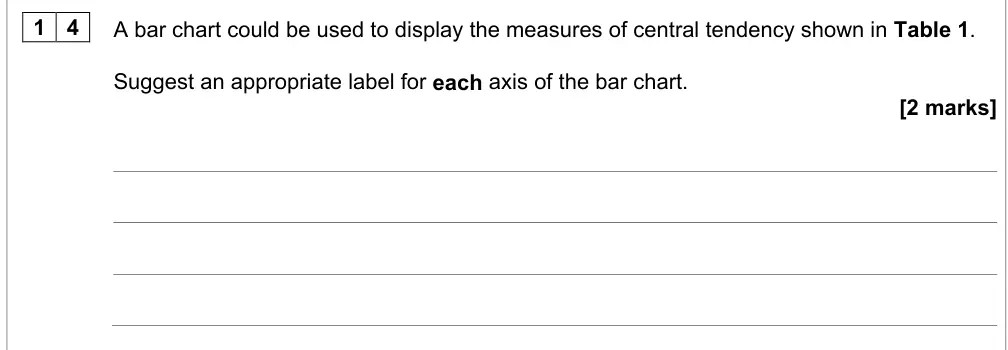
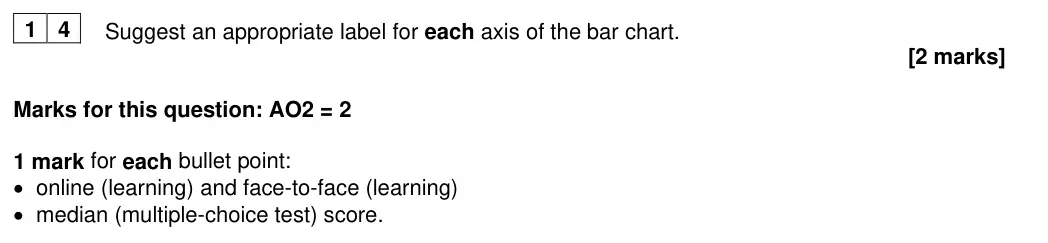
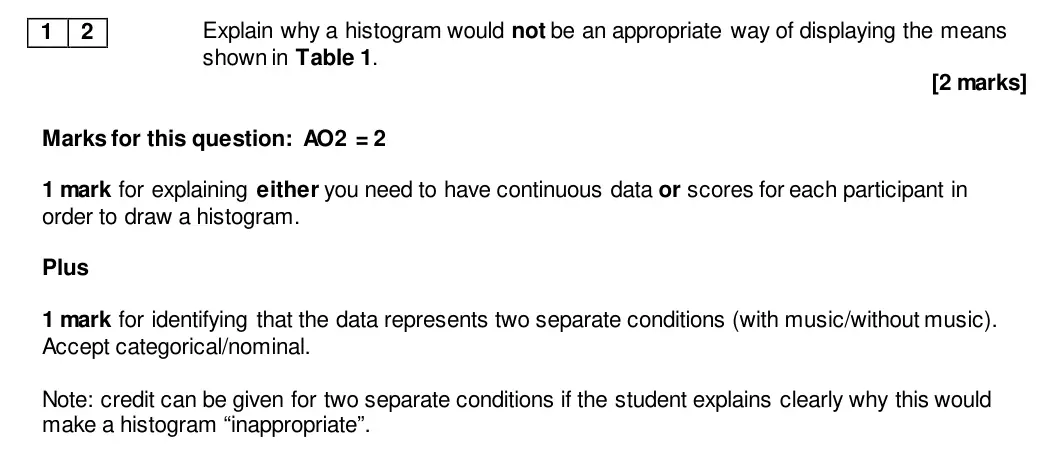
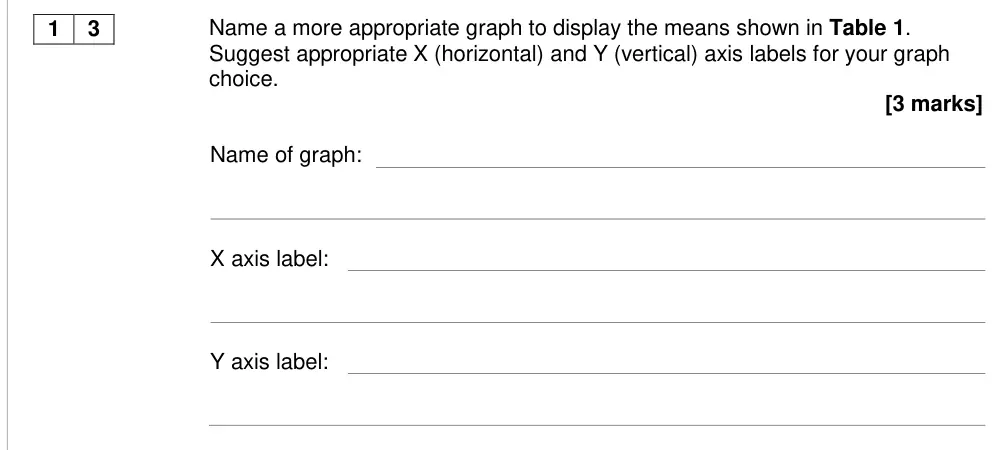
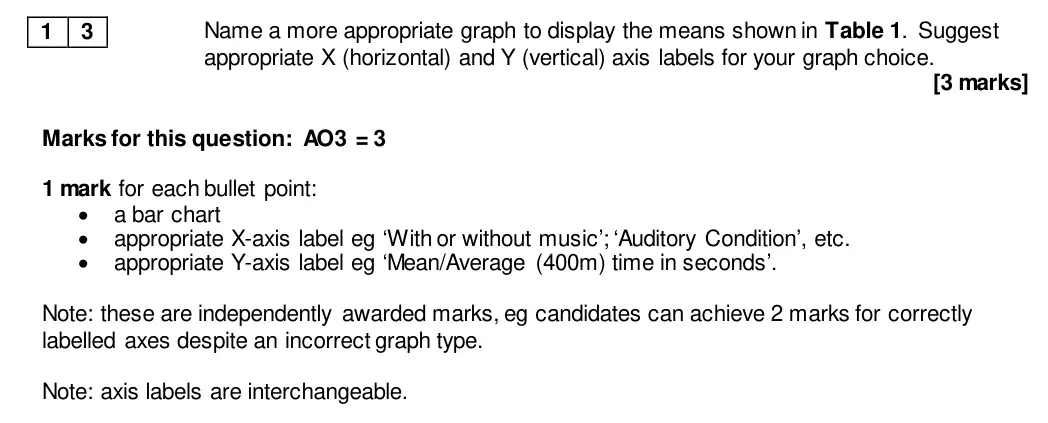
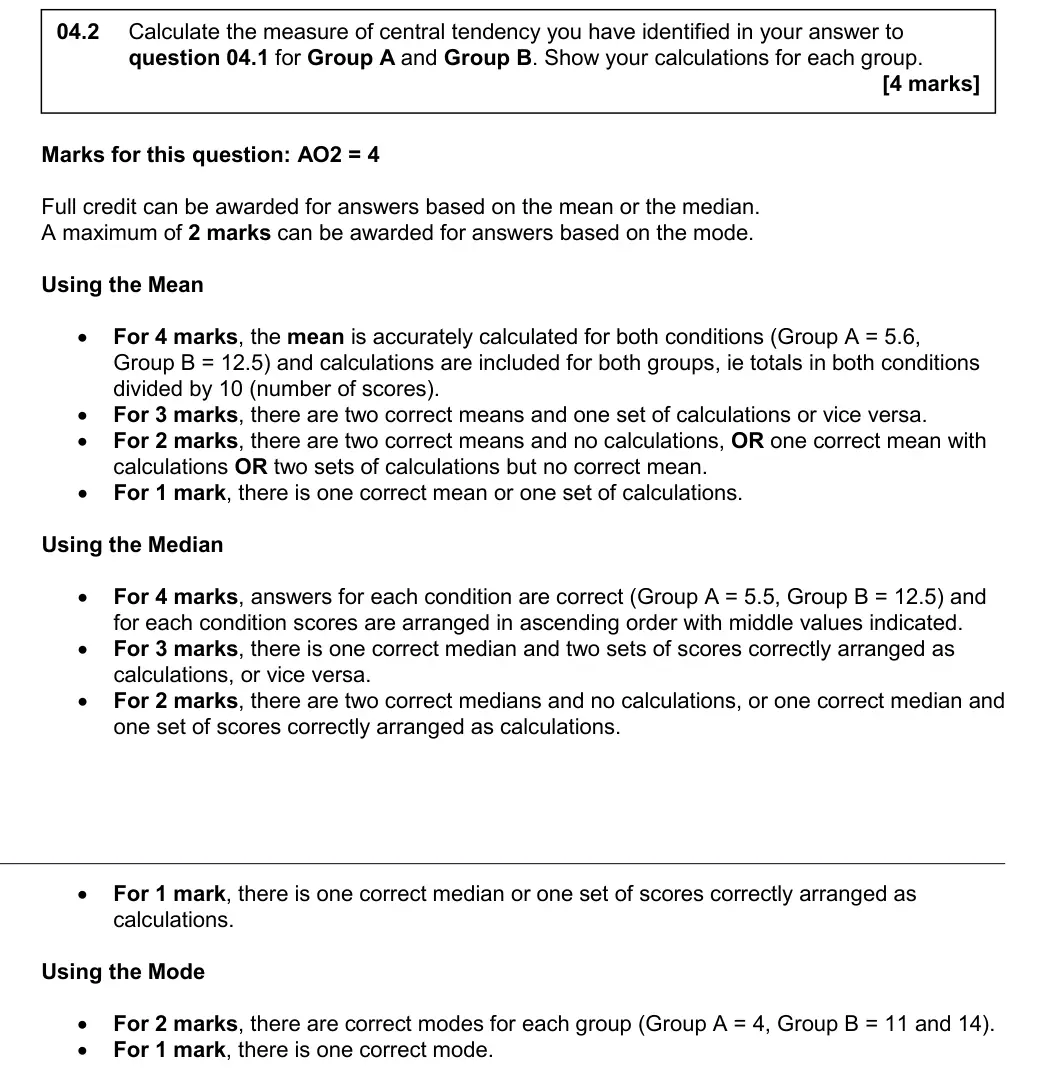
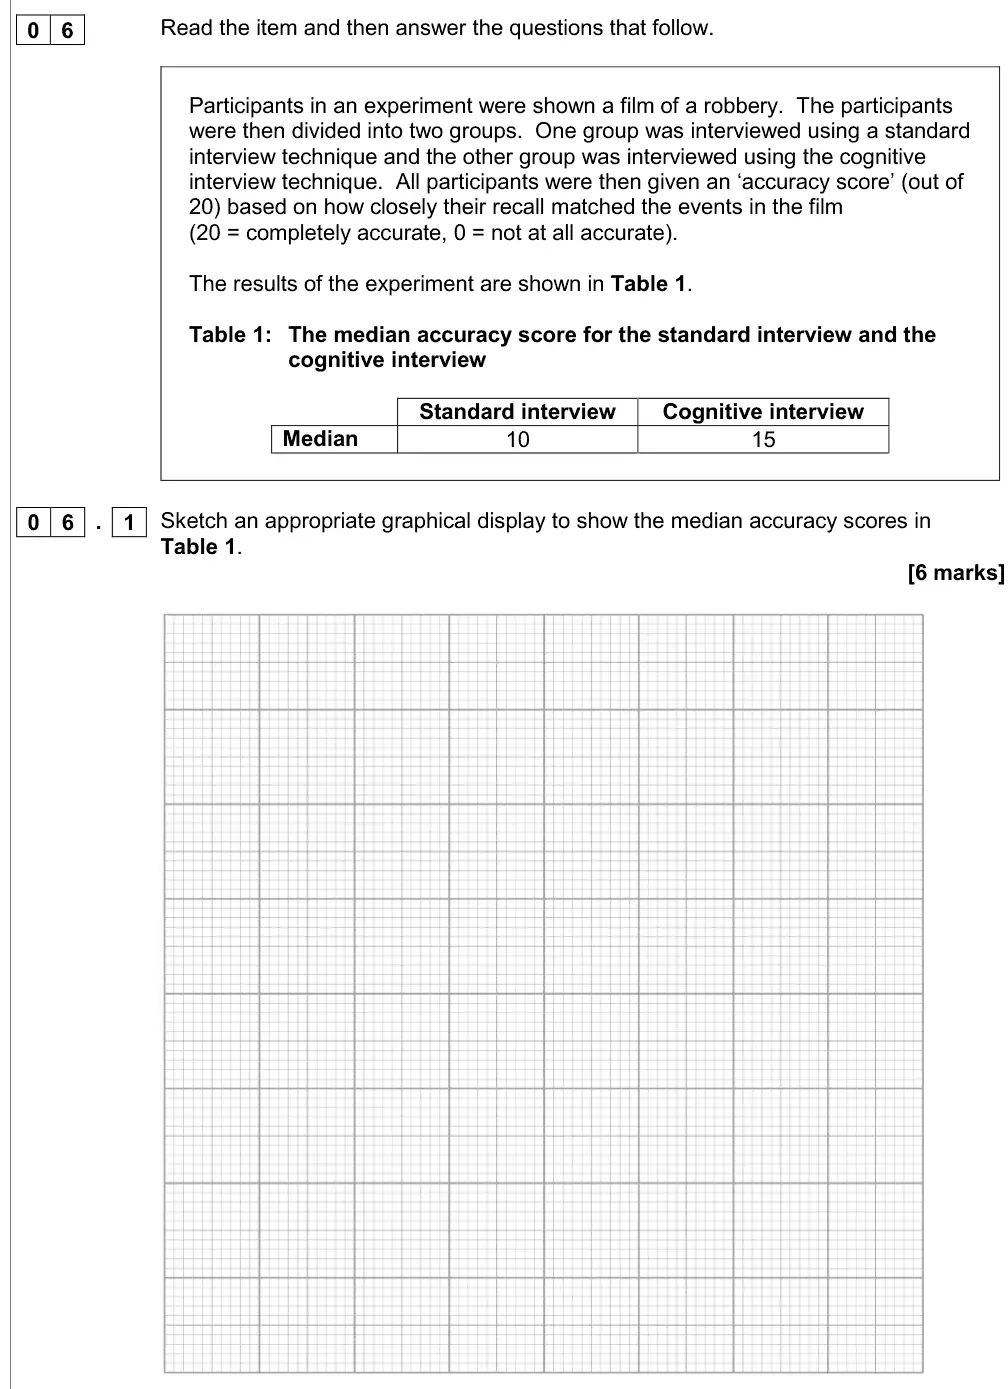
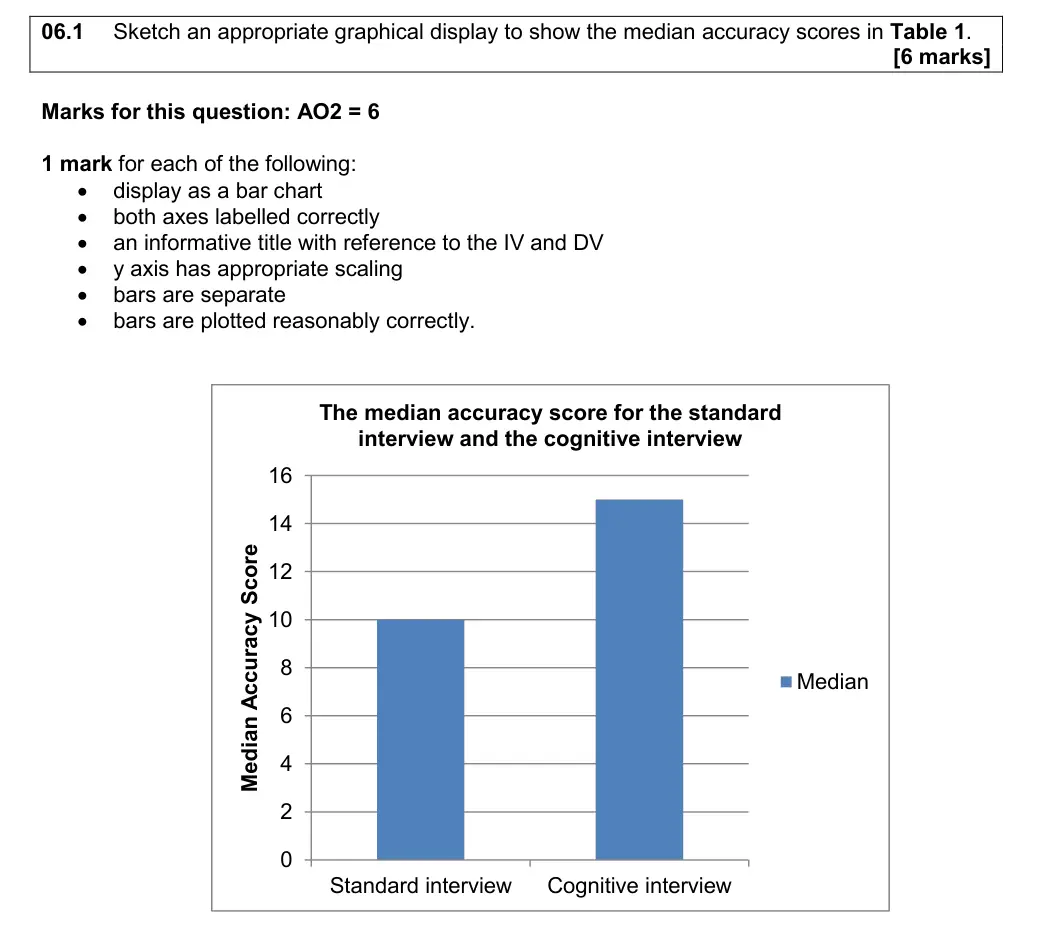
This question was generally not well answered and most students did not gain marks. It was common to see partial labels that did not state ‘median/score’ or did not operationalise the independent variable or put one group on each axis. Additionally, there was some confusion with the range, suggesting a lack of understanding of measures of dispersion and measures of central tendency.
Notes from the mark scheme and report
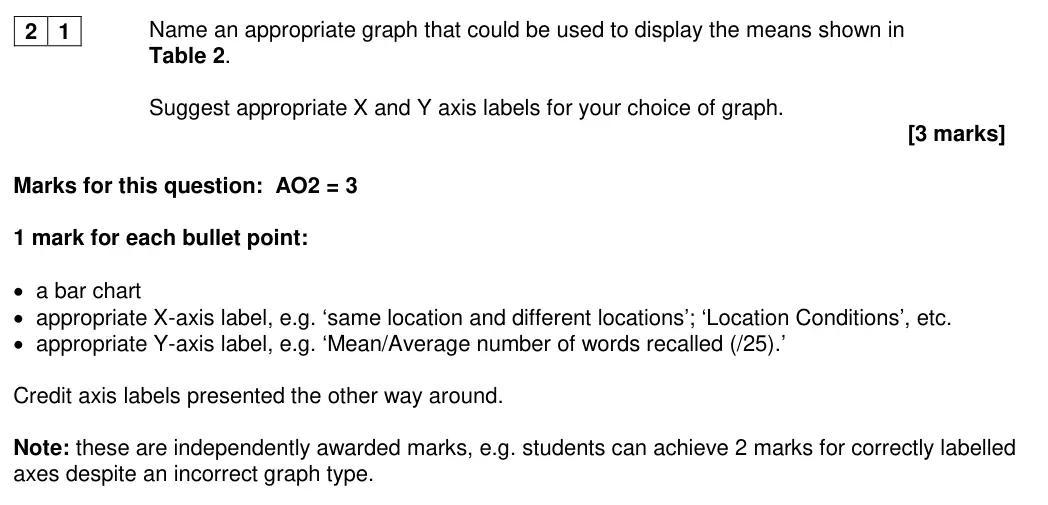
x-axis online and face-to-face learning, y-axis median (test) score
often not answered - partial labels, groups on each axis, confusion with range
June 2025 · Paper 2 · Q157 marksAO2=7Research methods
Mark scheme, including level descriptors and indicative content
Examiner's comment
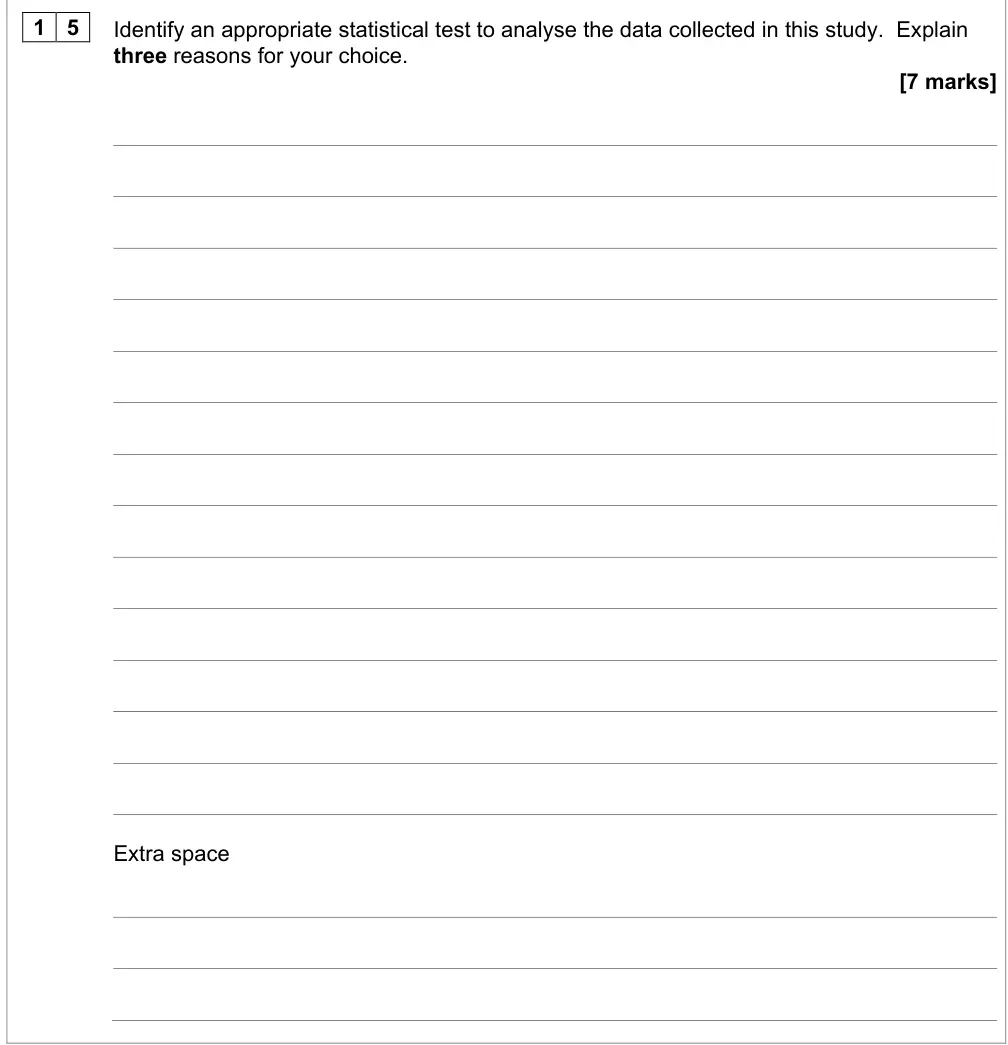
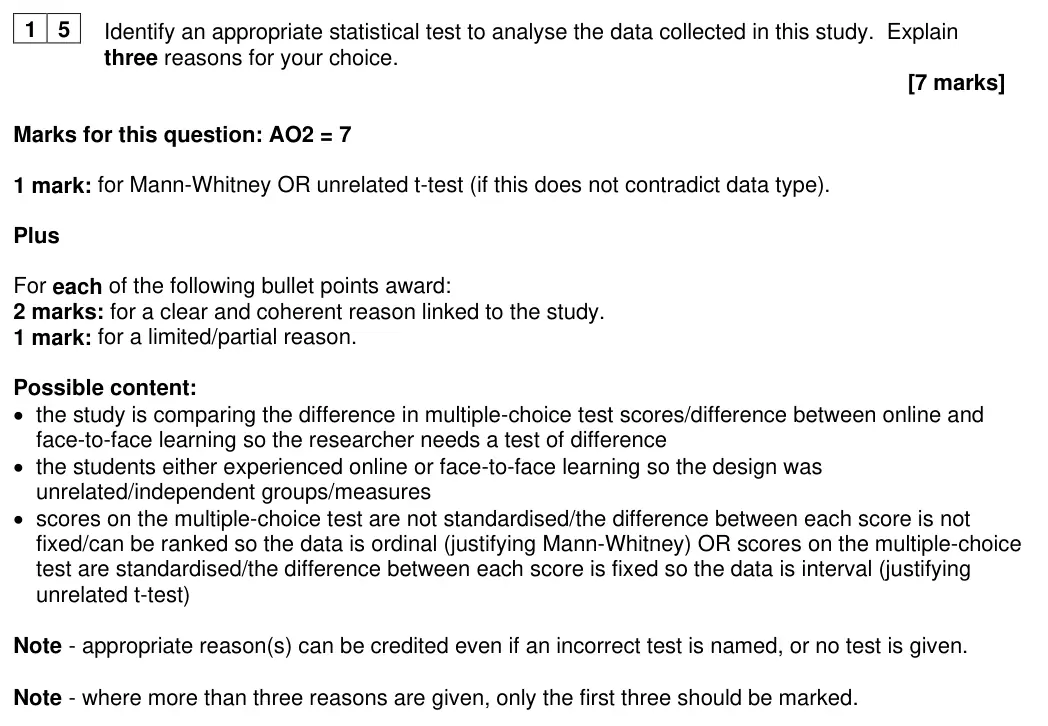
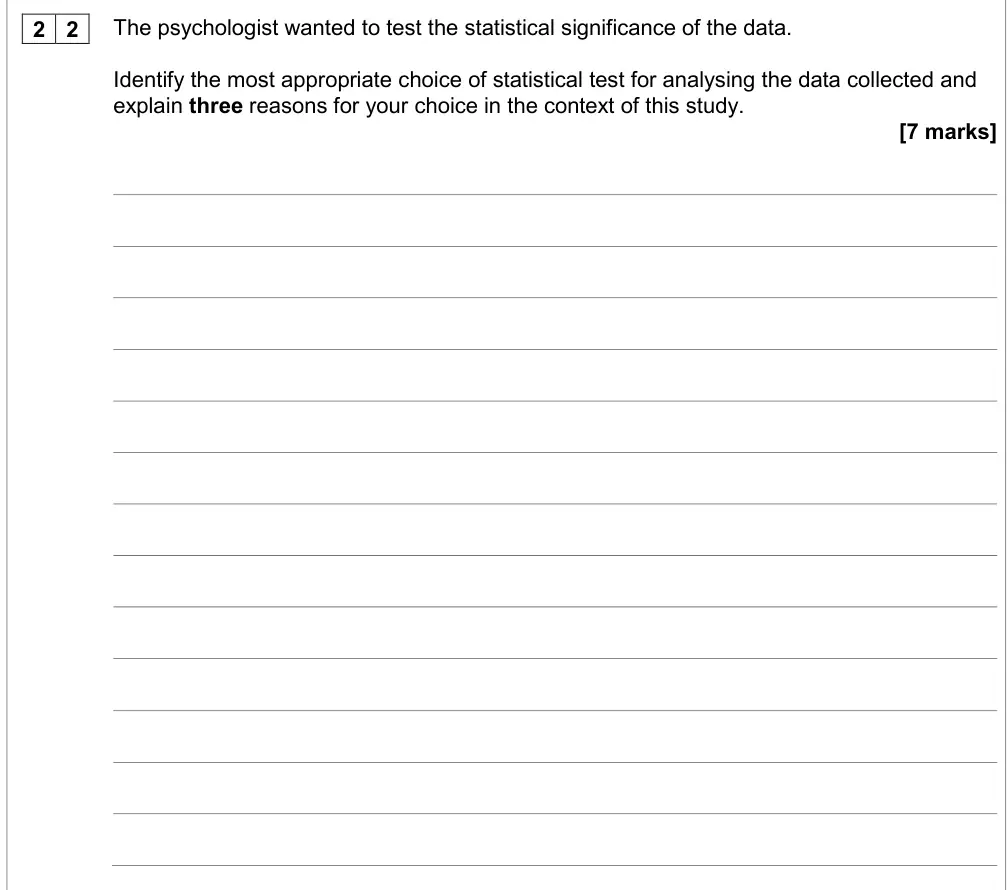
This question discriminated well. Overall students demonstrated good examination technique, providing three reasons in context with a suggested statistical test. However, many responses lacked explicit reference to the study for one of the reasons, most commonly not contextualising the design. Some students gained all the available marks for the reasons but did not provide an appropriate statistical test. Appropriate statistical tests seemed fairly evenly split between Mann-Whitney and unrelated t-test with ordinal or interval data being creditworthy reasons, respectively. Some students struggled with the application element; students are reminded that they must use elements of the study to clearly justify the reason given rather than just state elements of the study. A common misconception was to identify the data as being nominal due to either having two groups of participants or due to having multiple choice answers. Students generally found it challenging to justify the type of data identified in the context of the study suggesting a lack of understanding of levels of measurement.
Notes from the mark scheme and report
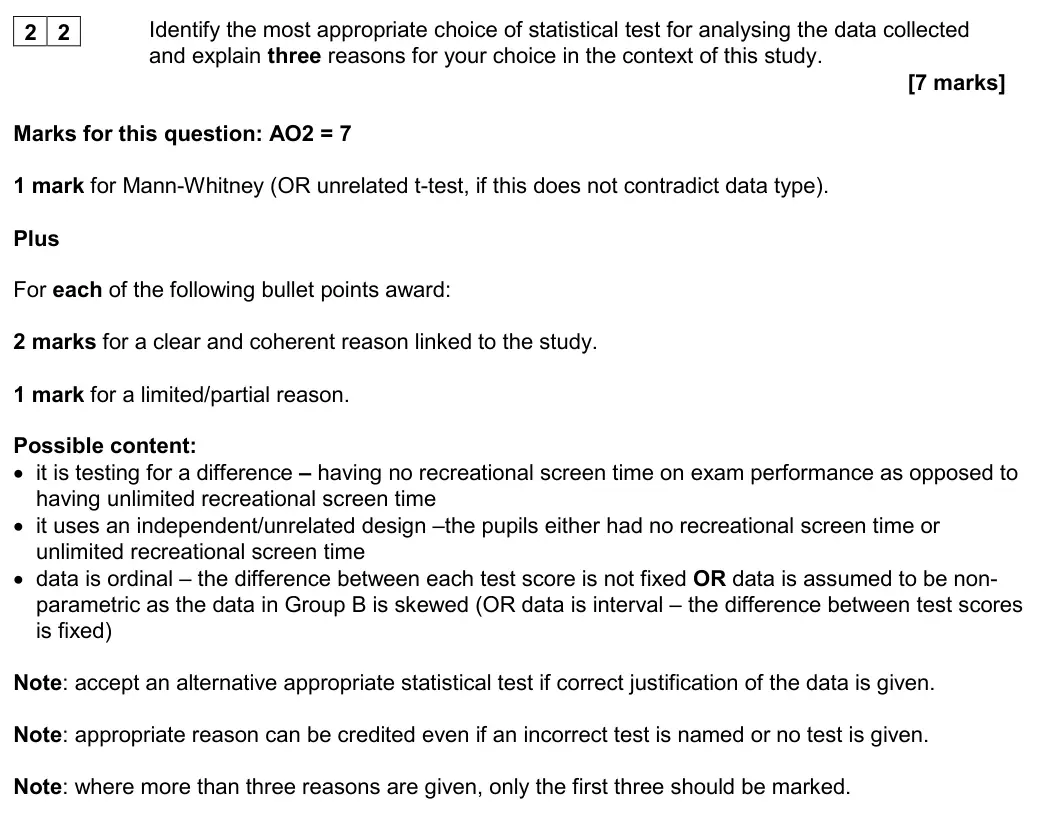
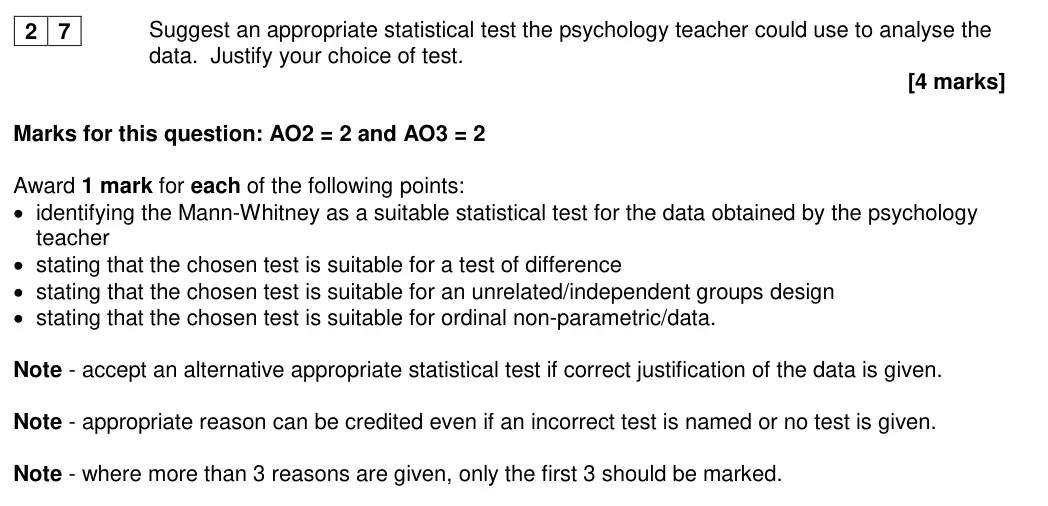
1 mark Mann-Whitney or unrelated t-test + 2 marks each for three contextualised reasons: difference, independent groups, ordinal (Mann-Whitney) or interval (t-test)
reasons creditable even if test wrong
only first three reasons marked
data often wrongly called nominal
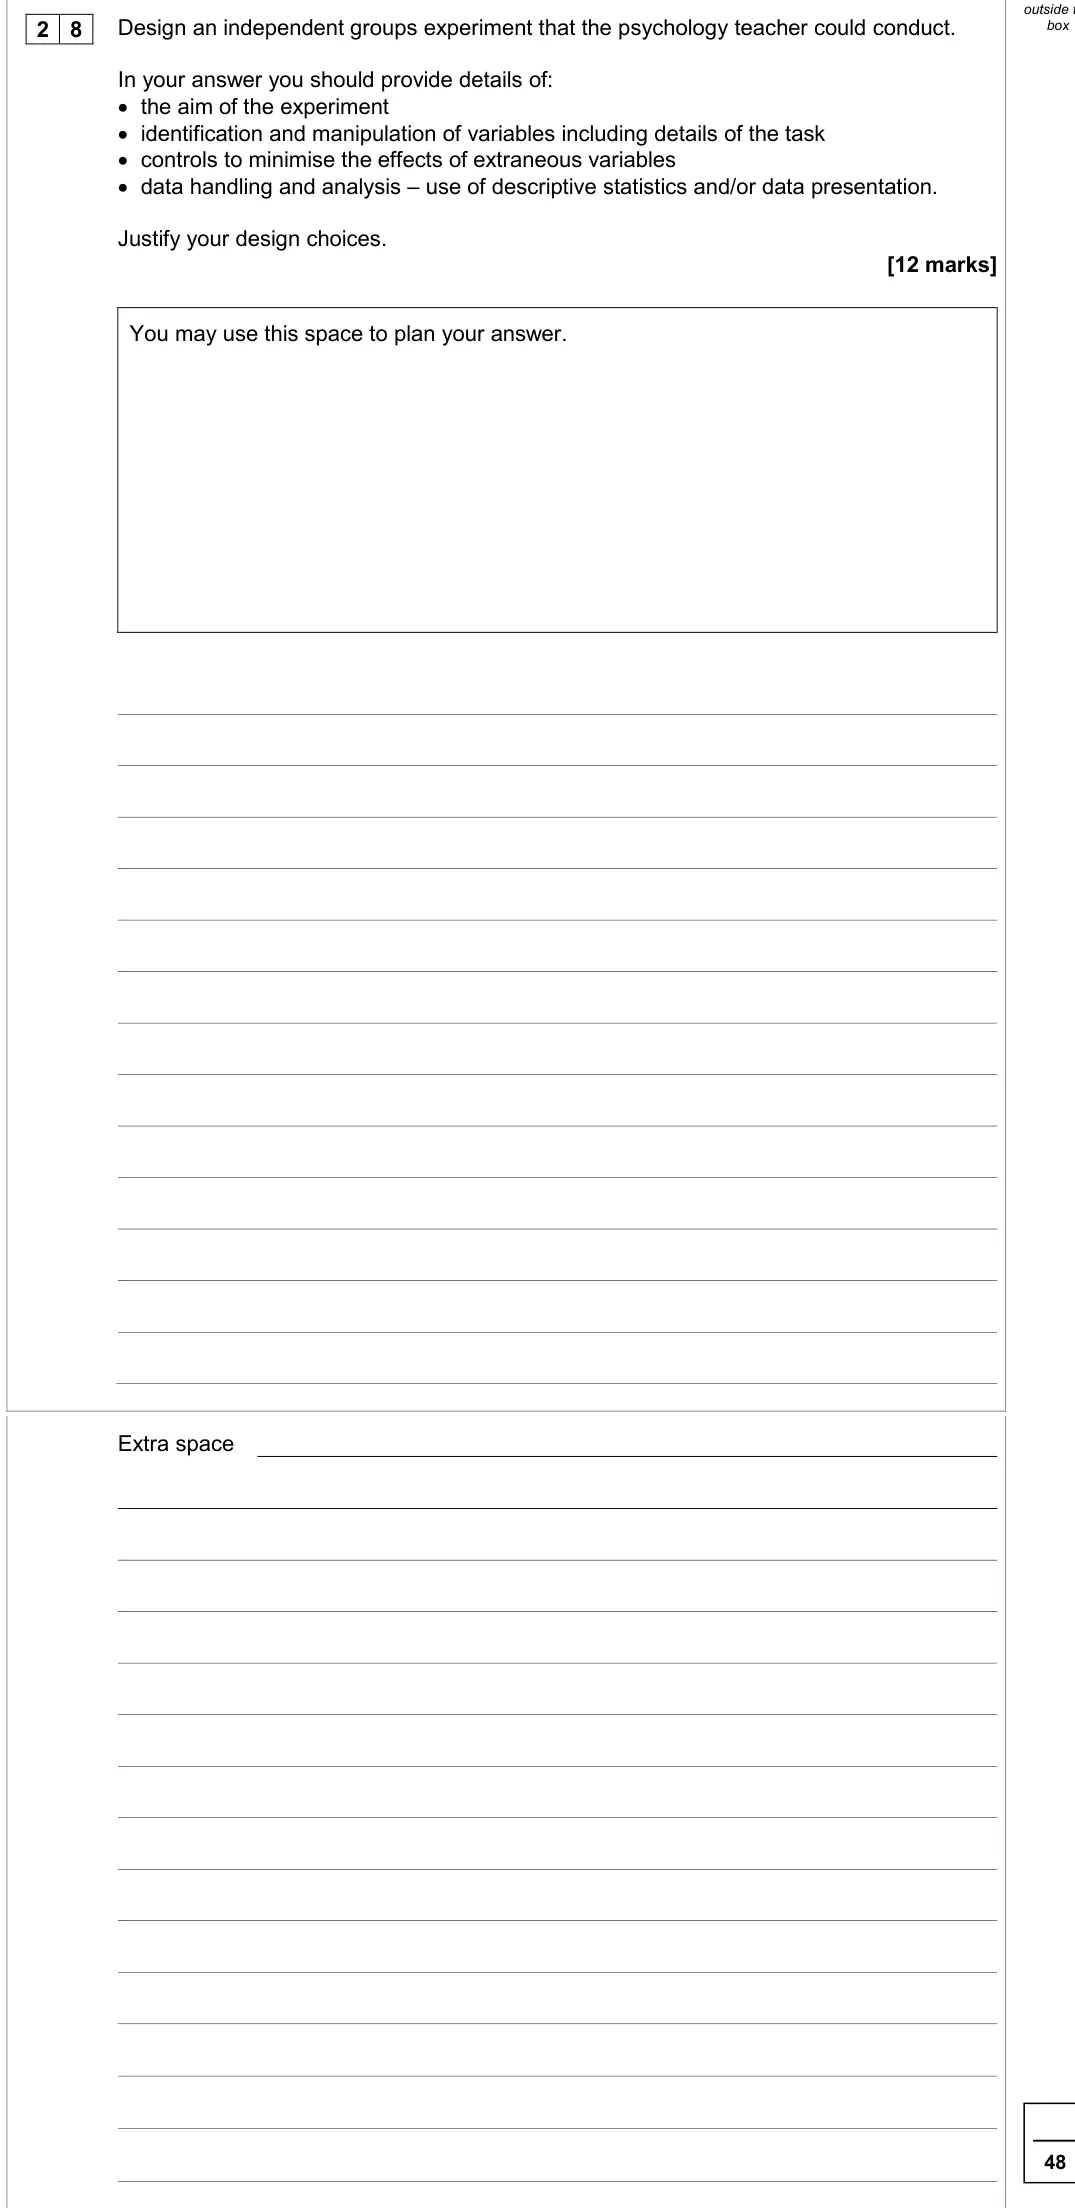
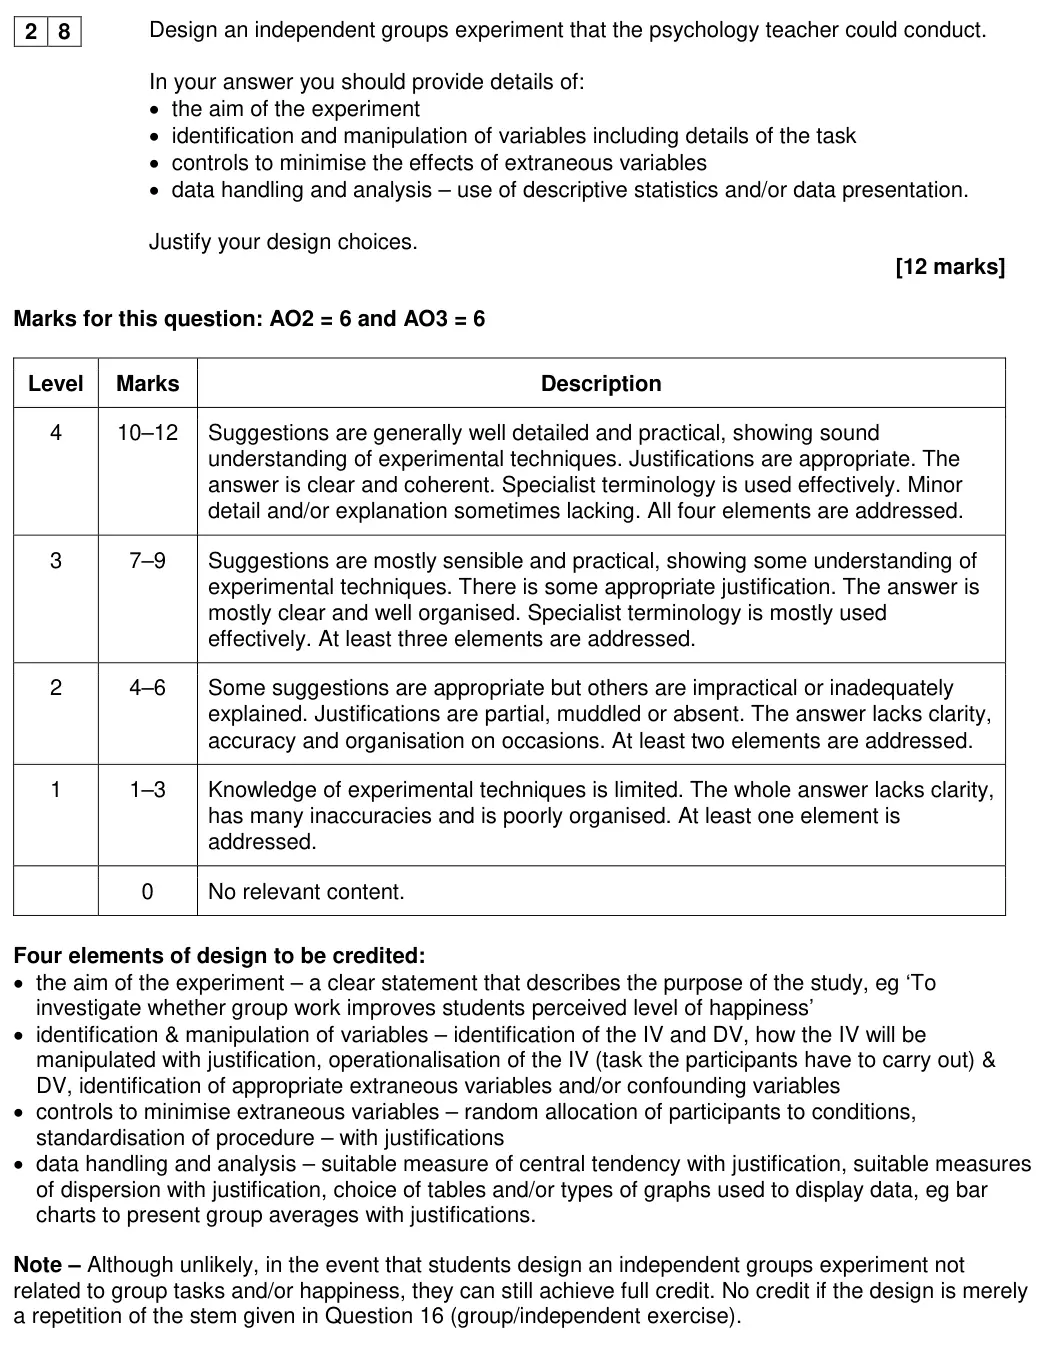
June 2025 · Paper 2 · Q2012 marksAO2=6, AO3=6Extended writing
Mark scheme, including level descriptors and indicative content
Examiner's comment
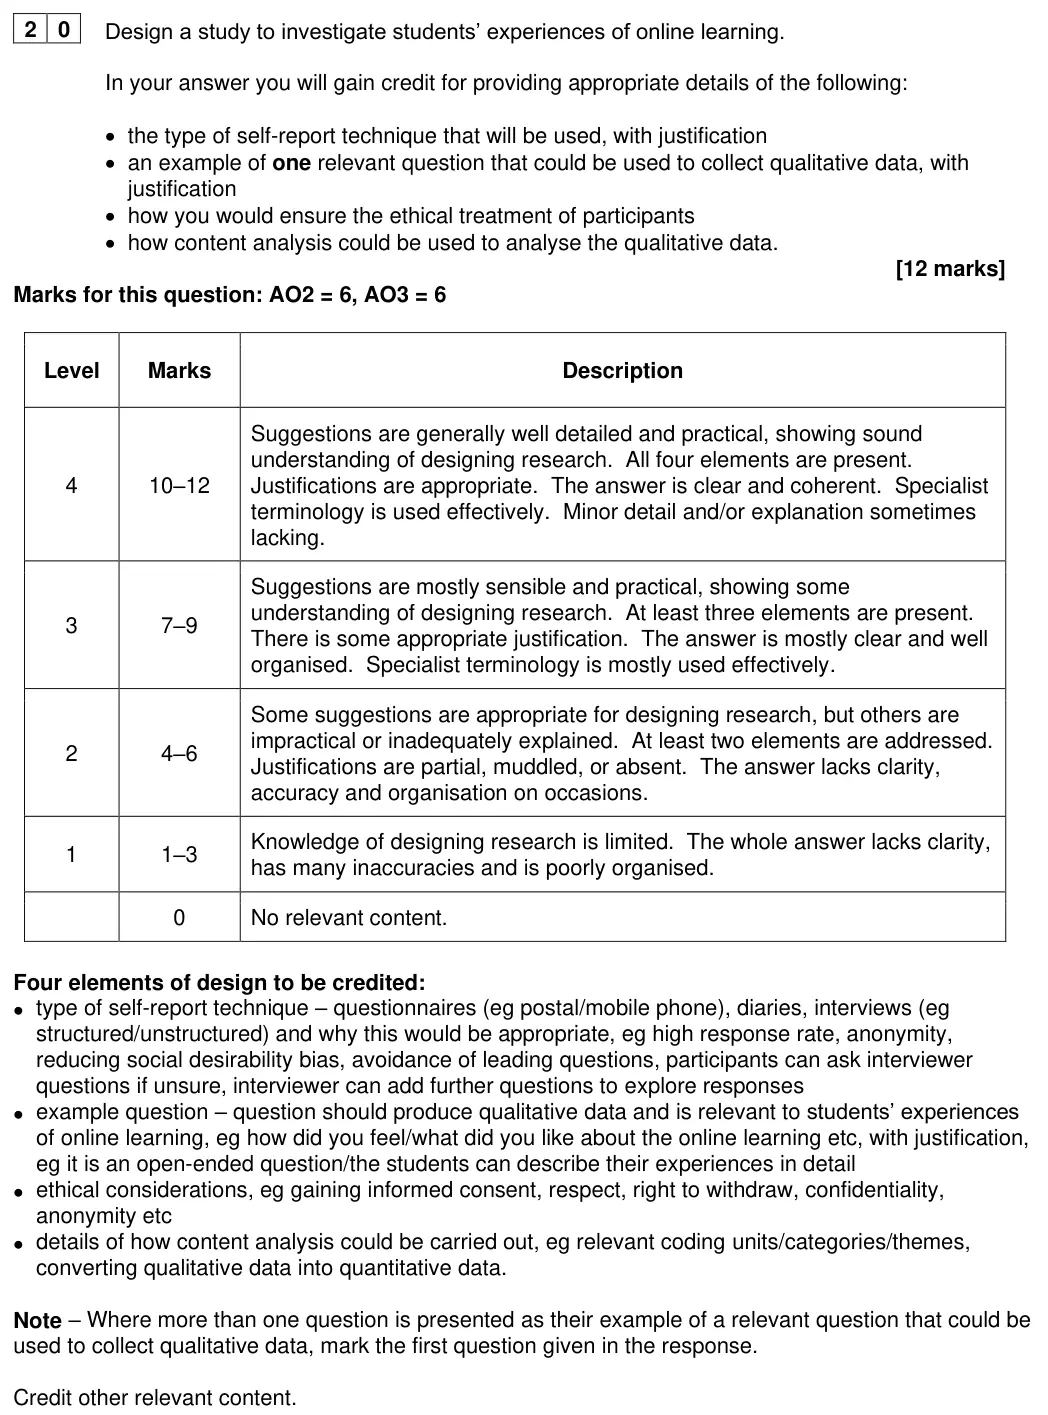
This question discriminated well. Students took different approaches. Some focussed on designing a study to investigate students’ experiences of online learning, covering the bullet points but also including details of the sampling methods, hypothesis, data analysis, etc. The majority addressed the four bullet points as separate questions. The improved examination technique of focussing on the specific bullet points and providing the necessary justifications rather than trying to design a complete study suggests past paper practice and use of feedback. Unfortunately, some who just focussed on the bullet points provided very few details, especially regarding the technique, although often good justifications were given. Those who provided procedural detail tended to score highly as they were able to shape the rest of their response to their design. Some excellent justifications were provided although some were generic. Some answers gave advantages and disadvantages of different self-report techniques without clear justification for the one selected. Suggested questions were mostly appropriate although some would clearly yield quantitative data. Credit was given for various justifications, including the context set, features of a good question and/or justification for being a qualitative question or for gathering qualitative data. In terms of ethics, students often used protection from harm, for example, keeping results confidential etc without explaining how they would do this. There was frequent muddling of brief and debrief. Better answers were those where the ethics were clearly linked to the study. Where analysis was covered this was usually done well, however, some responses lacked detail, and others did not provide the full process. Stronger responses provided the full process and put their analysis in context, for example, by suggesting relevant categories.
Notes from the mark scheme and report
four elements: self-report technique with justification, one qualitative question with justification (only first question marked), ethics explained HOW, content analysis (coding units/categories, converting to quantitative)
Level 4 needs all four
some example questions would produce quantitative data
June 2025 · Paper 3 · Q22 marksAO2=2Research methods
Mark scheme, including level descriptors and indicative content
Examiner's comment
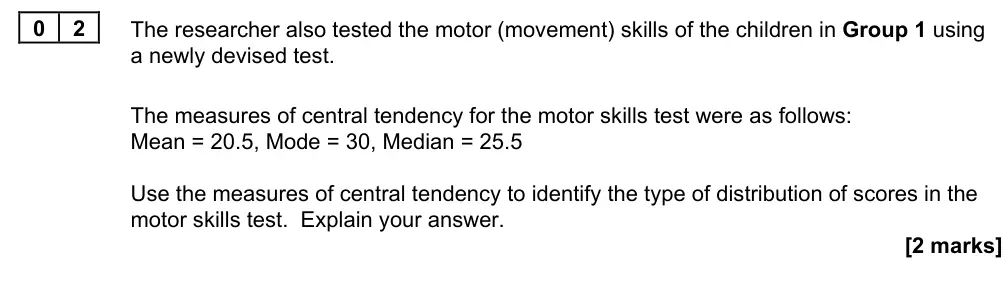
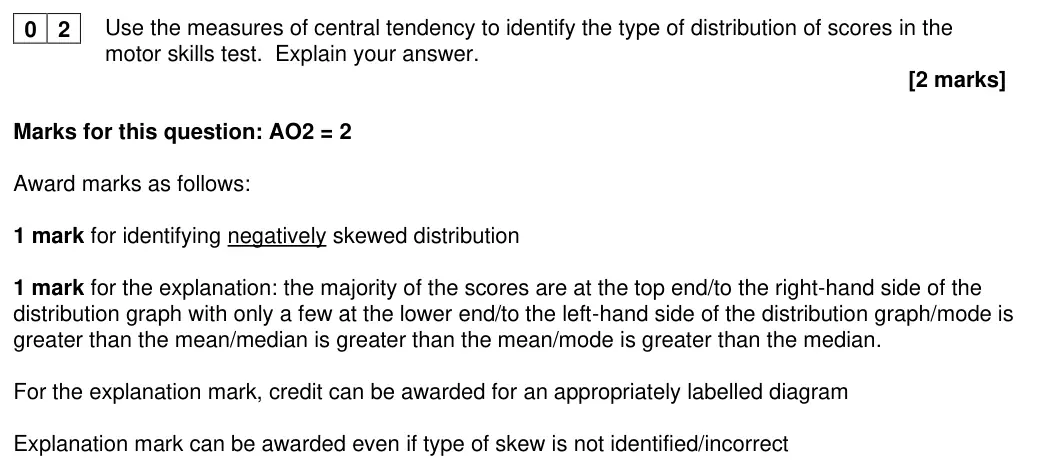
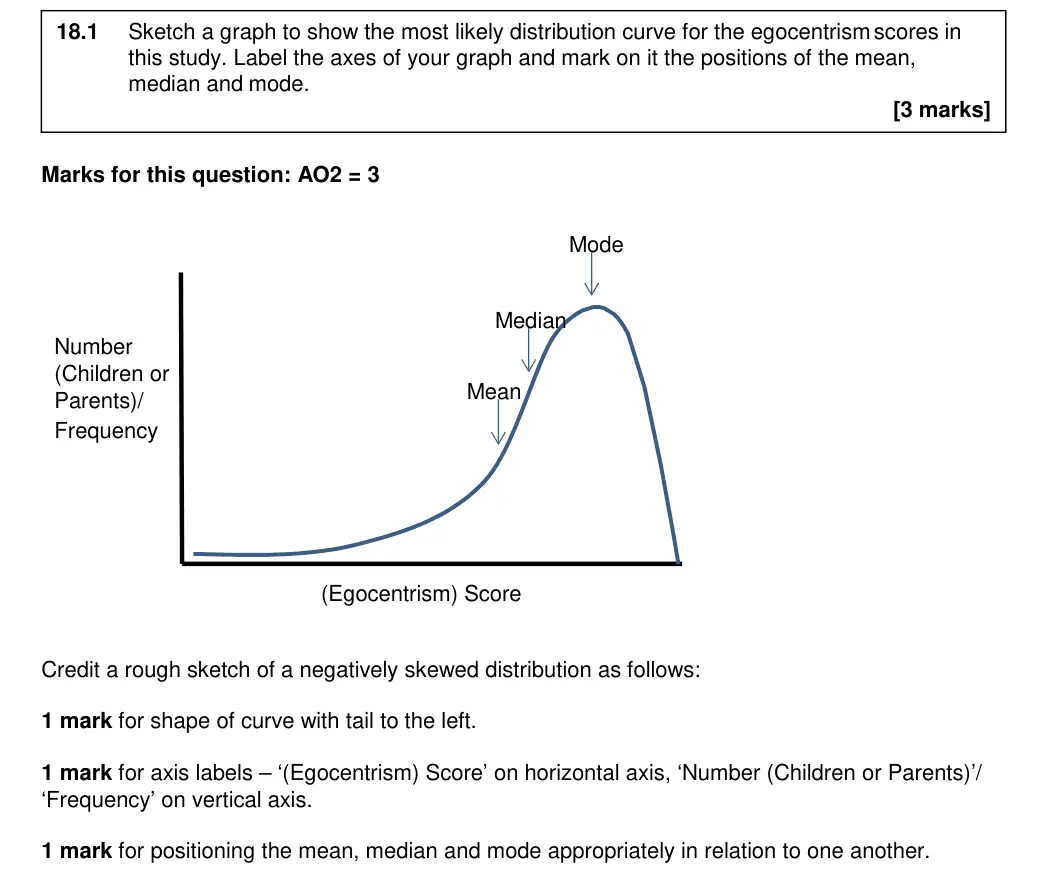
For 02, students had to identify negatively skewed distribution by name, but many were not able to do that. A large percentage opted for positive skew, negative distribution or left skew, none of which received credit. However, it was still possible to pick up the elaboration for some comment about the relative position of the measures of central tendency, such as the mode being the largest value of the three.
Notes from the mark scheme and report
1 mark negatively skewed
1 mark explanation (most scores at top end / mode > median > mean)
labelled diagram can earn explanation mark
explanation mark available even if skew misidentified
June 2025 · Paper 3 · Q32 marksAO3=2Research methods
Mark scheme, including level descriptors and indicative content
Examiner's comment
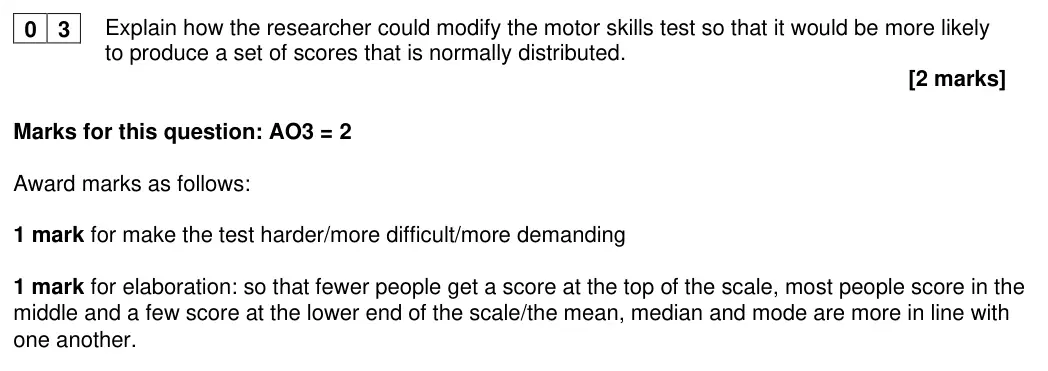
Question 03 was one the least successfully answered questions on the paper. Those students who had misunderstood the previous question were not able to explain how the test could be modified to produce a more normal distribution. Even those who successfully negotiated 02 struggled. There were lots of references to creating completely new tests, particularly of motor skills, and whilst many of the suggestions were creative, they were not creditworthy.
Notes from the mark scheme and report
1 mark make the test harder + 1 mark elaboration (fewer top scores, most in the middle, mean/median/mode closer)
one of the least successfully answered questions
June 2025 · Paper 3 · Q44 marksAO3=4Research methods
Mark scheme, including level descriptors and indicative content
Examiner's comment
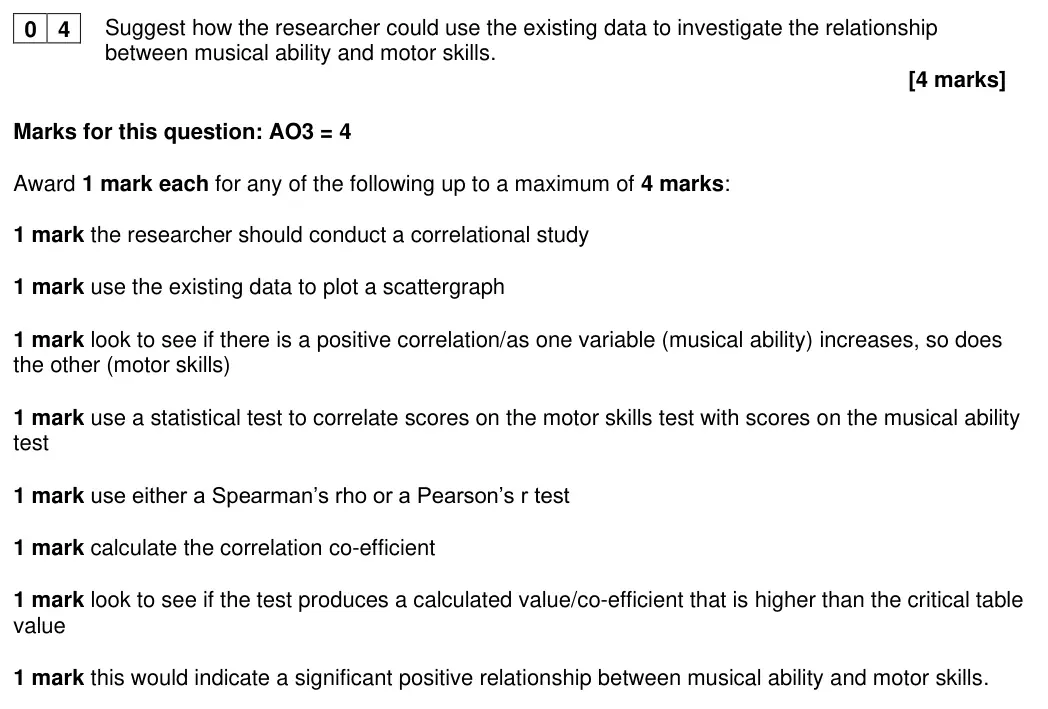
Most students were able to score at least 2 marks on question 04. Some notion that the researcher would be looking for a correlation between the two variables was the most popular route to the first mark, followed by reference to the drawing of a scattergraph. A small number of better-informed students talked of the need to calculate a correlation coefficient, and still fewer suggested the use of a statistical test of significance, for example Spearman’s.
Notes from the mark scheme and report
1 mark each up to 4: correlational analysis, plot scattergram, look for positive correlation, Spearman's rho/Pearson's r, calculate coefficient, compare with critical value, significant positive relationship
few mentioned coefficient or significance test
June 2024 · Paper 1 · Q65 marksAO3=5Research methodsMedium
Mark scheme, including level descriptors and indicative content
Examiner's comment
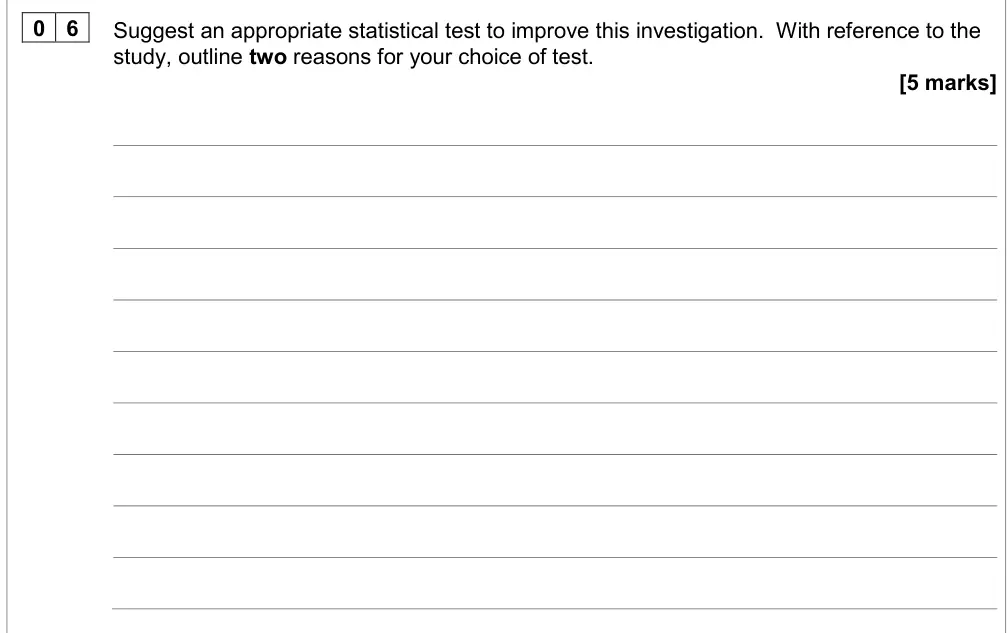
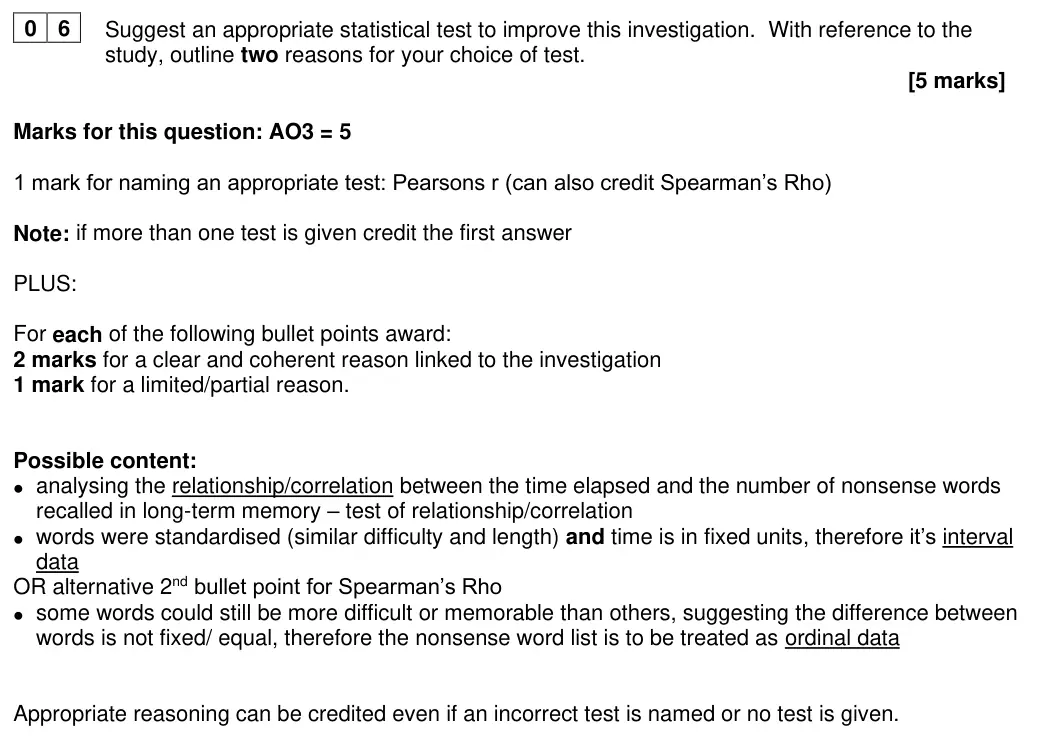
Students typically performed very well in question B6 which required students to identify an appropriate statistical test and outline two reasons for their choice. The scenario presented in the paper was a correlation, which required a test of relationship. However, the data presented could be reasonably interpreted/dealt with in two ways (at an interval or ordinal level) and as such both Spearman’s rho and Pearsons r were deemed creditworthy. However, to gain further marks the reasoning behind the choice of level of measurement needed to be clear and precise. Overall, students scored well in this question, gaining a mean of 2.5 marks, and over thirty seven percent of students gaining either 4 or 5 marks. In this strong student response, the only part missing for full marks relates to the justification of data. For Pearsons r, both variables need to be interval data, which would include time (as stated in the response), but also the standardised word list Although this response outlines the use of Spearman’s rho, the student has fully justified this in the context of the scenario presented, and worthy of full marks In question B6 a common misunderstanding was to claim that the investigation was a test of difference as opposed to a relationship and this cost them marks. Students would be well advised to revise thoroughly statistical testing and develop greater familiarity with inferential statistics.
Notes from the mark scheme and report
1 mark Pearson's r (Spearman's rho also credited
first test only) + 2 reasons x 2 marks linked to study: test of relationship, interval data (standardised words, fixed time units) or ordinal for Spearman's
reasoning credited even with wrong test
Pearson's needs both variables interval
June 2024 · AS Paper 1 · Q92 marksAO2=2Research methodsMedium
Mark scheme, including level descriptors and indicative content
Examiner's comment
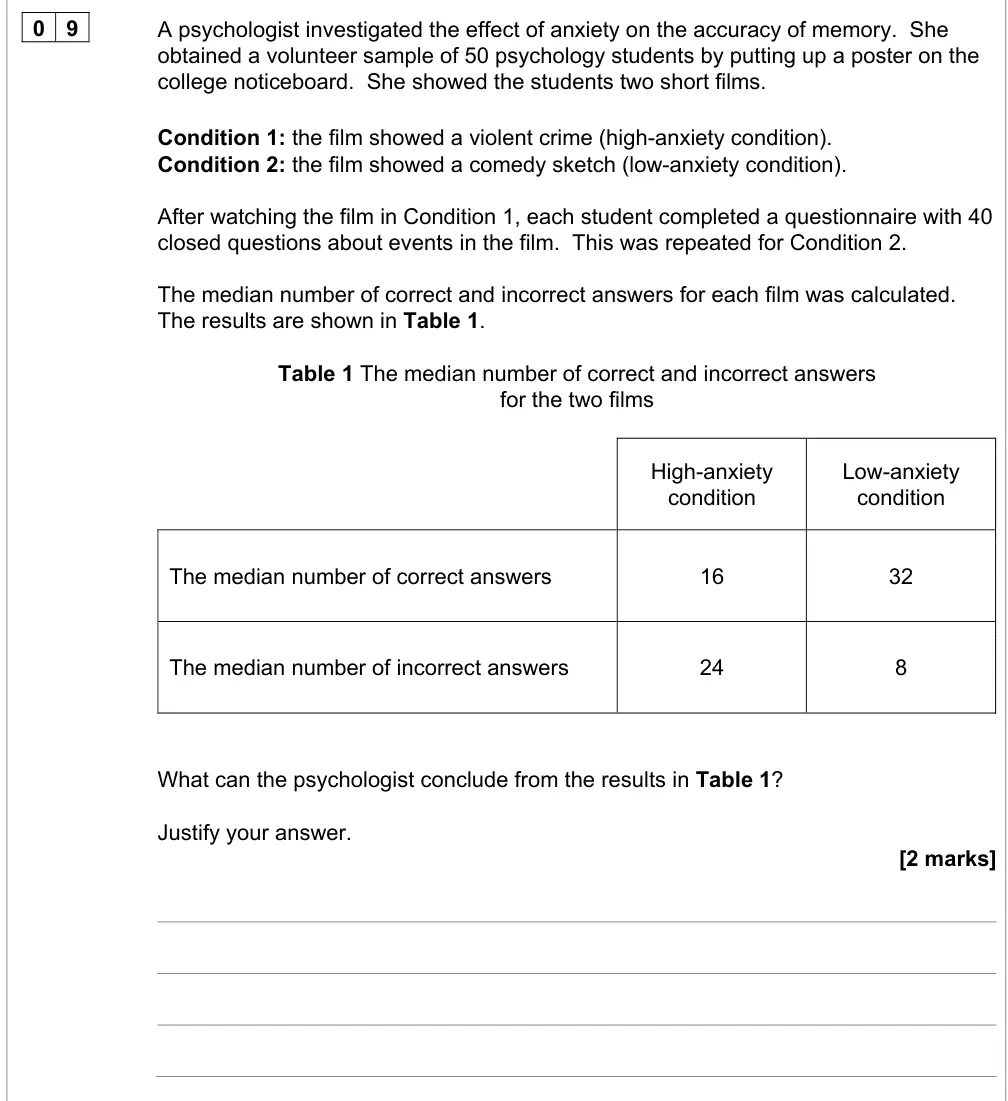
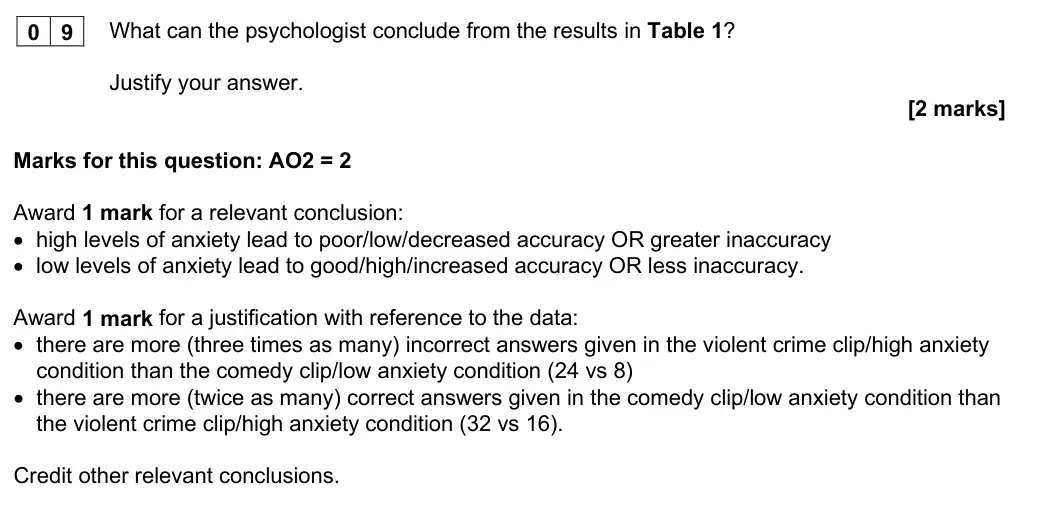
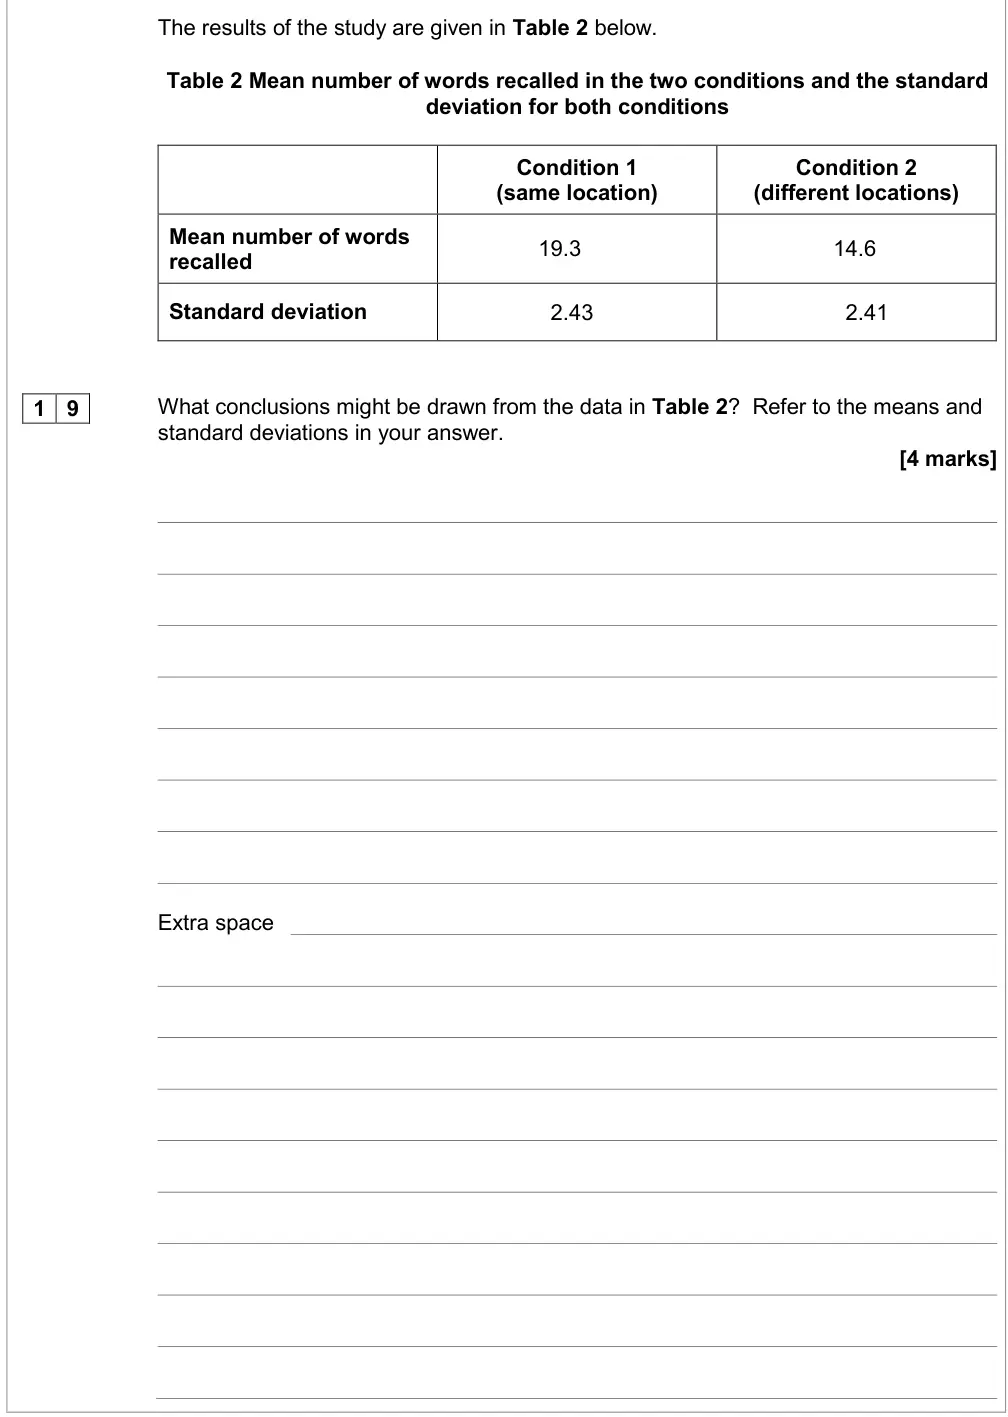
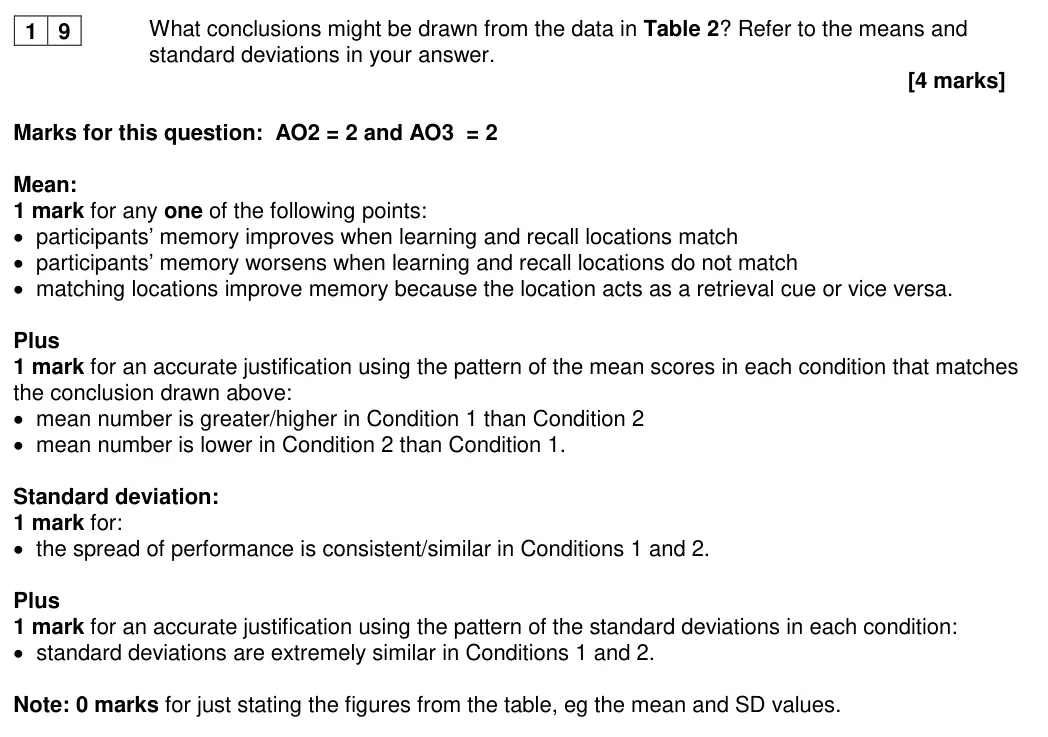
Whilst 36% of students scored full marks on this question, there were many who did not know what a conclusion was/how it was different from a finding. Weaker students did not make a comparison between the two conditions, just restating the data in table 1. Strong answers demonstrated that the conclusion needed to refer to accuracy rather than overall memory. Some students expressed their conclusion as a correlation which was not acceptable as this was study comparing high and low anxiety conditions, not measuring levels of anxiety. There were the fewest not attempted parts for this question, with less than 1% leaving the answer blank.
Notes from the mark scheme and report
conclusion about ACCURACY (high anxiety reduces accuracy) + justification from medians (24 vs 8 incorrect, 16 vs 32 correct)
many confused conclusion with finding or restated data
correlational conclusions rejected
June 2024 · AS Paper 1 · Q112 marksAO2=2Research methodsMedium
Mark scheme, including level descriptors and indicative content
Examiner's comment
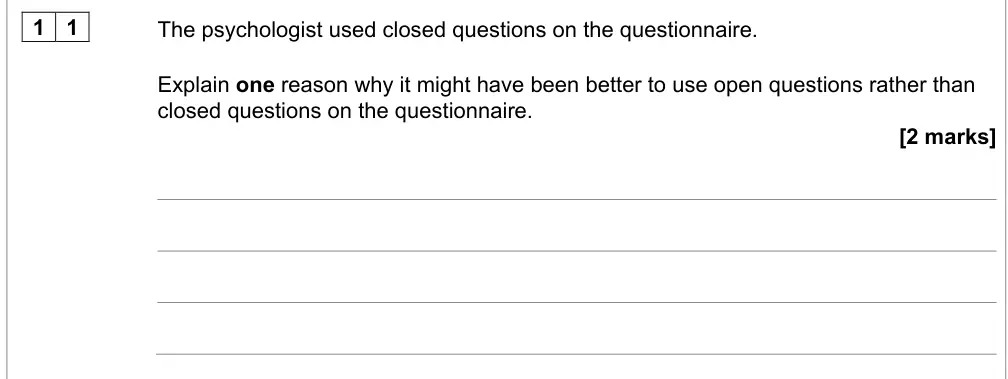
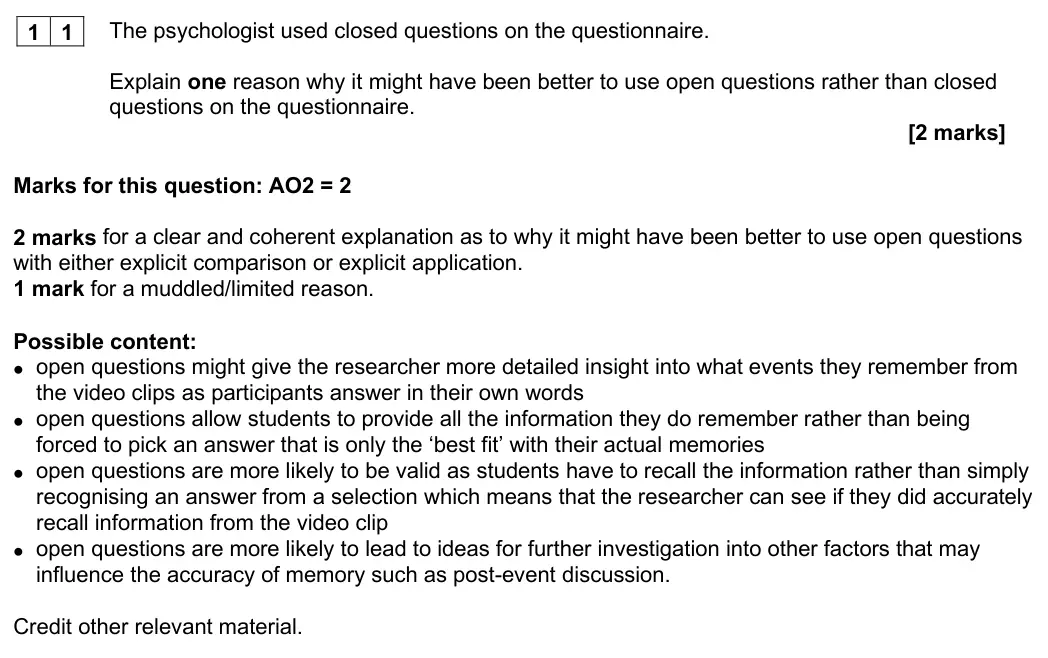
There was generally a good understanding of strengths of open questions, but answers were not always placed in context. Some students focused on the problem of closed questions rather than explaining why using open might have been better, which was not explicitly answering the question. Good answers went beyond saying ‘gives more detail’ and were able to give explicit application to the scenario, for example, gives the researcher more detail into which parts/aspects of the video clips the participants remembered. For this question, 46% of students scored full marks and the mean score was one of the highest on the Memory section, with 66% of the max marks available.
Notes from the mark scheme and report
open questions: richer detail of what was remembered from the films, recall vs recognition
needs explicit comparison or application
criticising closed questions alone did not answer
June 2024 · AS Paper 2 · Q8.12 marksAO2=2CalculationEasy
Mark scheme, including level descriptors and indicative content
Examiner's comment
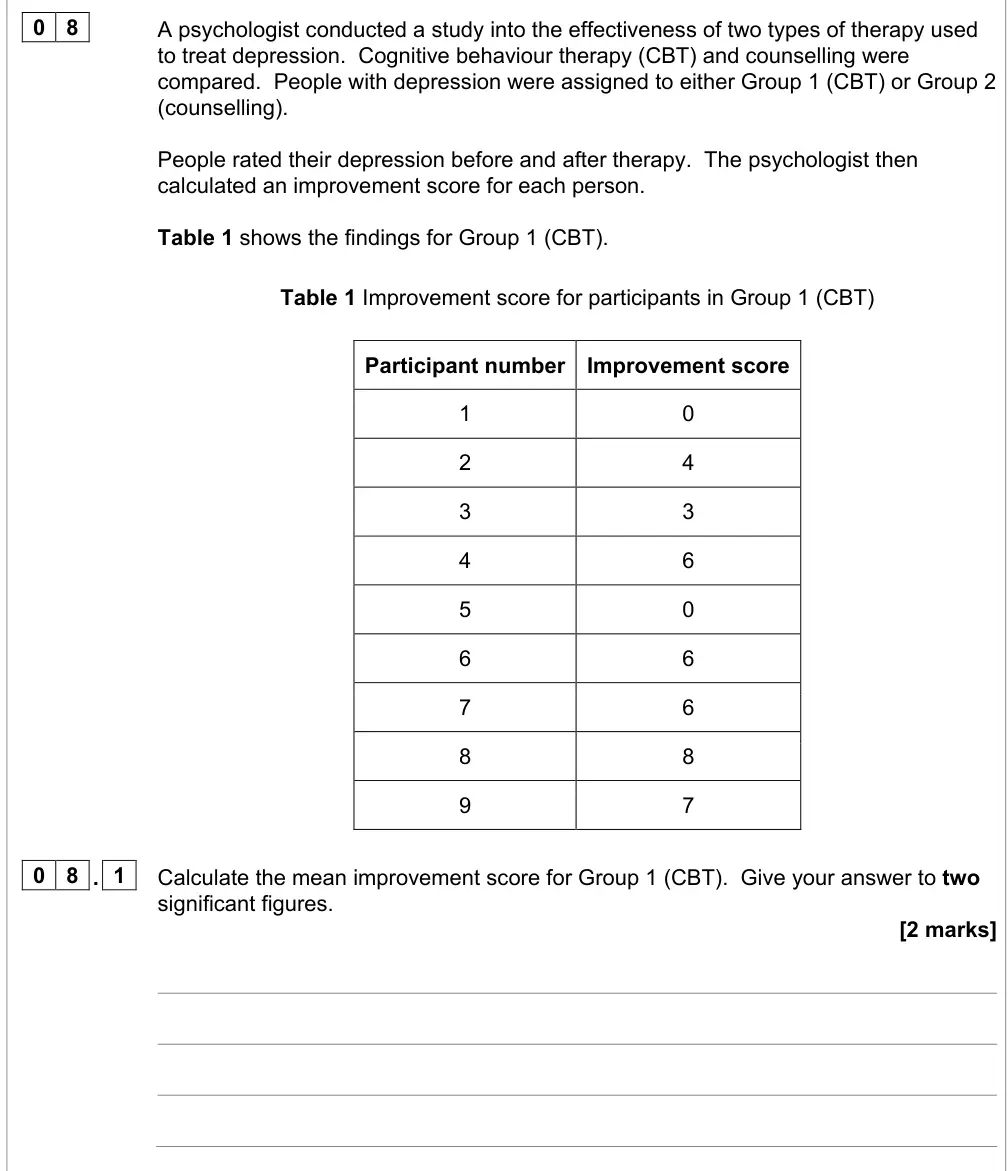
This was particularly evident in Q7, a multiple-choice question on behaviours characteristically shown by people with OCD, and in Q8.1 and Q8.2, two research methods questions asking students to calculate a mean and use this to draw a conclusion. Around three quarters of responses for each of these questions were awarded full marks. Students particularly excelled in Q8.1 and Q8.2 where they were required to calculate the mean and draw a conclusion using this calculation. However, a minority of students did not give their answer to Q18.1 to 2 significant figures as the question asked.
Notes from the mark scheme and report
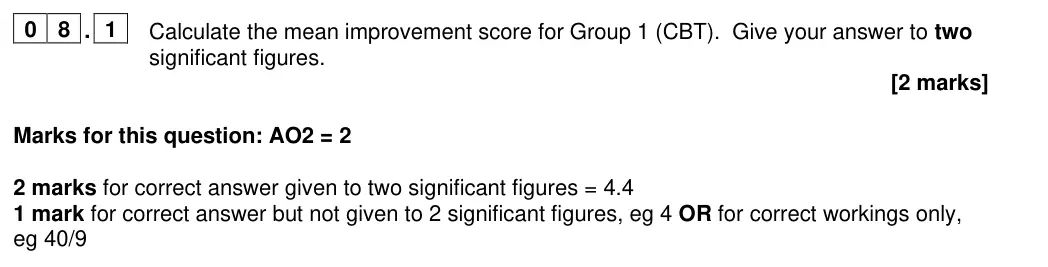
40/9 = 4.4
1 mark for correct but not 2 s.f. or for workings only
June 2024 · AS Paper 2 · Q8.22 marksAO2=1, AO3=1Research methodsEasy
Mark scheme, including level descriptors and indicative content
Examiner's comment
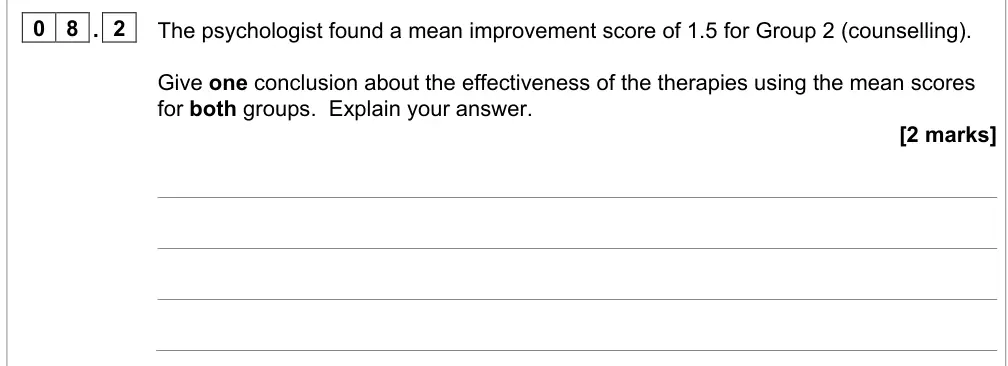
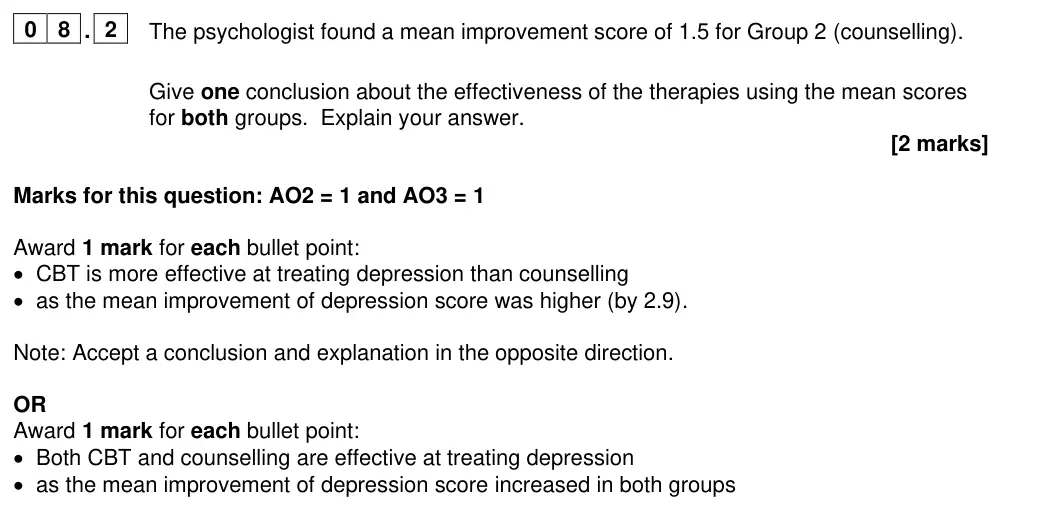
This was particularly evident in Q7, a multiple-choice question on behaviours characteristically shown by people with OCD, and in Q8.1 and Q8.2, two research methods questions asking students to calculate a mean and use this to draw a conclusion. Around three quarters of responses for each of these questions were awarded full marks. Students particularly excelled in Q8.1 and Q8.2 where they were required to calculate the mean and draw a conclusion using this calculation.
Notes from the mark scheme and report
CBT more effective + higher mean improvement (by 2.9)
or both effective as both improved
well answered
June 2024 · Paper 2 · Q112 marksAO2=2Research methods
Mark scheme, including level descriptors and indicative content
Examiner's comment
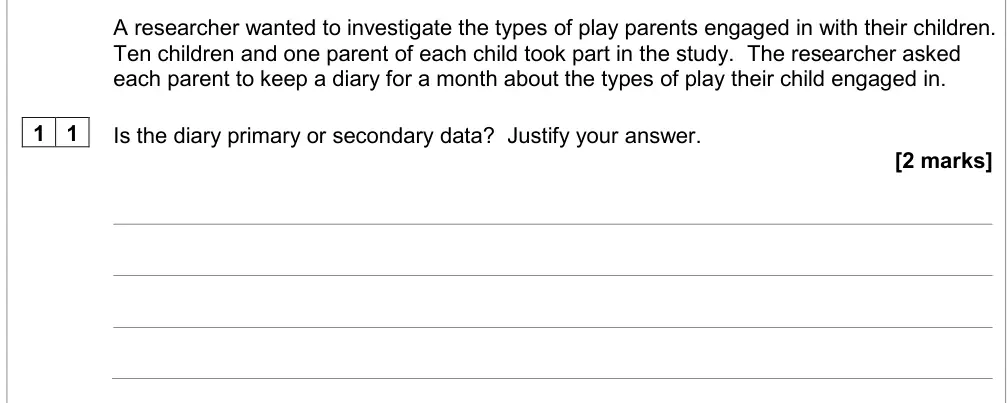
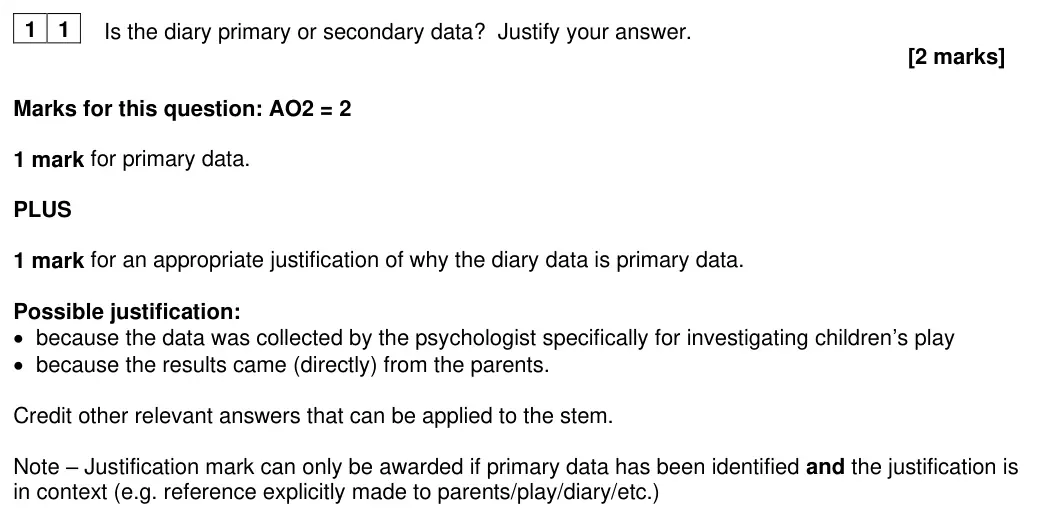
Overall students seemed to know the difference between primary and secondary data, but many students were confused over whether data provided via the parents made the data secondary data as it was not ‘directly’ gathered by the researcher. This suggests they had learned definitions of primary and secondary data but struggled to fit these to the context given, questioning their deeper understanding. Although there were some good, contextualised justifications, many students did not apply their justifications and therefore were unable to access the second mark, with responses often defining primary data rather than using the stem to justify why the diary data is primary data.
Notes from the mark scheme and report
primary (1) + contextualised justification (collected for this study, directly from parents)
justification only if primary identified
many thought data via parents made it secondary
definitions without context
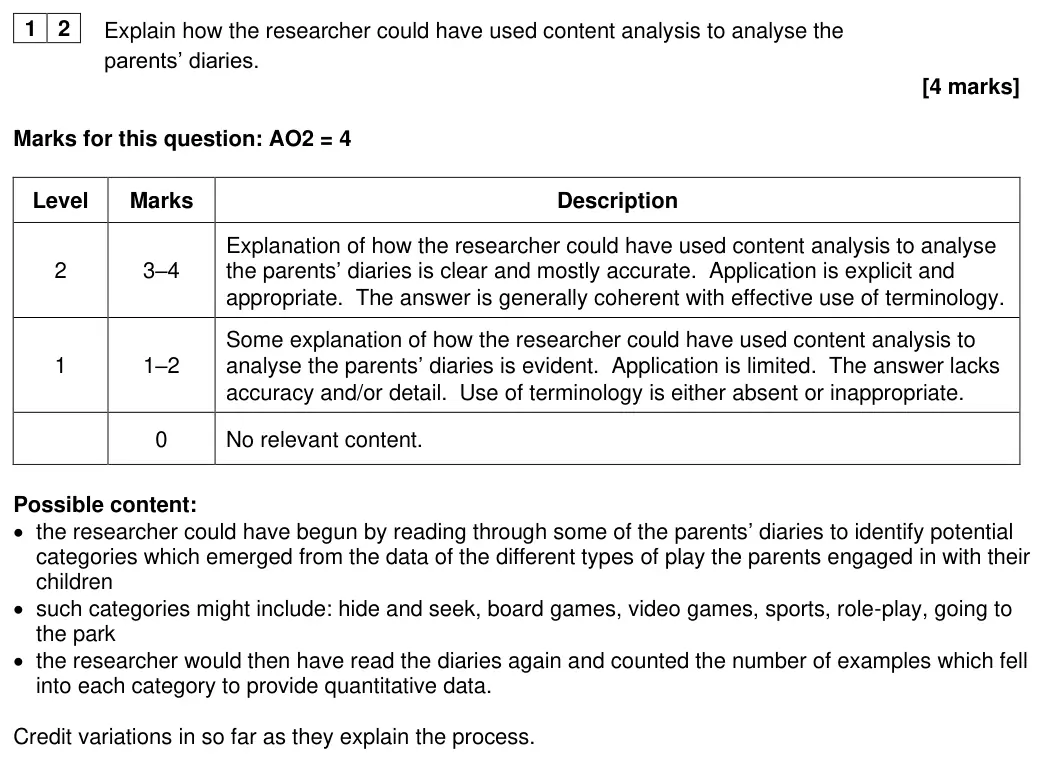
June 2024 · Paper 2 · Q124 marksAO2=4Research methods
Mark scheme, including level descriptors and indicative content
Examiner's comment
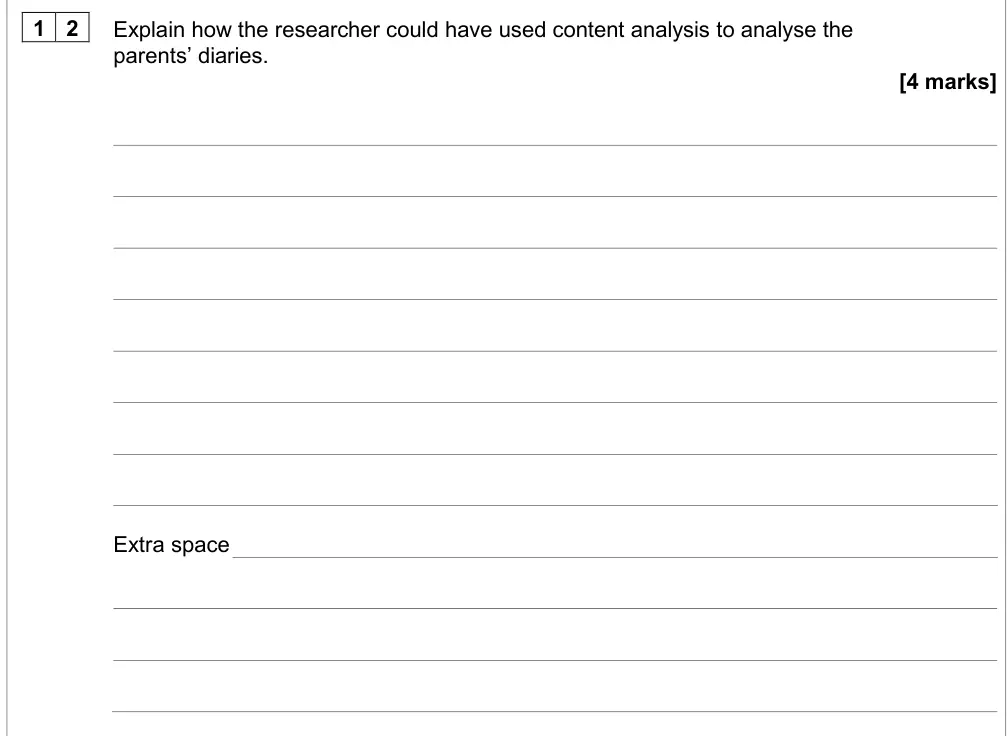
This question discriminated well. There were some excellent responses provided by students who clearly had a good knowledge of how to use content analysis and were able to apply this effectively throughout their responses, giving a range of suitable categories of different types of play and presenting the whole process clearly and accurately. Many students could define what content analysis was but could not describe how it could be used. Other limited responses described the process but did not apply it to the context given. Contrastingly, some were able to apply their knowledge to create categories in the context of the stem but did not describe the rest of the process. Whilst others were clearly unaware of what the term meant and provided a range of suggestions for how one may analyse the content of the diaries, from plotting data onto graphs, to inferential statistics, to comparing data with other studies. There was also a lot of confusion with thematic analysis. Students may benefit from using content analysis in a practical context, so they gain a deeper understanding of how it is used to analyse data. Students should know what an ‘explain how’ question is requiring and should apply their responses to the context given and ensure they describe the whole process for these types of questions.
Notes from the mark scheme and report
read diaries to identify play categories (hide and seek, board games...), re-read and tally examples to give quantitative data
whole process applied for level 2
definitions only
confusion with thematic analysis (removed in v1.4)
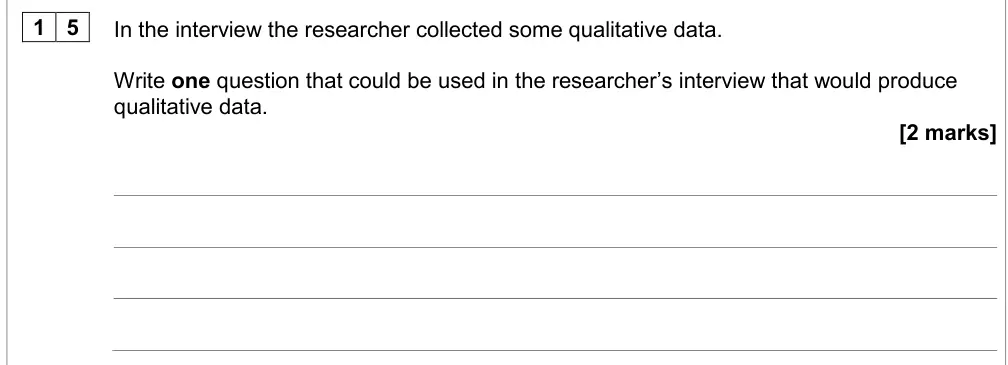
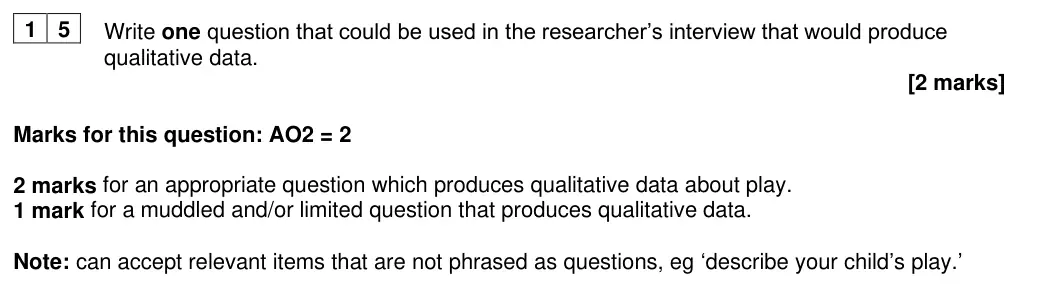
June 2024 · Paper 2 · Q152 marksAO2=2Research methods
Mark scheme, including level descriptors and indicative content
Examiner's comment
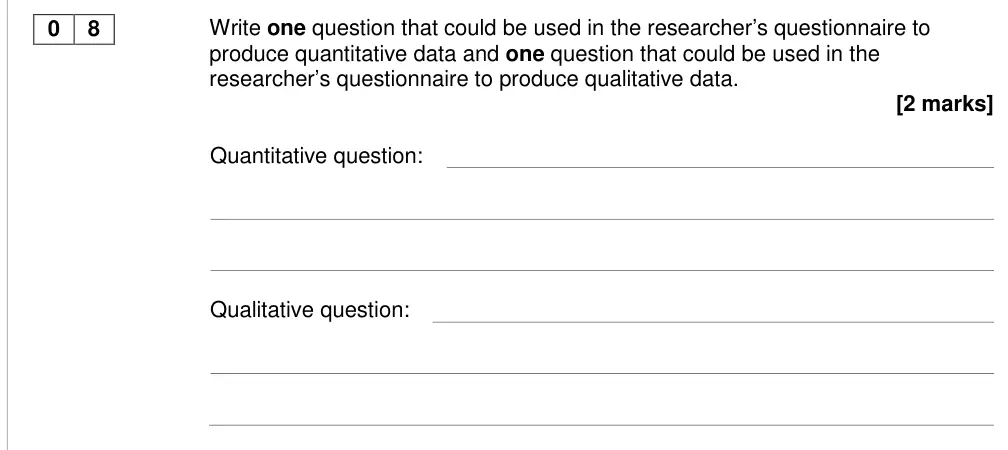
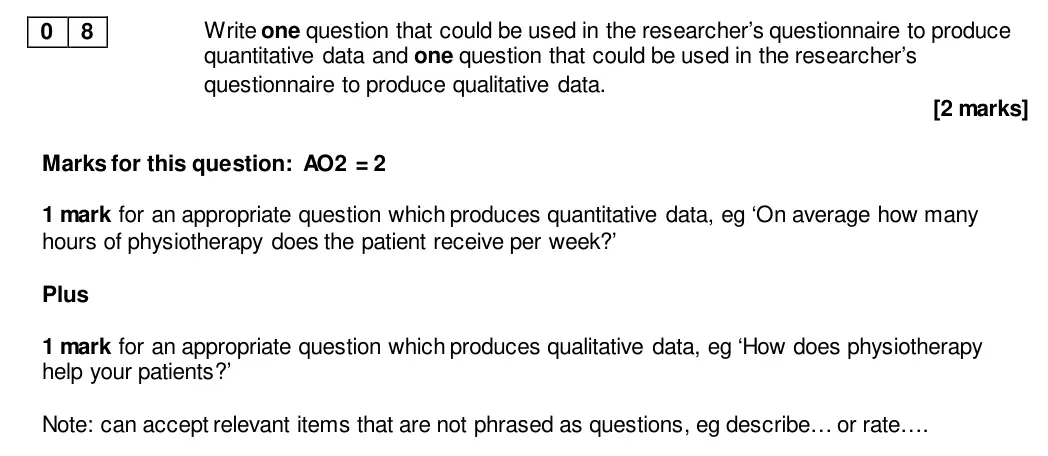
This was a very well answered question. Most students achieved full marks, showing a thorough understanding of qualitative data. Closed questions which yielded responses in words were awarded credit. It was rare to see questions which yielded quantitative data and most responses were focused on play.
Notes from the mark scheme and report
open question about the child's play producing qualitative data (instructions like 'describe your child's play' accepted)
very well answered
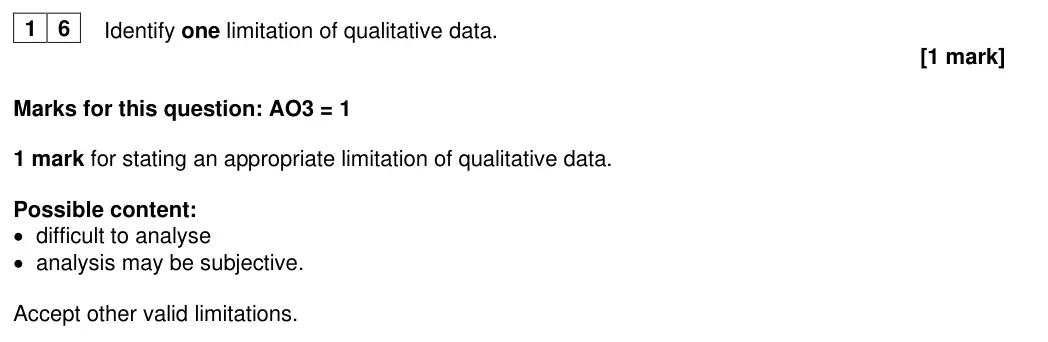
June 2024 · Paper 2 · Q161 markAO3=1Research methods
Mark scheme, including level descriptors and indicative content
Examiner's comment
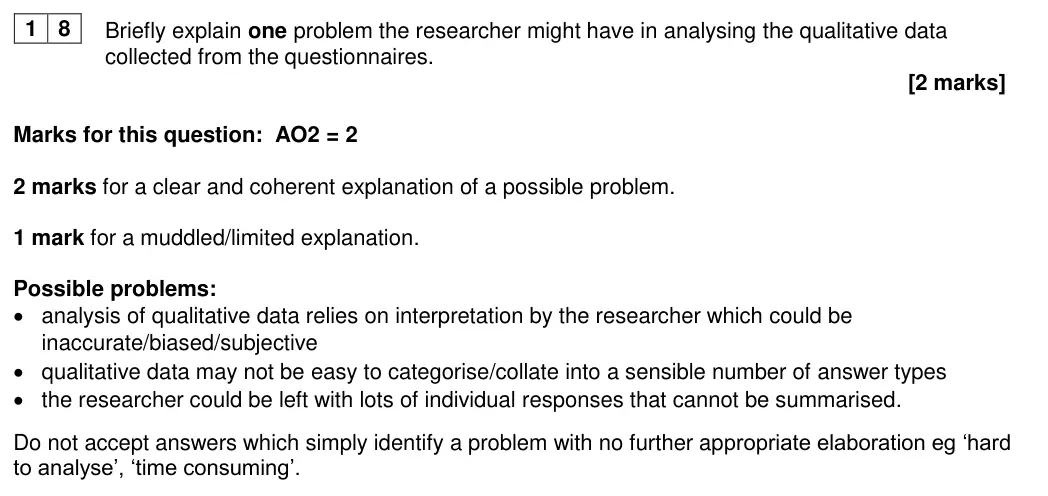
This question was answered well, with the first bullet point of the mark scheme being the most common response. The most common error was when students gave vague responses such as ‘time consuming,’ not recognising that quantitative data may also be equally/more time consuming. Students should be specific, for example stating that ‘qualitative data may be more time consuming to analyse than quantitative data.’ Likewise, students often stated that qualitative data may be subjective again failing to consider that quantitative self-report data is also subjective and thus they needed to specifically state ‘the analysis of the data can be subjective.’
Notes from the mark scheme and report
e.g. difficult to analyse, analysis subjective
vague 'time consuming' or 'subjective' without specifying analysis not credited
June 2024 · AS Paper 2 · Q18.12 marksAO2=2Calculation
Mark scheme, including level descriptors and indicative content
Examiner's comment
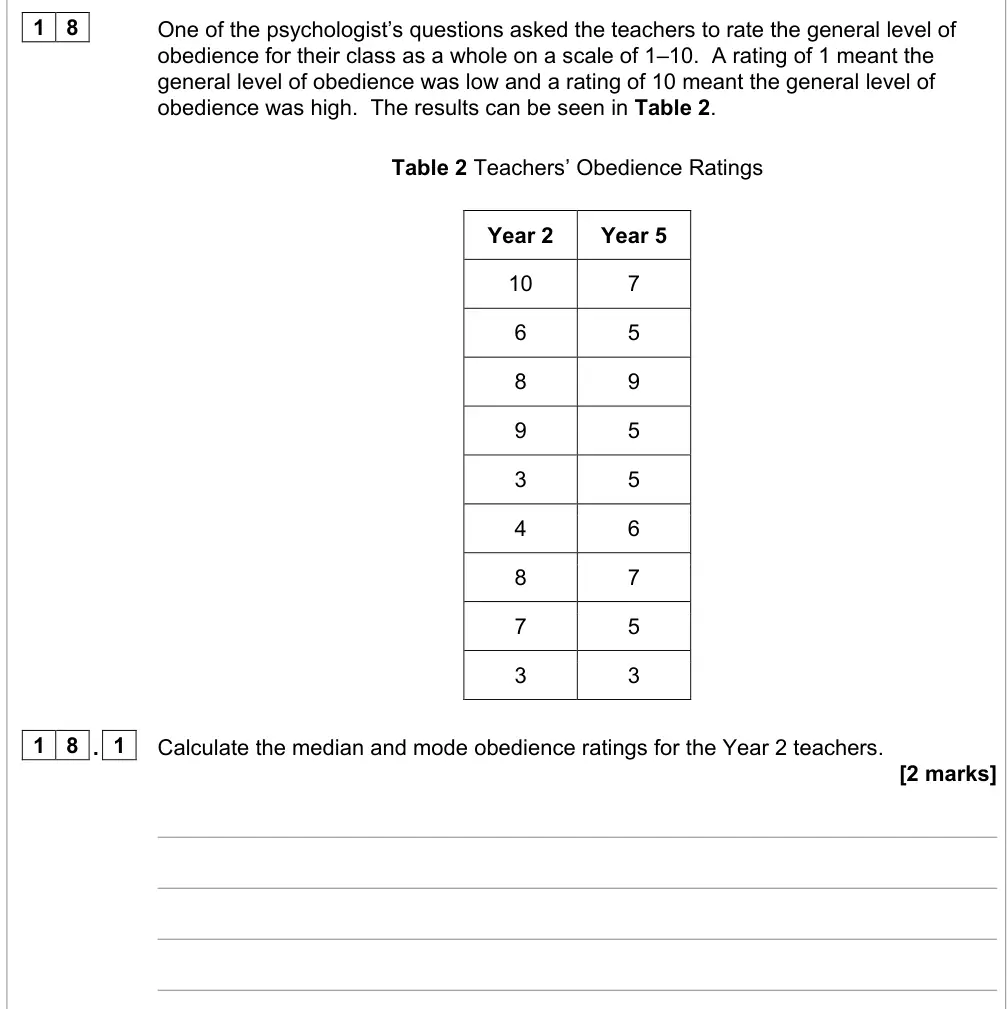
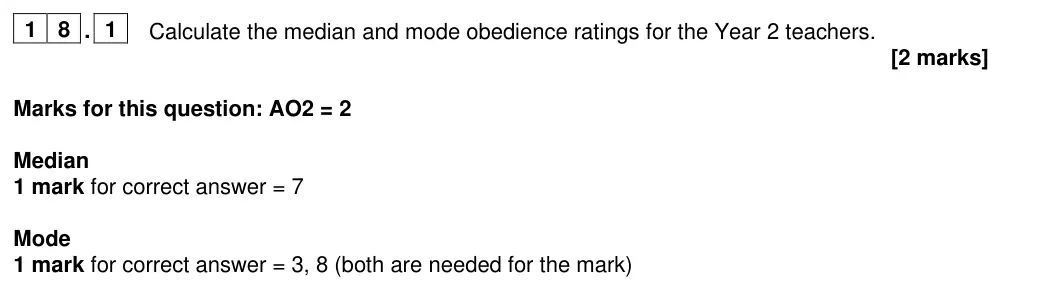
Following on from Q8.1 in Section B: Psychopathology, students were evidently well prepared for calculation questions as they again performed well in Q18.1 where they were required to calculate the median and mode. A small minority of students did appear to become confused as the data set was bimodal (3 and 8) and some either just gave one of the modes or incorrectly answered 5.5 suggesting they did not fully understand how to calculate the mode when there was more than one in a data set. Students were required to give both modes to be awarded the mark.
Notes from the mark scheme and report
median 7
mode 3 and 8 (both needed)
some gave one mode or 5.5
June 2024 · AS Paper 2 · Q18.22 marksAO2=2Research methods
Mark scheme, including level descriptors and indicative content
Examiner's comment
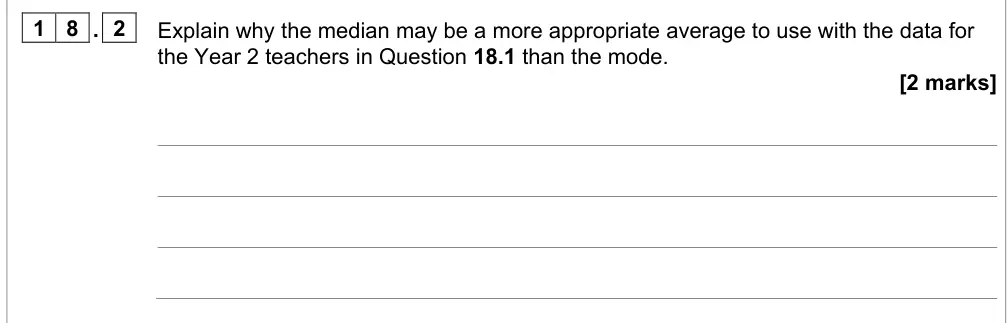
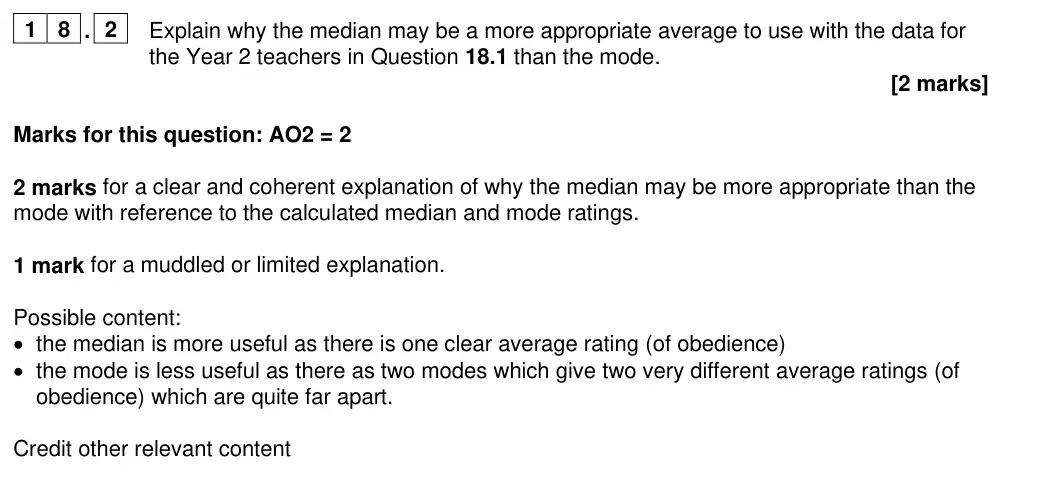
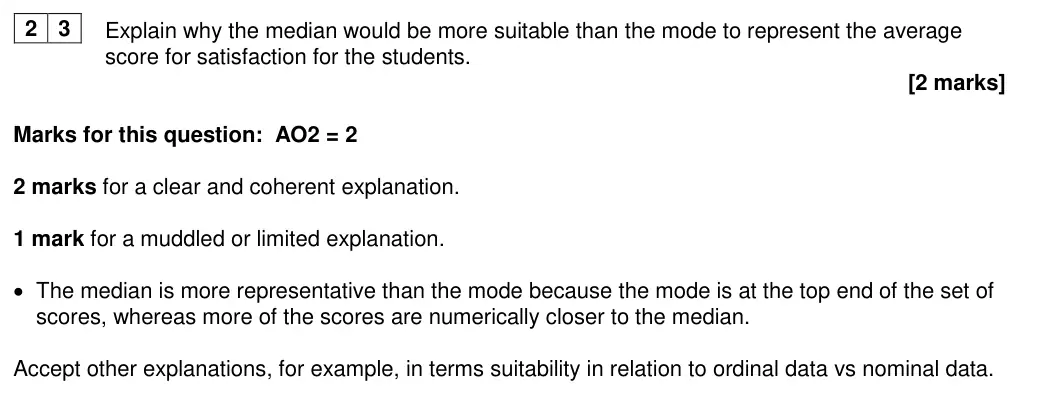
Finally, students struggled to apply their knowledge of a measure of central tendency in Q18.2 and gave largely generic responses which were not about the actual data they had calculated. Despite students appearing comfortable with calculating the median and mode in Q18.1, less than half could go on and explain in Q18.2 why the median might be more appropriate for the data calculated in Q18.1. Some students gave very little, if any, explanation and although they appeared to be able to calculate them, appeared to not really understand their relative strengths and limitations. Of those that appeared to understand these, many students simply gave generic strengths of the median and/or limitations of the mode rather than applying these to the actual calculations from Q18.1 as the question asks. Additionally, the question asks them to explain why the median is better than the mode for this data so there should be some comparison in students’ responses. Exemplification of a successful response A good 2-mark response. This student has clearly identified that there is a difference in the number of average scores (2 modes and 1 median) and has explained that this makes the median more useful (‘since it gives a better idea of central tendency’). Exemplification of a less successful response A typical 1-mark response. This student has clearly identified that there is a difference in the number of average scores (2 modes and 1 median) but has not explained why this makes the median more appropriate. A typical example of a response which cannot be awarded any marks as the explanation is not relevant to the data from Q18.1.
Notes from the mark scheme and report
must refer to the calculated values: one median vs two modes far apart (bimodal)
generic strengths of the median not credited
fewer than half scored
June 2024 · Paper 2 · Q214 marksAO2=4Research methods
Mark scheme, including level descriptors and indicative content
Examiner's comment
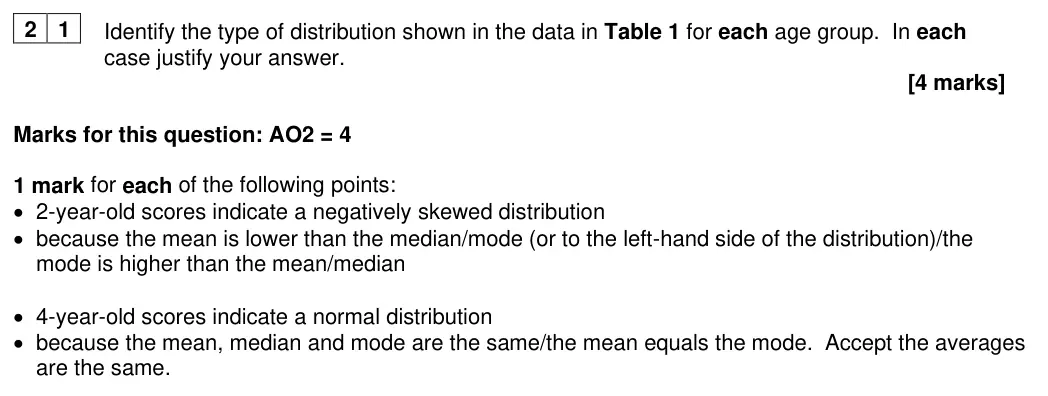
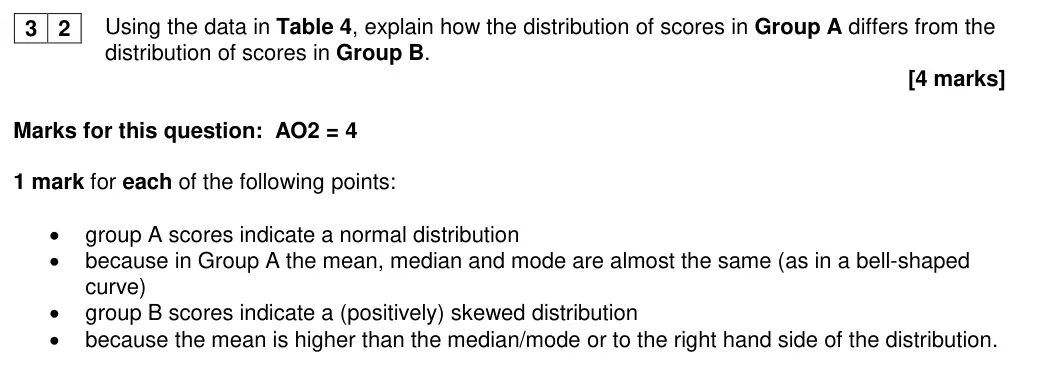
This question differentiated well. It appears that many students still find distributions challenging. Overall, many students muddled positively and negatively skewed distribution and although students gave more accurate responses regarding normal distributions, many could not recall the correct terminology stating, ‘no distribution,’ for example.
June 2024 · Paper 2 · Q222 marksAO2=2Research methods
Mark scheme, including level descriptors and indicative content
Examiner's comment
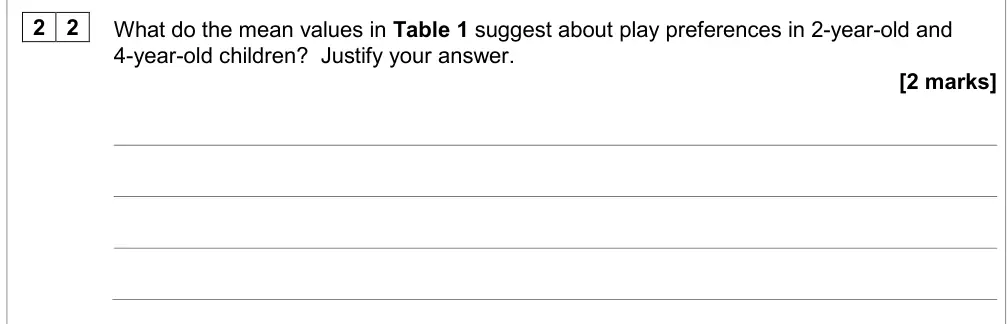
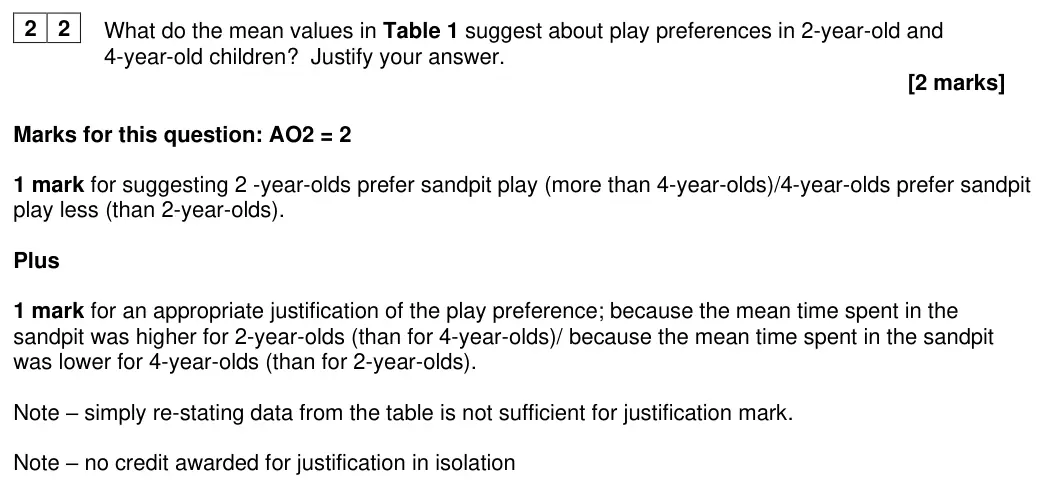
This question was generally well answered. Although some students merely quoted data from the table rather than using it to explain their answer, overall students demonstrated an improved performance, compared to previous series. They recognised that to justify answers with reference to mean values they needed to do more than just re-state the values in the table, with a good range of comparison terms used. The most common error was to describe the result that 2-year-olds spent longer in the sandpit than 4-year-olds, rather than explaining what the difference in the mean values suggested about play preferences.
Notes from the mark scheme and report
2-year-olds prefer the sandpit more than 4-year-olds + comparative justification (mean 11 vs 6)
restating data not enough
describing the result instead of the preference
June 2024 · Paper 2 · Q236 marksAO2=6Research methods
Mark scheme, including level descriptors and indicative content
Examiner's comment
Students appeared well prepared for this question with clear reasons provided for the choice of statistical tests being given in the context of the stem. Although the question differentiated well, the modal mark for this question was six suggesting a real improvement in performance from previous series. For those who did not score full marks on this question this tended to be due to the lack of context/link to the stem or confusion over levels of measurement and what constitutes nominal, ordinal and interval data. There was a surprising number of responses in which the rationale for independent groups design was confused and others justified interval data as being due to the duration of the observation as opposed to the actual dependent variable measured.
Notes from the mark scheme and report
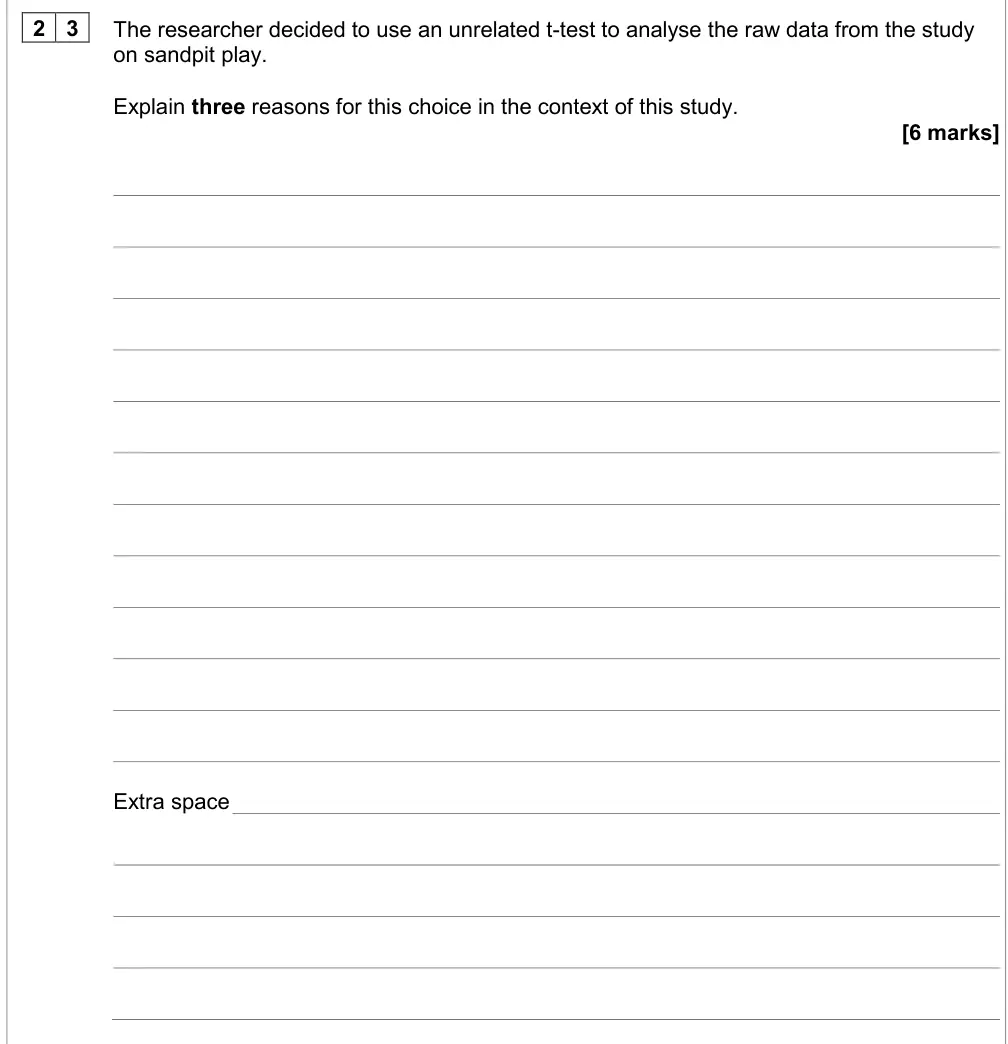
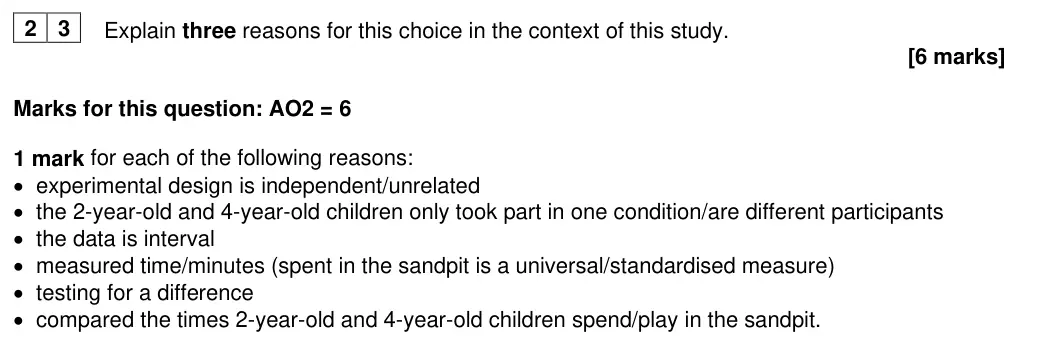
three contextualised reasons, 1 mark each point: independent groups (different children in each age group), interval data (time in minutes), test of difference
modal mark 6
interval wrongly justified by observation duration rather than the DV
June 2024 · Paper 3 · Q72 marksAO2=1, AO3=1Research methods
Mark scheme, including level descriptors and indicative content
Examiner's comment
In Question 07, some students simply restated the figures in the table, and failed to score any marks as a result. Others were able to claim the justification mark, but their conclusion lacked the required clarity for the second mark.
Notes from the mark scheme and report
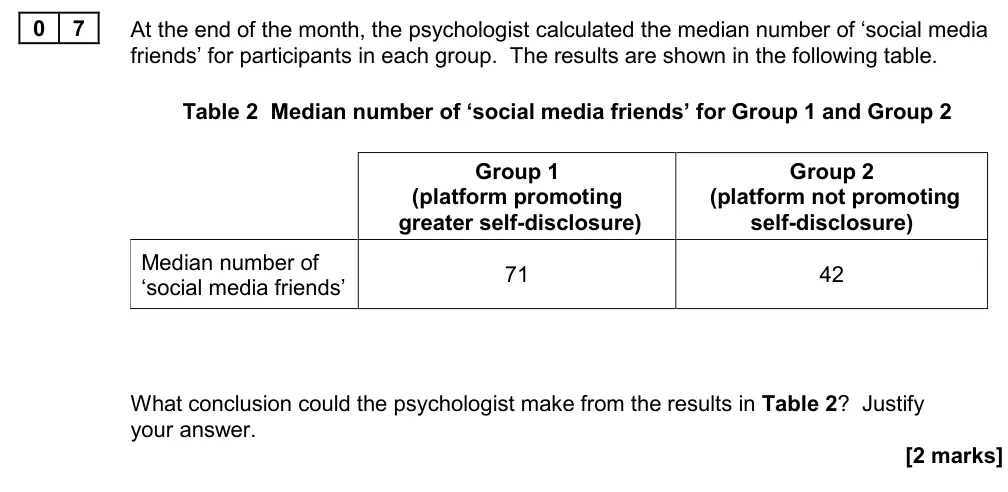
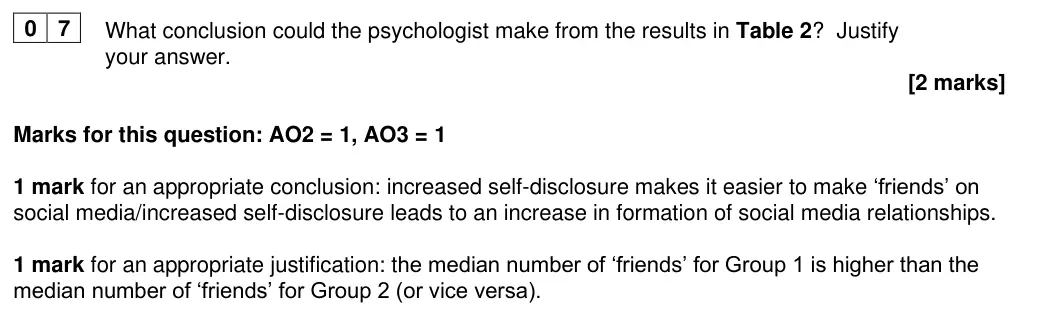
1 mark conclusion (greater self-disclosure leads to more social media friends) + 1 mark justification (Group 1 median 71 > Group 2 median 42)
restating figures scores 0
conclusion often unclear
June 2024 · Paper 3 · Q132 marksAO2=1, AO3=1Research methods
Mark scheme, including level descriptors and indicative content
Examiner's comment
In Question 13, some students simply restated the figures in the table, and failed to score any marks as a result. Others were able to claim the justification mark, but their conclusion lacked the required clarity for the second mark.
Notes from the mark scheme and report
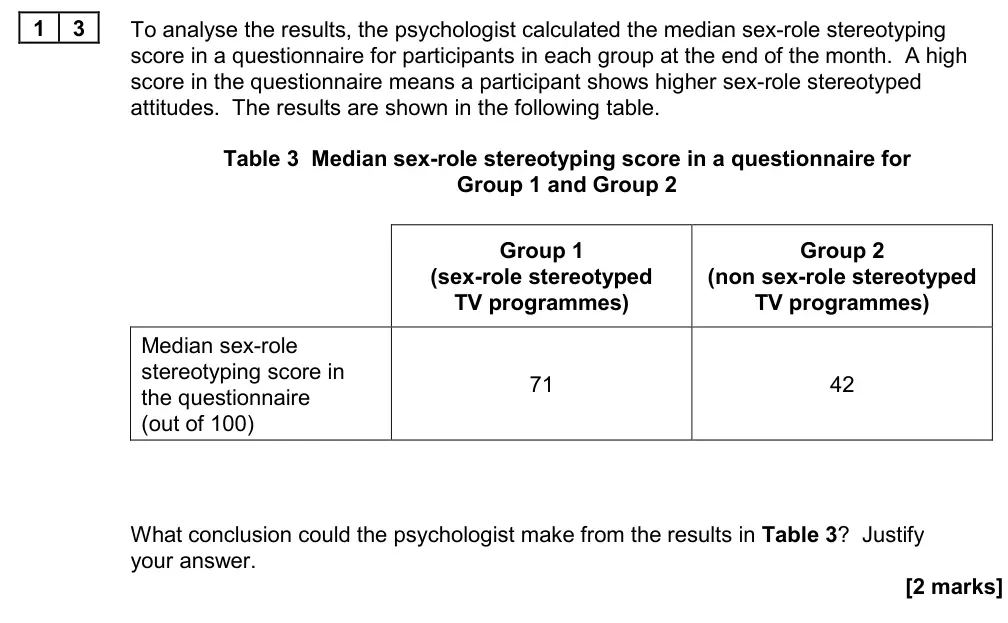
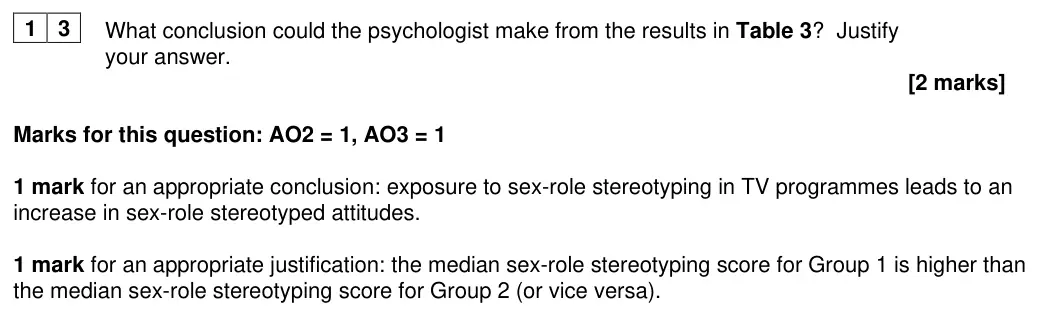
1 mark conclusion (exposure to stereotyped TV increases stereotyped attitudes) + 1 mark justification (median 71 > 42)
restating figures scores 0
June 2024 · Paper 3 · Q192 marksAO2=1, AO3=1Research methods
Mark scheme, including level descriptors and indicative content
Examiner's comment
In Question 19, some students simply restated the figures in the table, and failed to score any marks as a result. Others were able to claim the justification mark, but their conclusion lacked the required clarity for the second mark.
Notes from the mark scheme and report
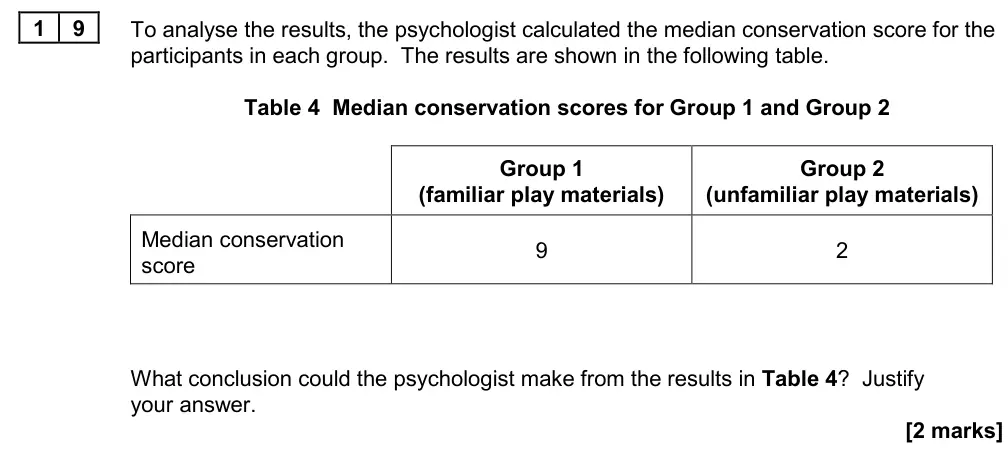
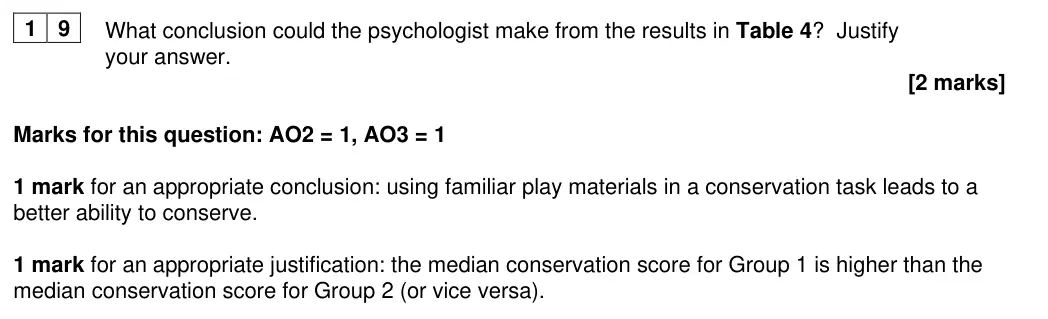
1 mark conclusion (familiar materials improve conservation) + 1 mark justification (median 9 > 2)
restating figures scores 0
June 2024 · Paper 3 · Q241 markAO3=1Multiple choice
Answer
C
Mark scheme, including level descriptors and indicative content
Examiner's comment
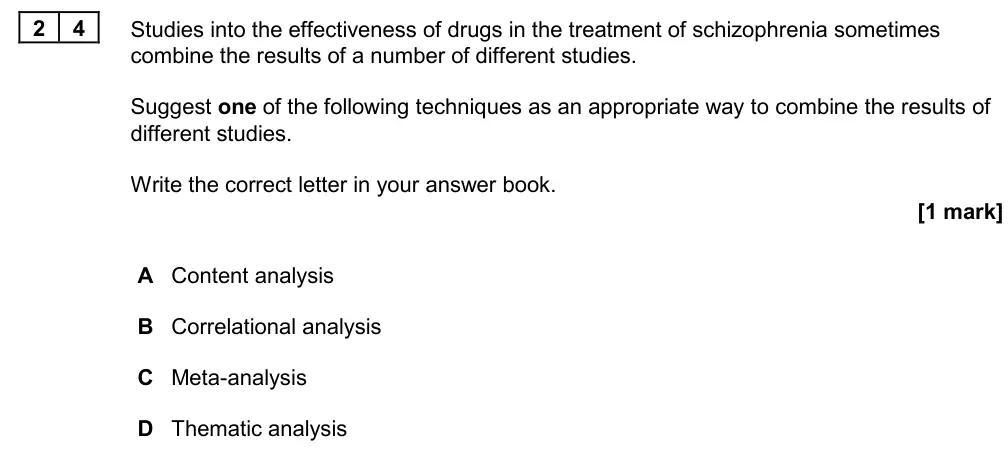
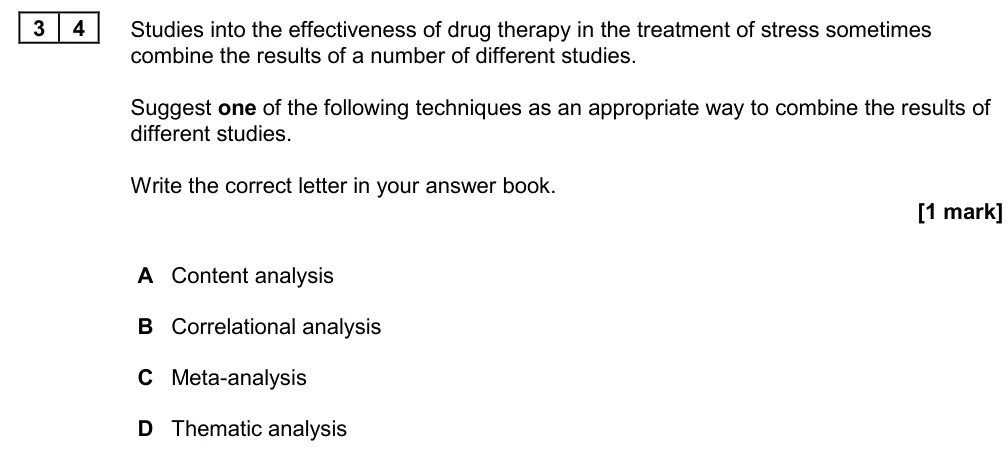
There were very few students indeed who did not know that Question 24 was describing meta-analysis.
Notes from the mark scheme and report
answer C meta-analysis
distractors content analysis, correlational analysis and thematic analysis (thematic analysis removed in v1.4)
almost all correct
June 2024 · Paper 3 · Q291 markAO3=1Multiple choice
Answer
C
Mark scheme, including level descriptors and indicative content
Examiner's comment
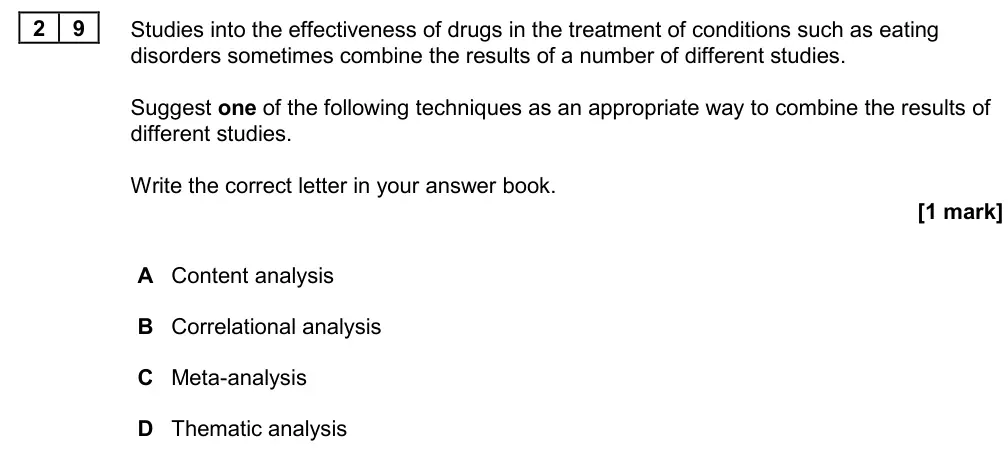
There were very few students indeed who did not know that Question 29 was describing meta-analysis.
Notes from the mark scheme and report
answer C meta-analysis
distractors content analysis, correlational analysis and thematic analysis (thematic analysis removed in v1.4)
June 2024 · Paper 3 · Q341 markAO3=1Multiple choice
Answer
C
Mark scheme, including level descriptors and indicative content
Examiner's comment
There were very few students indeed who did not know that Question 34 was describing meta-analysis.
Notes from the mark scheme and report
answer C meta-analysis
distractors content analysis, correlational analysis and thematic analysis (thematic analysis removed in v1.4)
June 2023 · AS Paper 1 · Q3.12 marksAO2=2Research methods
Mark scheme, including level descriptors and indicative content
Examiner's comment
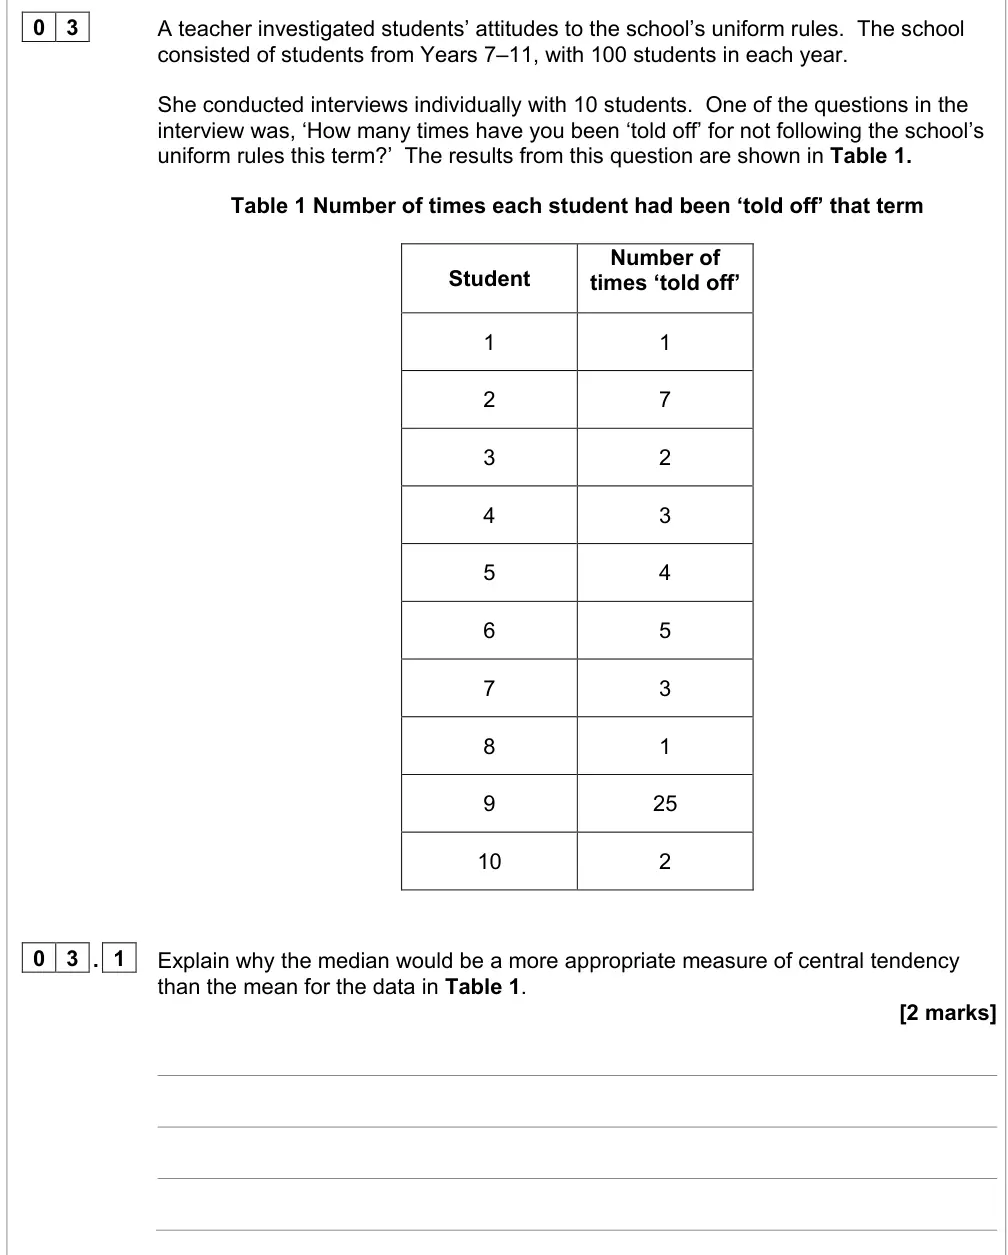
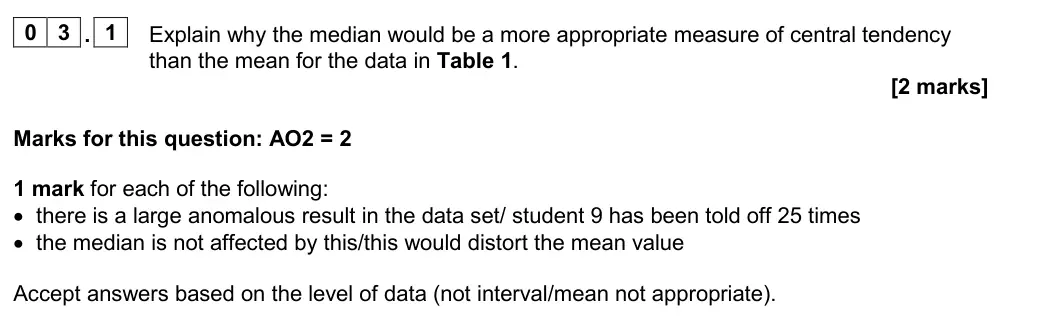
Most students clearly had knowledge of how a mean could be skewed by an outlier. However, some students lost marks by not applying their answer to the data set in the question. A minority of students just defined the term median without mentioning skew or applying to the scenario. Students found this the easiest of the Research Methods questions.
Notes from the mark scheme and report
1 mark anomalous score (student 9 = 25) + 1 mark median unaffected/mean distorted
level of data also accepted
must apply to Table 1
easiest RM question
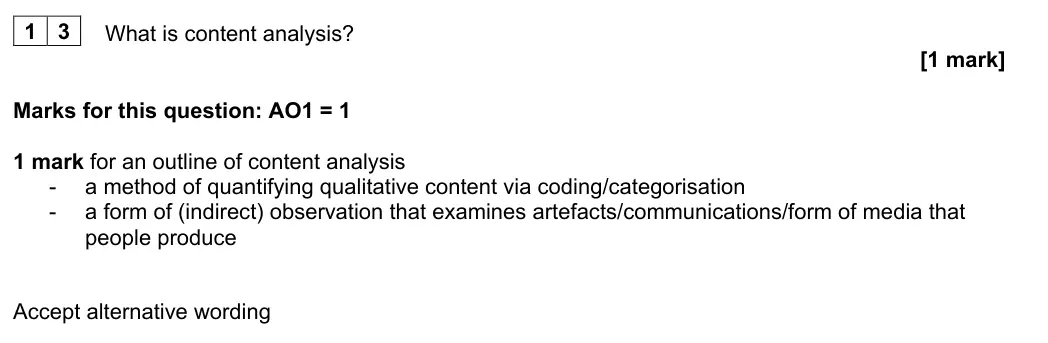
June 2023 · Paper 1 · Q131 markAO1=1Research methods
Mark scheme, including level descriptors and indicative content
Examiner's comment
Overall, this question was answered poorly by most students, despite content analysis being a named research method on the specification. A significant minority of students described thematic analysis instead of content analysis. Students must be able to outline what a content analysis entails and understand the distinct differences between this and thematic analysis.
Notes from the mark scheme and report
answered poorly
many described thematic analysis (removed from the spec in v1.4) instead of content analysis
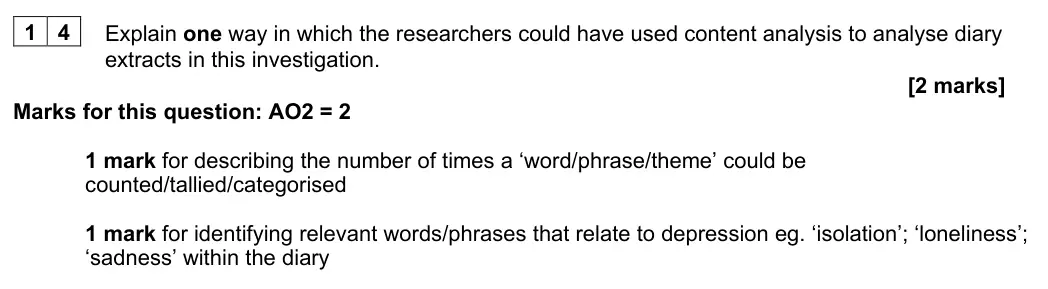
June 2023 · Paper 1 · Q142 marksAO2=2Research methods
Mark scheme, including level descriptors and indicative content
Examiner's comment
Students who understood what is meant by a content analysis were able to score well, applying their knowledge to the scenario of analysing the diary extracts. A small minority of students who did not understand content analysis struggled to score marks.
Notes from the mark scheme and report
two marks: counting/tallying categories + naming depression-related words from the diaries
June 2023 · Paper 1 · Q154 marksAO3=4Research methods
Mark scheme, including level descriptors and indicative content
Examiner's comment
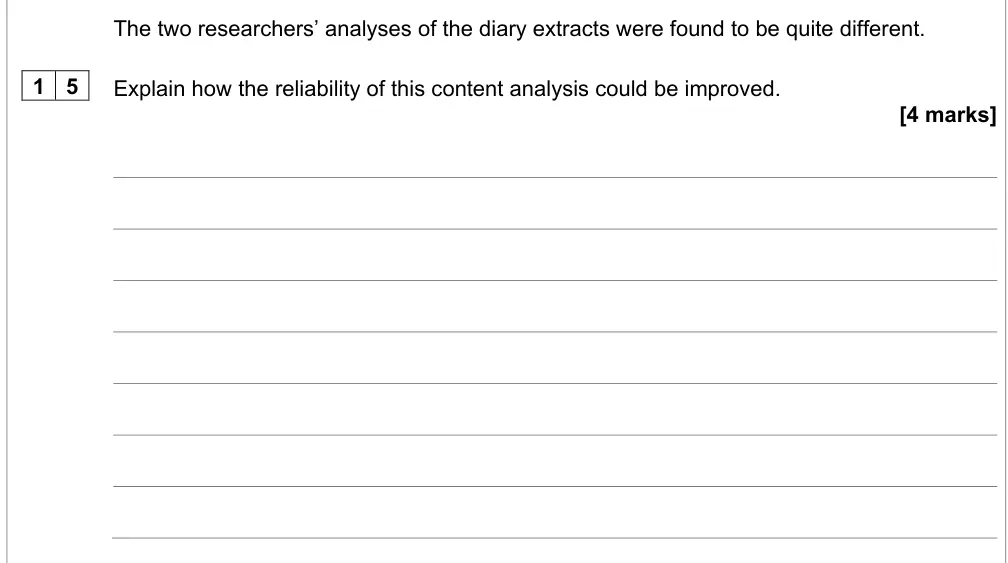
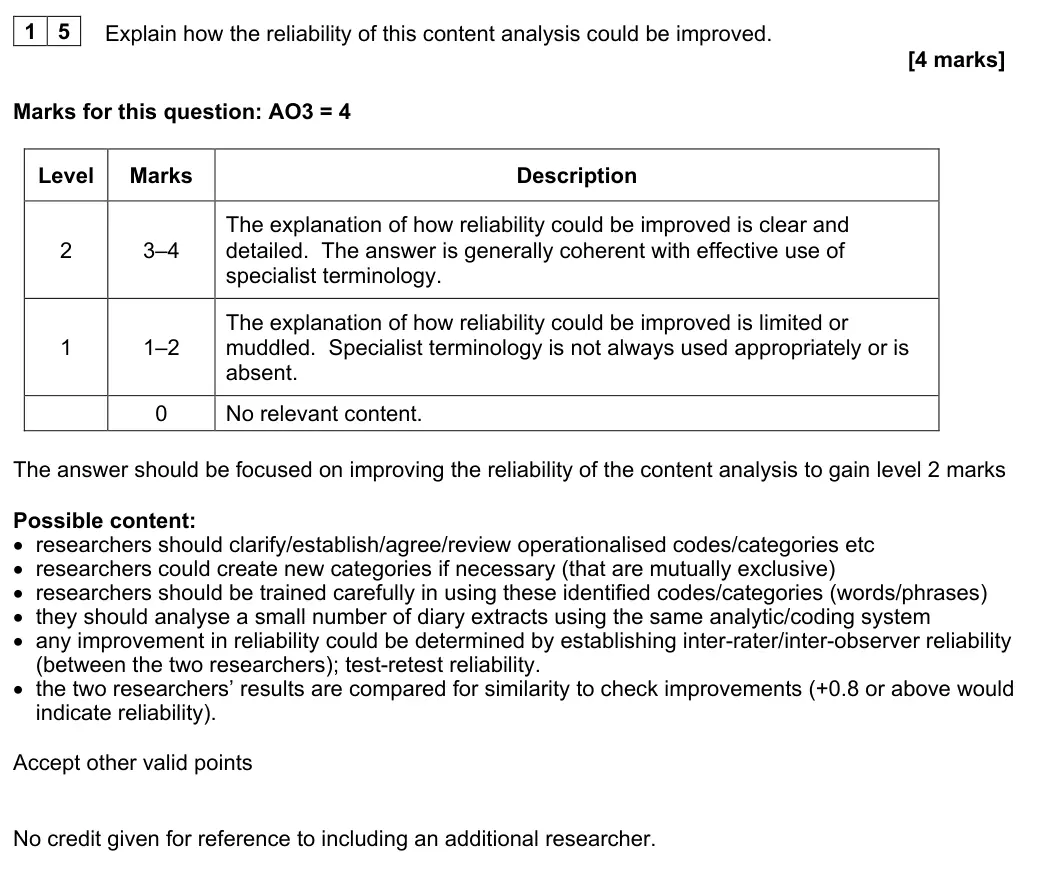
Students found this question difficult and often misinterpreted its meaning. The students were asked to suggest how the reliability of the content analysis could be improved. Instead, many responses focused on how reliability can be assessed. In addition, many did not read the information carefully. They did not acknowledge that two researchers were already involved in the analyses of the diary extracts, meaning that marks could not be gained for suggesting using an additional researcher.
Notes from the mark scheme and report
asks how to IMPROVE reliability, many explained how to assess it
two researchers already involved, so 'add another researcher' scored nothing
June 2023 · AS Paper 2 · Q104 marksAO2=4Research methodsHard
Mark scheme, including level descriptors and indicative content
Examiner's comment
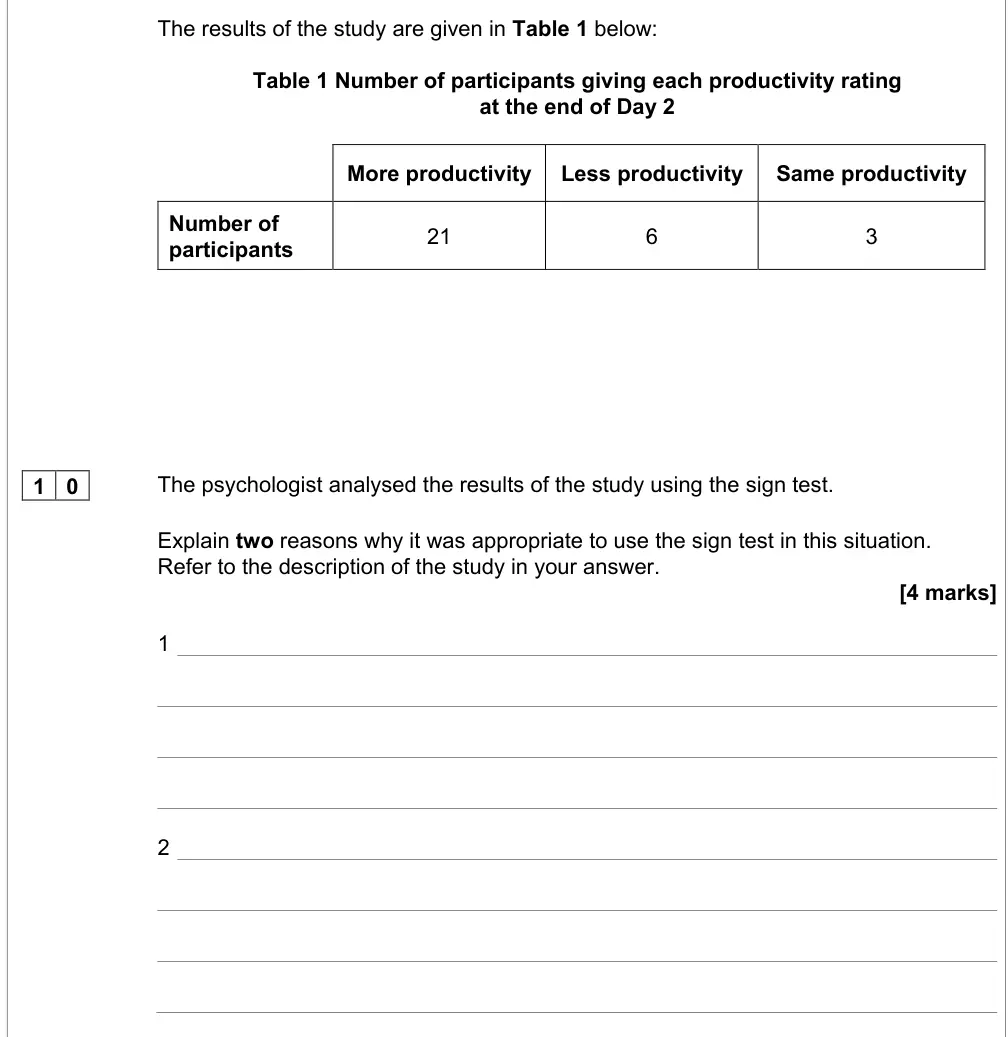
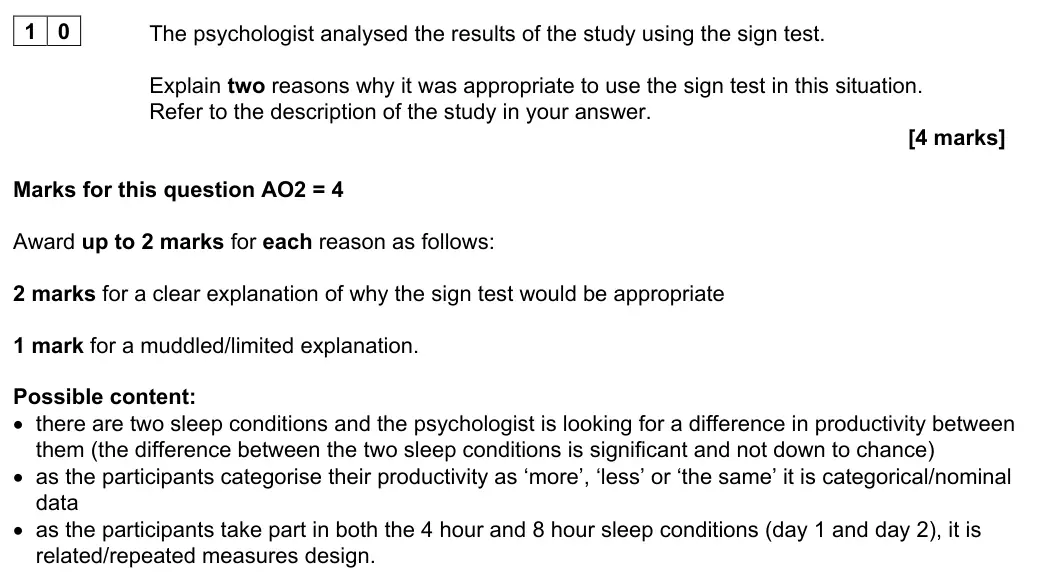
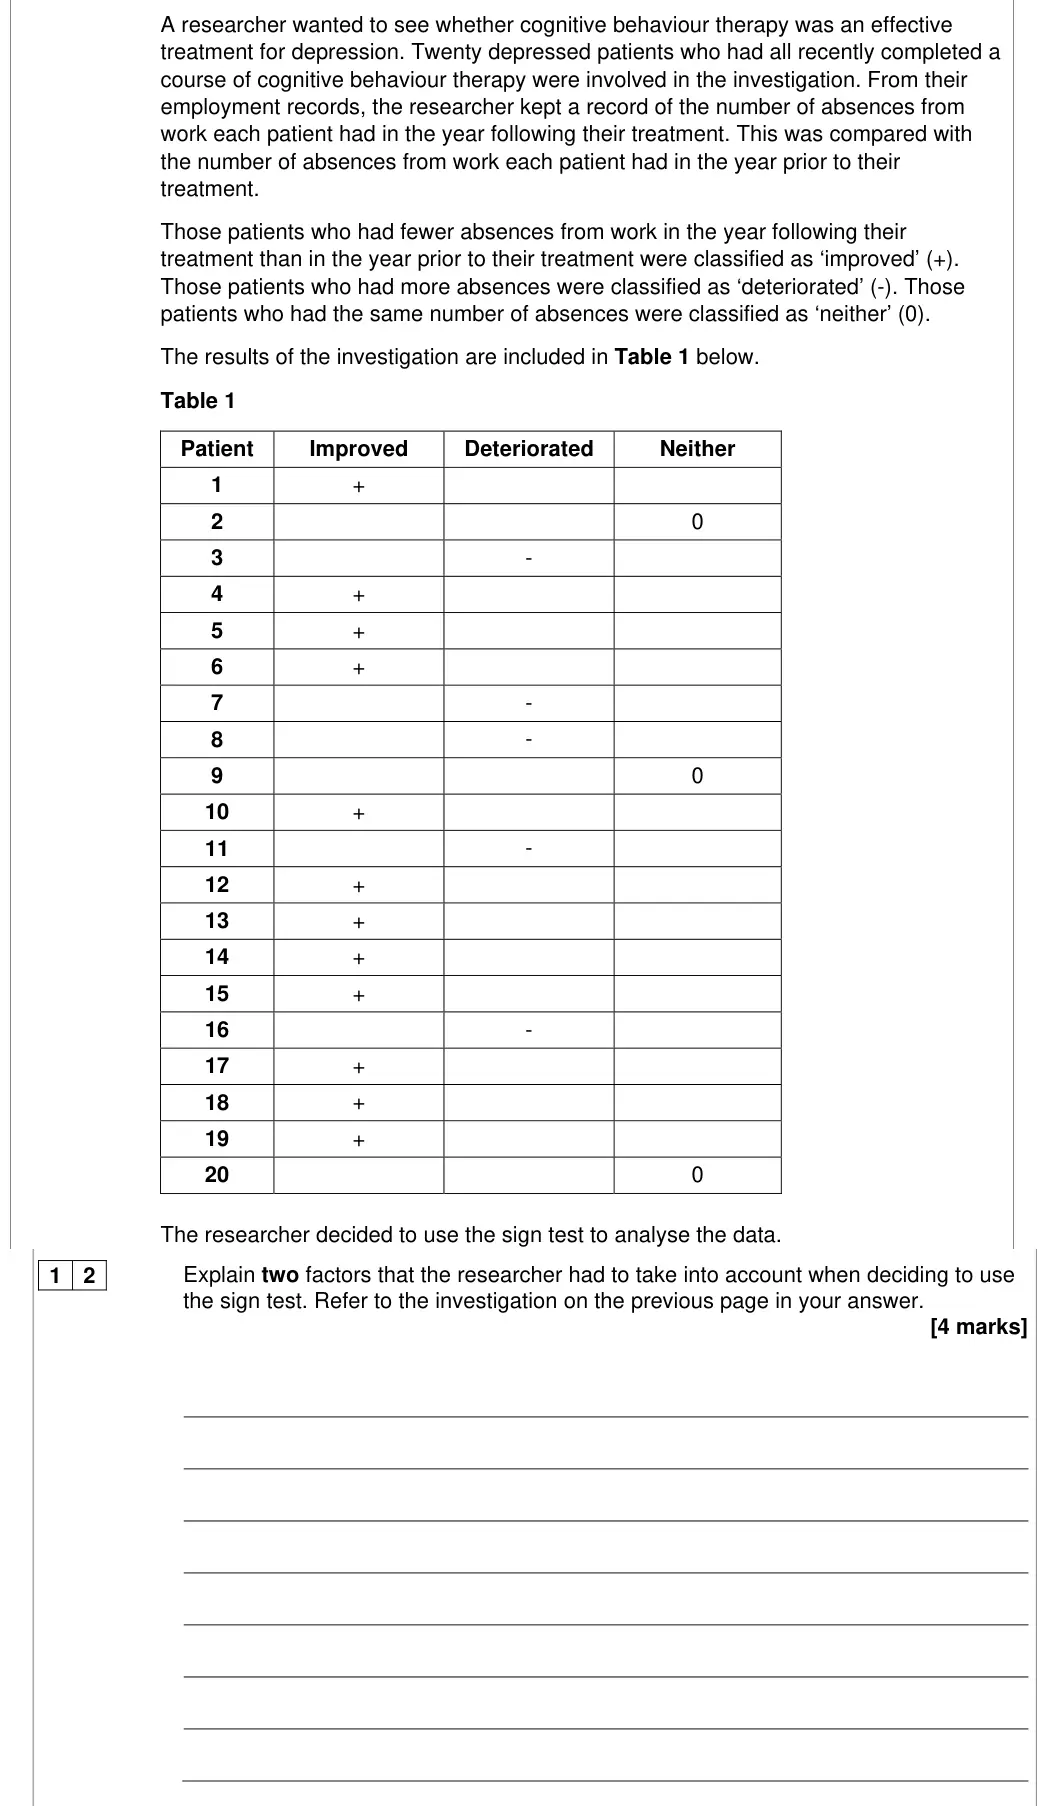
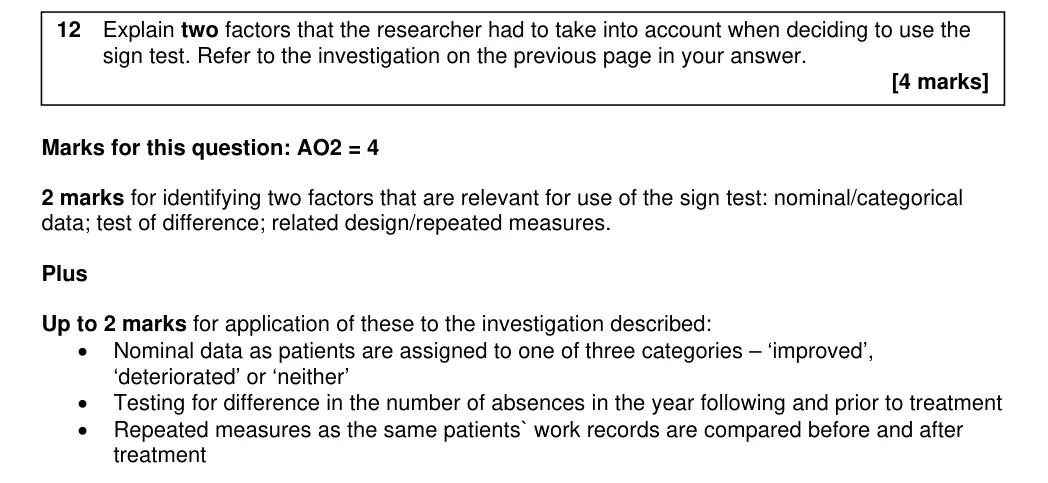
Most students appeared to have little, if any, knowledge of the sign test and thus could not access any marks on this question. The mean as a percentage of the maximum mark for this question was less than 20%. Of those who did appear to have some knowledge, some could only give one reason whilst others failed to apply their reasoning to the study. Very few students were able to give two reasons of why the sign test was appropriate to use in the study with reference to the study itself. This question appeared to demonstrate a general lack of understanding of the sign test and specifically when it should be used.
Notes from the mark scheme and report
test of difference
nominal/categorical data (more/less/same)
repeated measures/related design
must refer to the study
very poorly answered (mean under 20%)
June 2023 · Paper 2 · Q144 marksAO2=4Research methods
Mark scheme, including level descriptors and indicative content
Examiner's comment
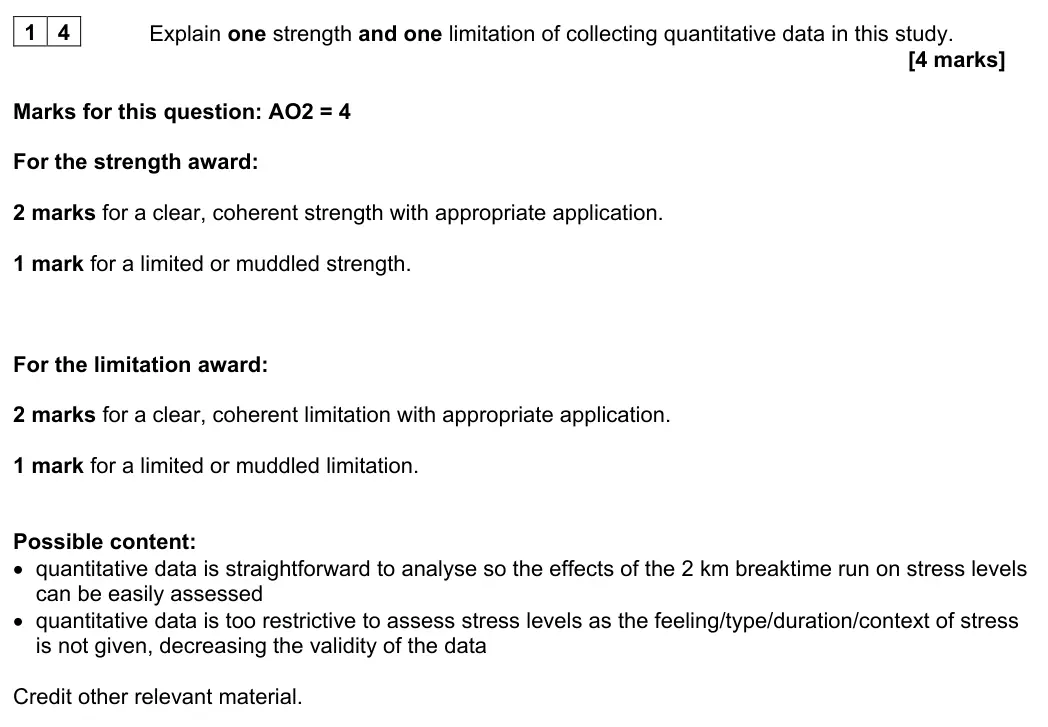
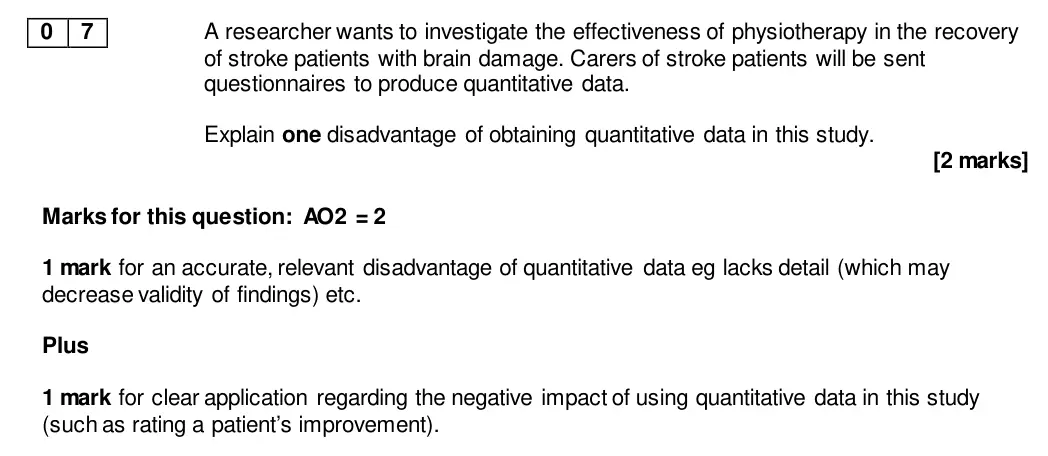
Generally, this question was answered well. Most students understood the difference between the two types of data and there was only occasional muddle between qualitative and quantitative data. The most common strengths and limitations identified were ‘easy to analyse using statistics/graphs’ and ‘lack of detail’. Many applied their answers to the question stem well, although application was not always evident or appropriate. Limitations were generally applied more effectively than the strengths.
Notes from the mark scheme and report
strength (easy to analyse effect of the run) and limitation (lacks detail about type/context of stress), applied, 2 marks each
June 2023 · Paper 2 · Q154 marksAO2=2, AO3=2Research methods
Mark scheme, including level descriptors and indicative content
Examiner's comment
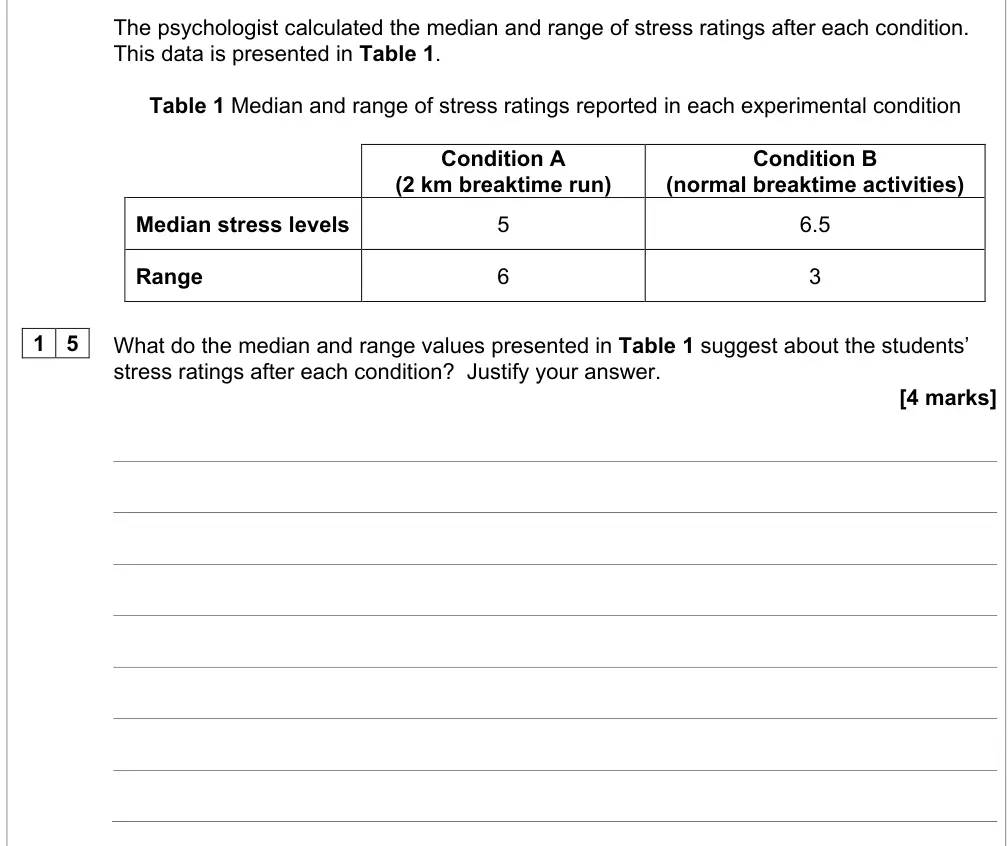
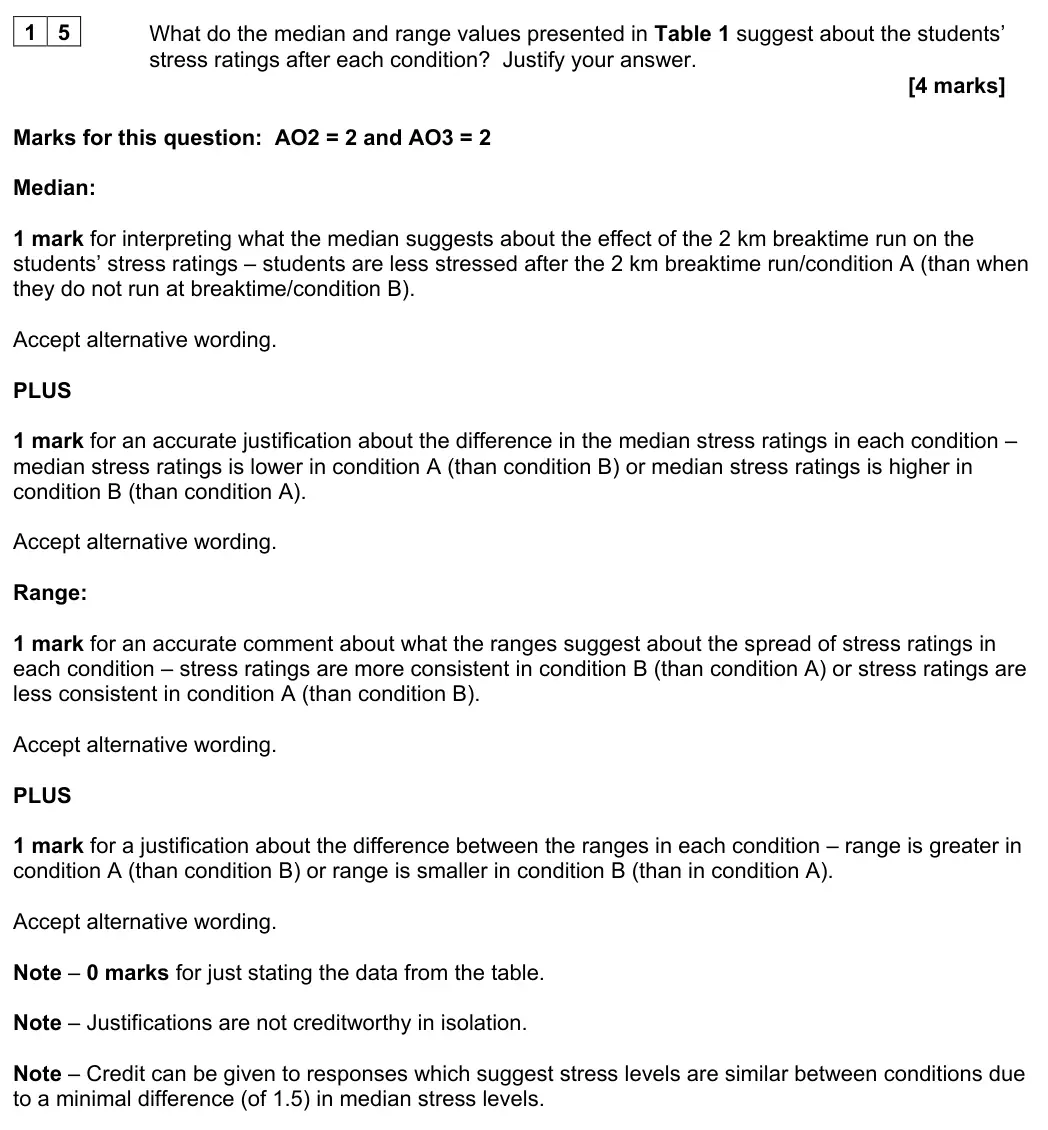
This question was a good differentiator and proved challenging for many. Some students seem to have developed a sound understanding of what the median and range portray, and had been guided well as to how to answer this type of data interpretation question. Overall, explanations for the median were better than the range. However, students often struggled to interpret what the median suggested and then to justify their answer. The question revealed some poor understanding of what the range shows, with many students not appreciating that the range was communicating something different to the median. It was common to see responses which just quoted data from the table as opposed to using the data to justify what the mean/median suggest about the students’ stress rating after each condition. Other common mistakes were to identify that the range/median was higher/lower in one condition than the other and then give a definition of the median/range, or to consider the range as a measure of central tendency and therefore suggest that the median indicated a small difference between the conditions whereas the range suggested a large difference. The responses given to this question highlight the importance of developing an understanding of what the measures of central tendency and dispersion show us and how they help us interpret data rather than just rote learning of definitions, how to perform calculations and simple evaluative points. Students always need to do something beyond simply restating the figures from a table and instead should expect to show an understanding of what the values mean.
Notes from the mark scheme and report
median: less stressed after running (5 < 6.5) + justification
range: ratings less consistent after running (6 > 3) + justification
quoting data alone = 0
justifications not creditworthy alone
treating the range as a measure of central tendency
June 2023 · Paper 2 · Q164 marksAO2=4Research methods
Mark scheme, including level descriptors and indicative content
Examiner's comment
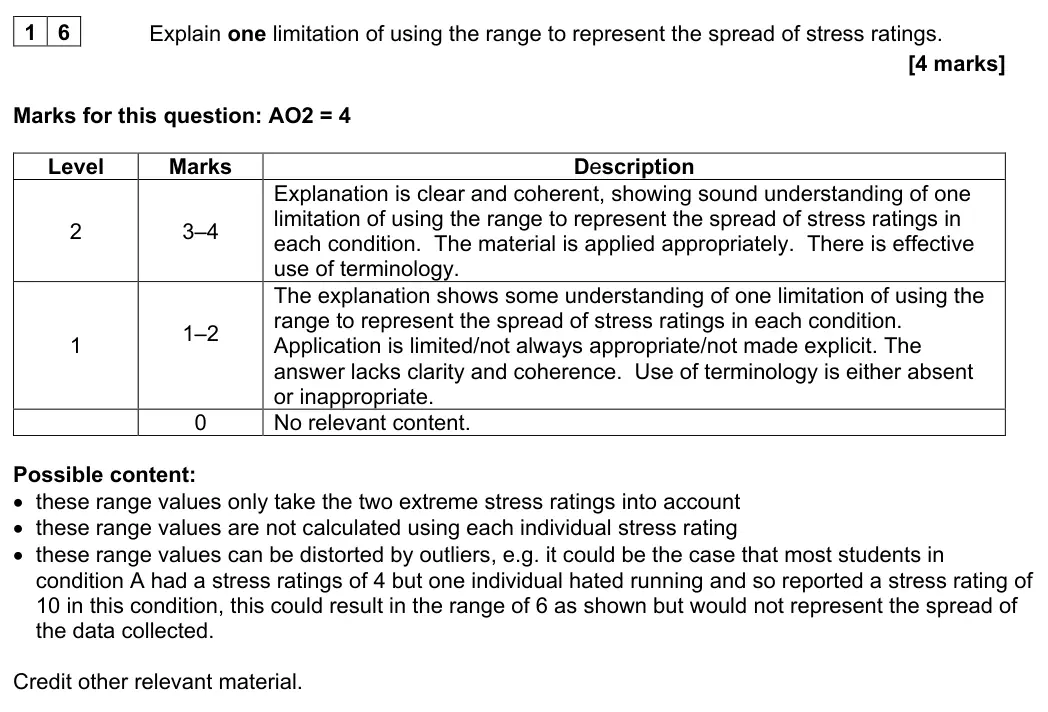
This question was another good discriminator. Many were able to demonstrate some understanding of one limitation of the range. Fewer students had sufficient understanding of what the range tells us, to be able to elaborate on this in the context of the stem with enough clarity and effective use of terminology to achieve level 2. Although there were some very good responses, it was rare to see a full marks response. The more effective responses explained that the range could be distorted by outliers and therefore may not be representative of most stress ratings. They used effective examples in context and often covered all the content on the mark scheme. However, it was common to see responses where the range was muddled with the mean/measures of central tendency and/or which provided two or three limitations rather than a full elaboration of one limitation. Another common error was a failure to apply responses effectively to stress ratings.
Notes from the mark scheme and report
range uses only the two extreme ratings/distorted by an outlier (e.g. one student who hated running rating 10), applied to the stress ratings
giving several limitations rather than elaborating one
muddled with the mean
June 2023 · Paper 2 · Q225 marksAO2=4, AO3=1Research methods
Mark scheme, including level descriptors and indicative content
Examiner's comment
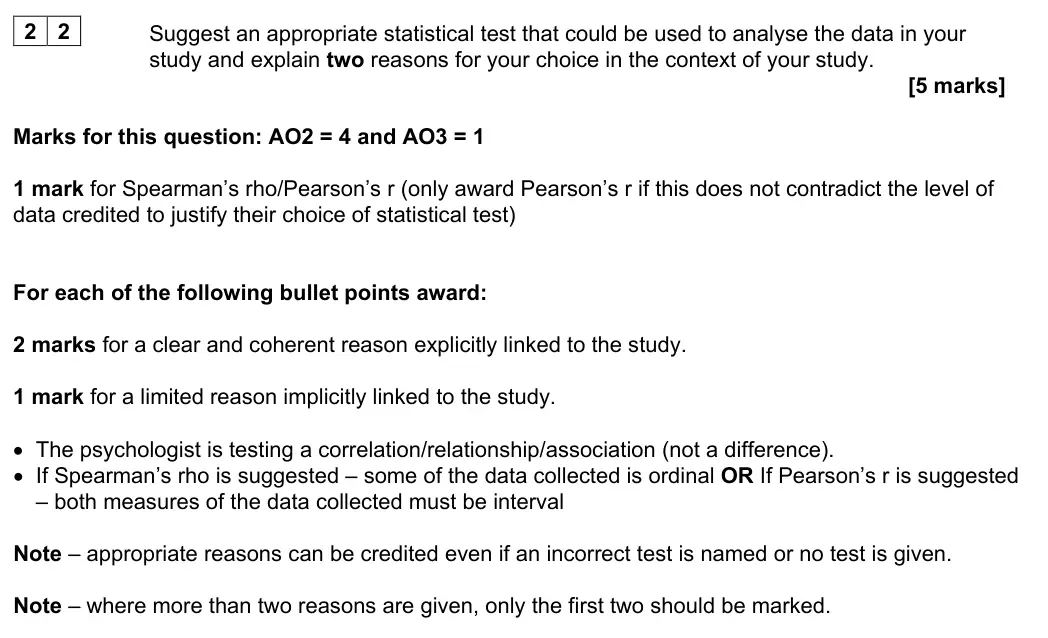
This question produced a mixed response with a relatively even spread of the marks awarded. Overall students appear to have developed a good knowledge of statistics. Many could name an appropriate test of correlation and give reasons for their choices, but then found it more challenging to explain this in relation to the question stem. Thus, the requirement to link choices to the context, continued to work well as a discriminator, with only the better responses doing this. Students were generally able to justify correlation, often with application, but found the level of data more challenging. Some students who identified interval data either did not apply this or only described one data set. There were some excellent responses, with full marks awarded for those students who had good recall of knowledge for choice of statistical test with a good understanding of exam technique for this style of question.
Notes from the mark scheme and report
Spearman's rho (or Pearson's r if consistent with interval data) + two contextualised reasons (correlation, level of data), 2 marks each
only first two reasons marked
level of data harder to justify
June 2023 · Paper 3 · Q264 marksAO2=4Research methods
Mark scheme, including level descriptors and indicative content
Examiner's comment
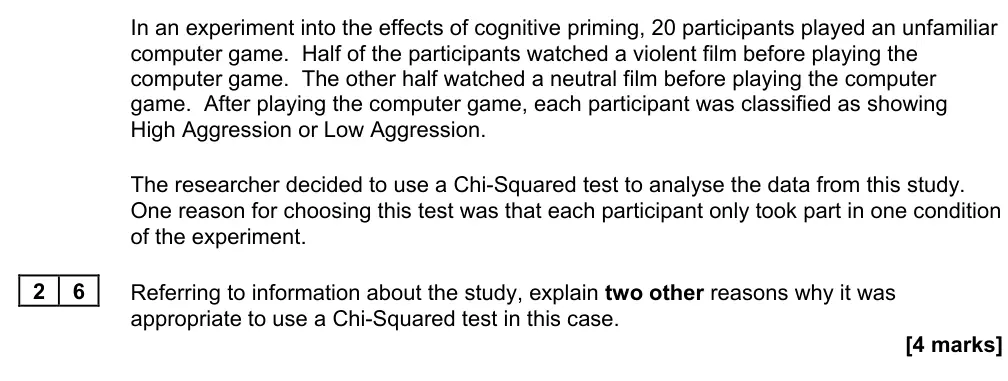
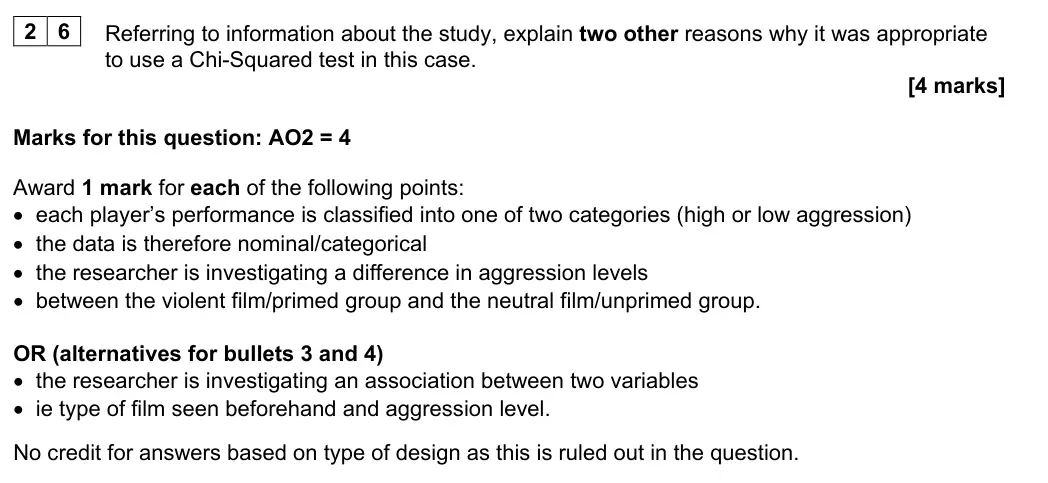
Many students recognised the level of data as nominal and offered a sound justification for this, with reference to high and low aggression as the two categories. Marks for the other reason were more elusive. A surprising number of students talked about the type of design even though this was ruled out in the question. Many incorrectly identified the study as investigating a correlation, rather than an association, and whilst others did identify the study as a test of difference, their explanation for why was often vague or inaccurate.
Notes from the mark scheme and report
1 mark each: categories high/low aggression
data nominal
test of difference between violent/neutral film groups (or association between film type and aggression)
no credit for design (ruled out in stem)
many wrongly said correlation
June 2023 · Paper 3 · Q314 marksAO2=4Research methods
Mark scheme, including level descriptors and indicative content
Examiner's comment
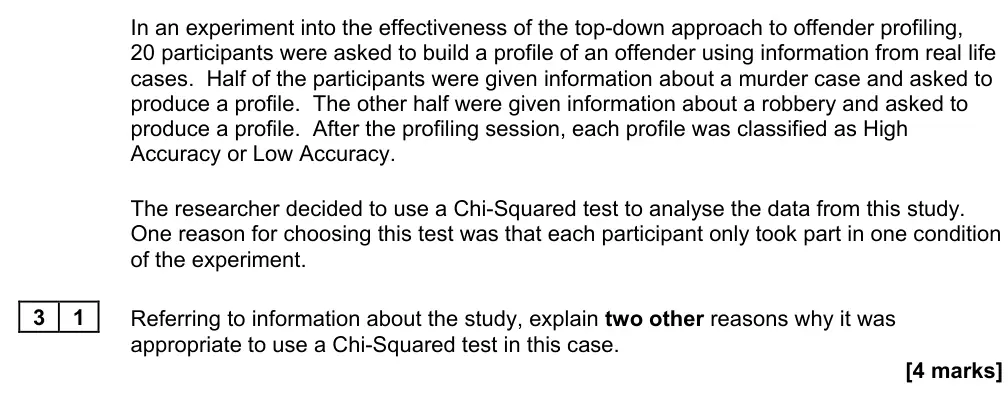
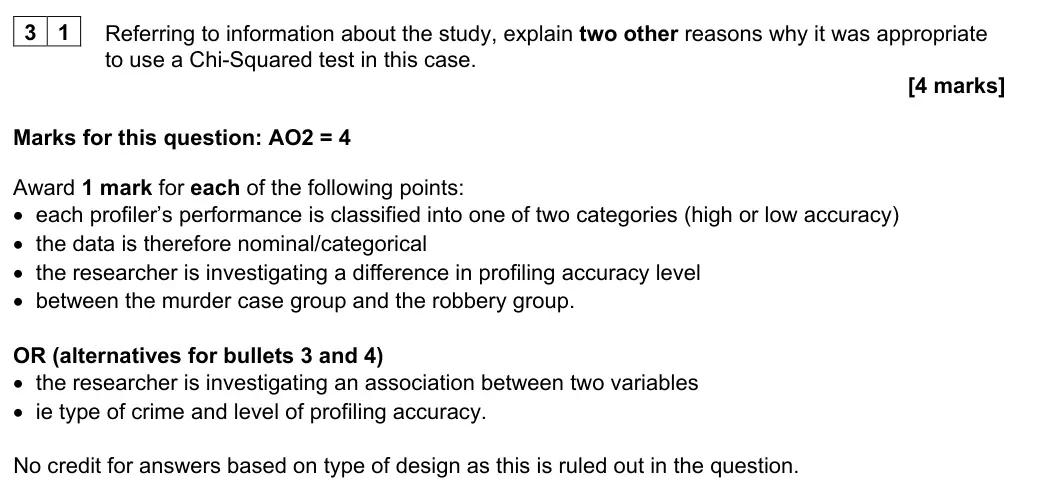
Many students recognised the level of data as nominal and offered a sound justification for this with reference to high and low accuracy as the two categories. Marks for the other reason were more elusive. A surprising number of students talked about the type of design even though this was ruled out in the question. Many incorrectly identified the study as investigating a correlation, rather than an association. Whilst others did identify the study as a test of difference, their explanation for why was often vague or inaccurate.
Notes from the mark scheme and report
'top-down' approach = 'typology' approach in v1.4 (current)
1 mark each: high/low accuracy categories
nominal data
difference between murder/robbery groups (or association)
no credit for design
many wrongly said correlation
June 2023 · Paper 3 · Q364 marksAO2=4Research methods
Mark scheme, including level descriptors and indicative content
Examiner's comment
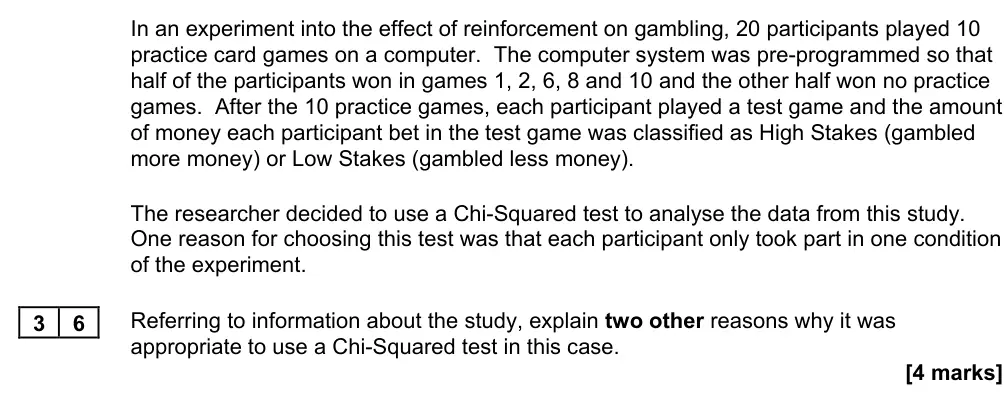
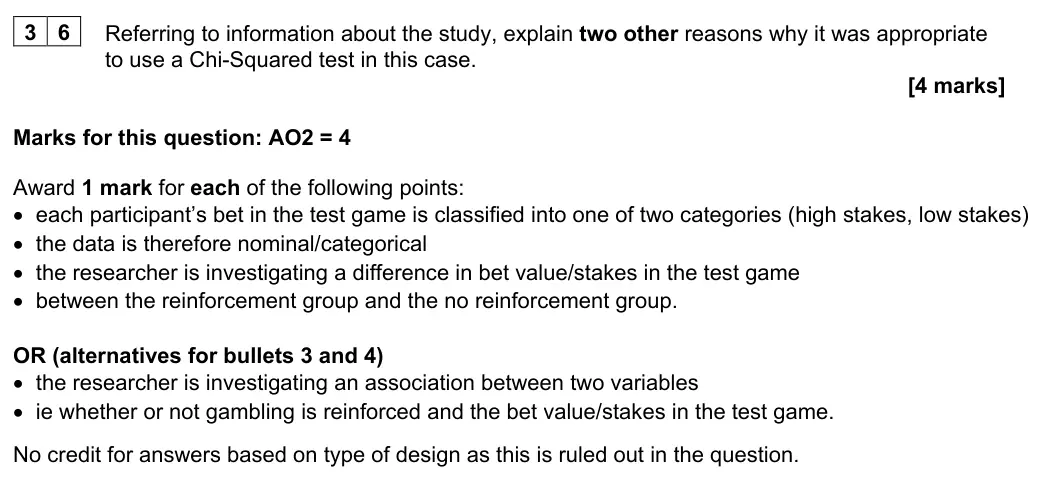
Many students recognised the level of data as nominal and offered a sound justification for this with reference to high and low stakes as the two categories. Marks for the other reason were more elusive. A surprising number of students talked about the type of design even though this was ruled out in the question. Many incorrectly identified the study as investigating a correlation, rather than an association. Whilst others did identify the study as a test of difference, their explanation for why was often vague or inaccurate.
Notes from the mark scheme and report
1 mark each: high/low stakes categories
nominal data
difference between reinforced/non-reinforced groups (or association)
no credit for design
many wrongly said correlation
June 2022 · AS Paper 1 · Q6.14 marksAO2=4Research methods
Mark scheme, including level descriptors and indicative content
Examiner's comment
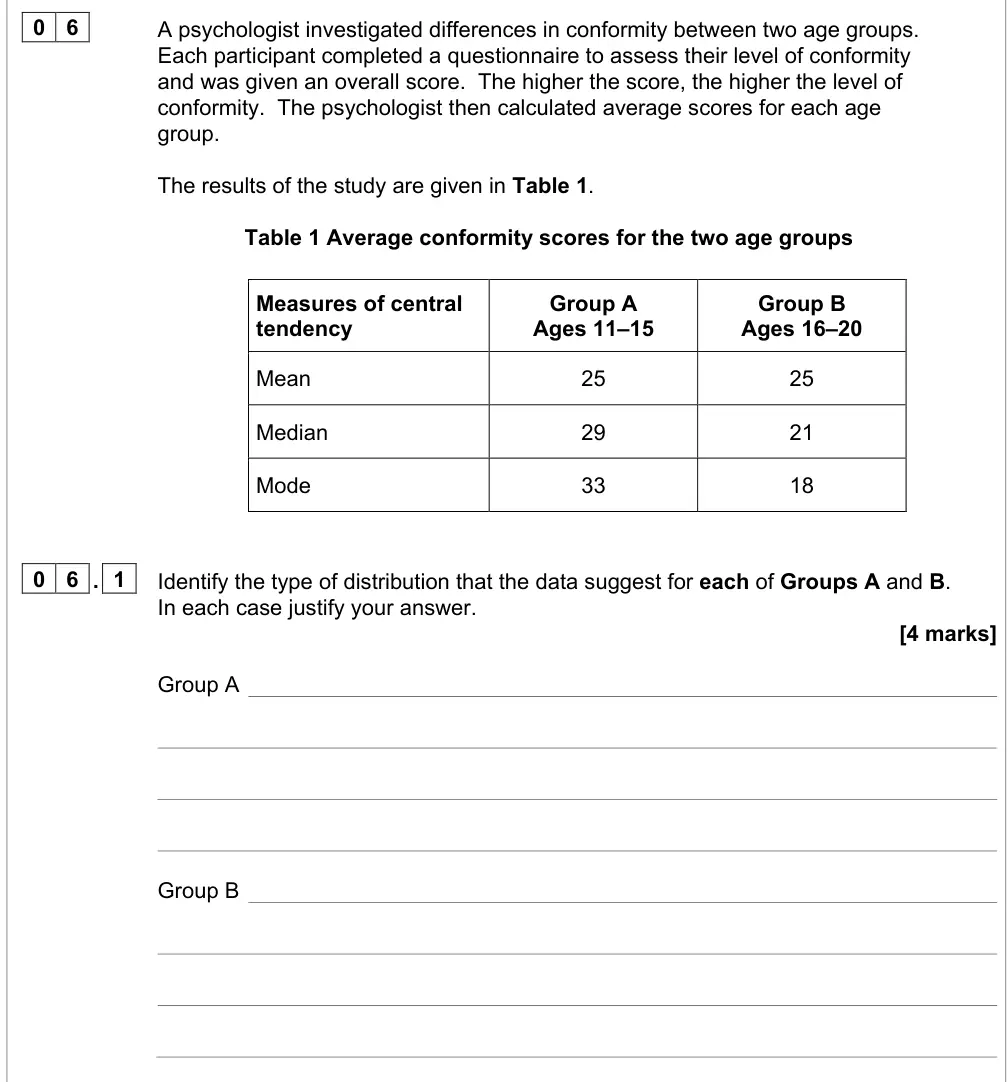
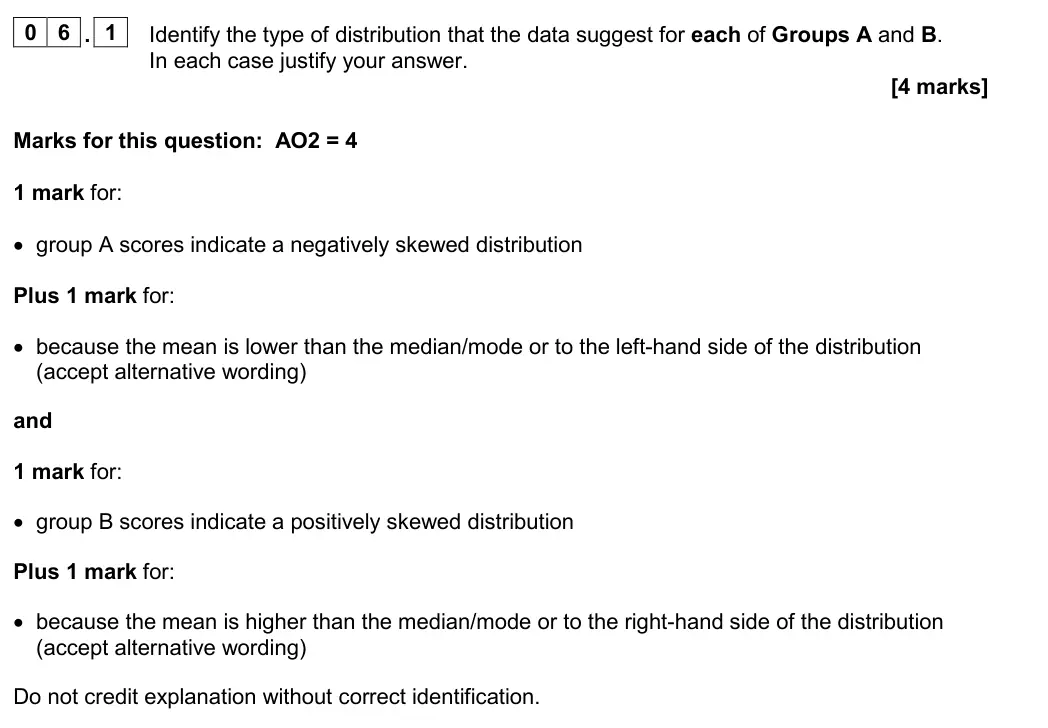
This was one of the most challenging questions on the paper, with many students demonstrating a lack of understanding of the research methods knowledge required to answer it. Many students were unable to identify the type of distribution and then justify their answer. Some students did score full marks and had a clear understanding of negatively and positively skewed distributions. However, many gave muddled answers and approximately 10% of students did not attempt the question.
Notes from the mark scheme and report
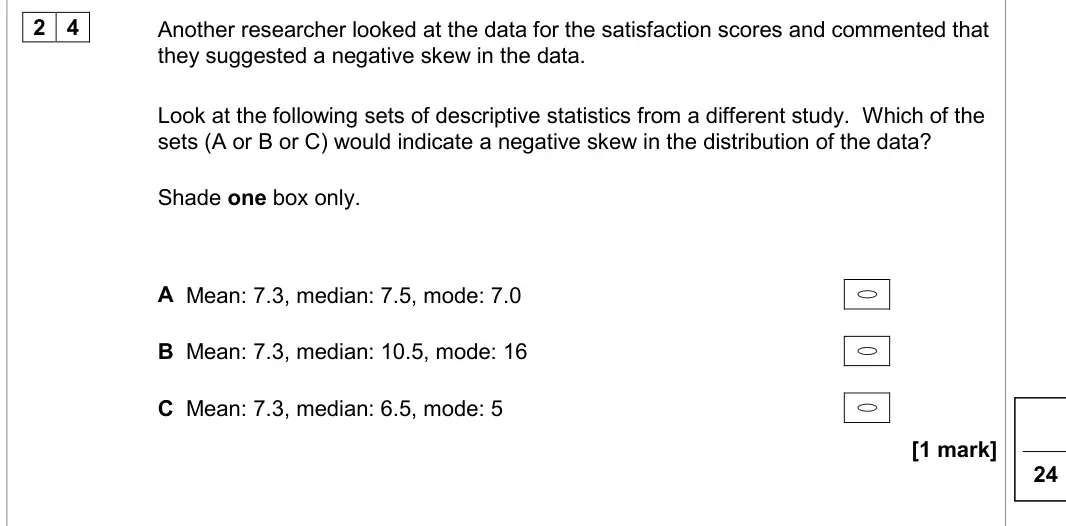
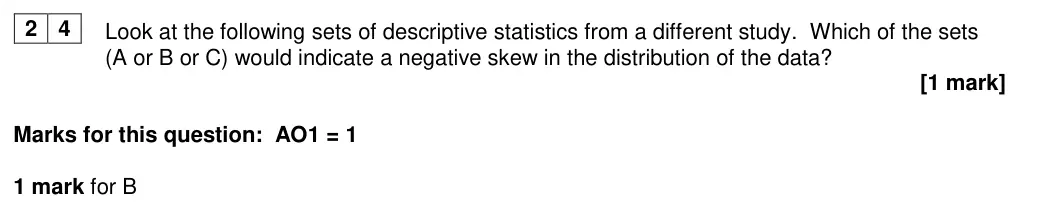
A negatively skewed (mean < median < mode), B positively skewed (mean > median > mode)
explanation not credited without correct identification
one of the hardest questions, ~10% blank
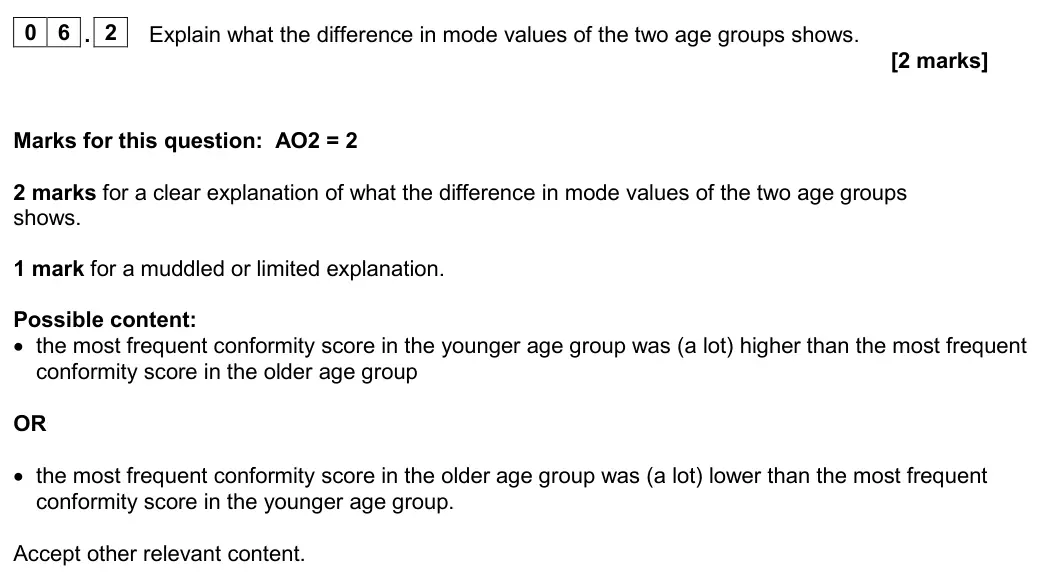
June 2022 · AS Paper 1 · Q6.22 marksAO2=2Research methods
Mark scheme, including level descriptors and indicative content
Examiner's comment
This was another question that students found challenging and again appeared to demonstrate a general lack of understanding of the research methods knowledge needed to answer it. Many students offered erroneous conclusions. Students needed to show that they understood what the mode of a set of data indicated: the most common score, and then compare the two age groups. A few students did score full marks, although most answers scored zero with a small percentage of these not having attempted the question.
Notes from the mark scheme and report
most frequent conformity score much higher in younger group
mode = most common score
most scored zero with erroneous conclusions
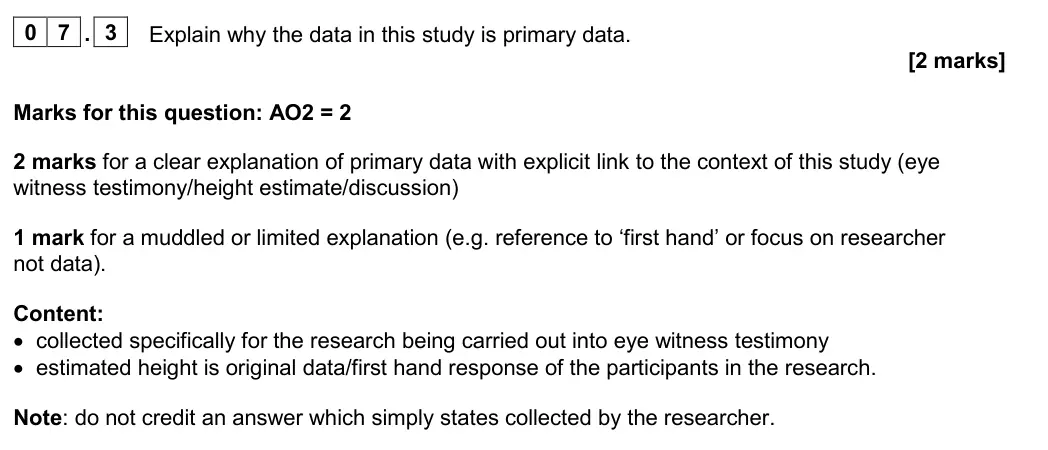
June 2022 · AS Paper 1 · Q7.32 marksAO2=2Research methods
Mark scheme, including level descriptors and indicative content
Examiner's comment
Most students scored half marks or more on this question. Most lost the second mark because they did not link their answer to the scenario/to ‘this’ study. This was a recurrent theme for the research methods questions and students need to practice applying knowledge to scenarios in order to prepare fully for the novel situation they will face in the examination.
Notes from the mark scheme and report
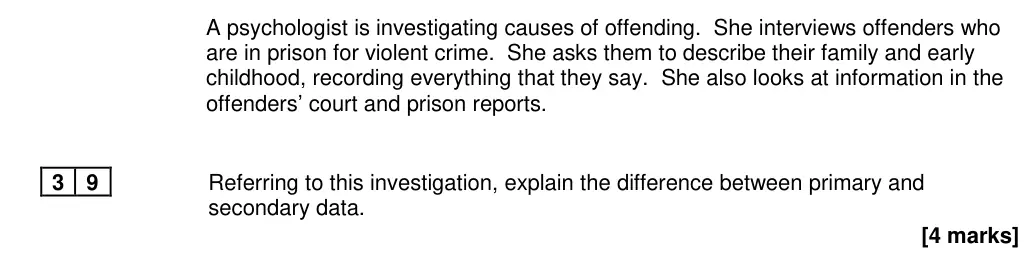
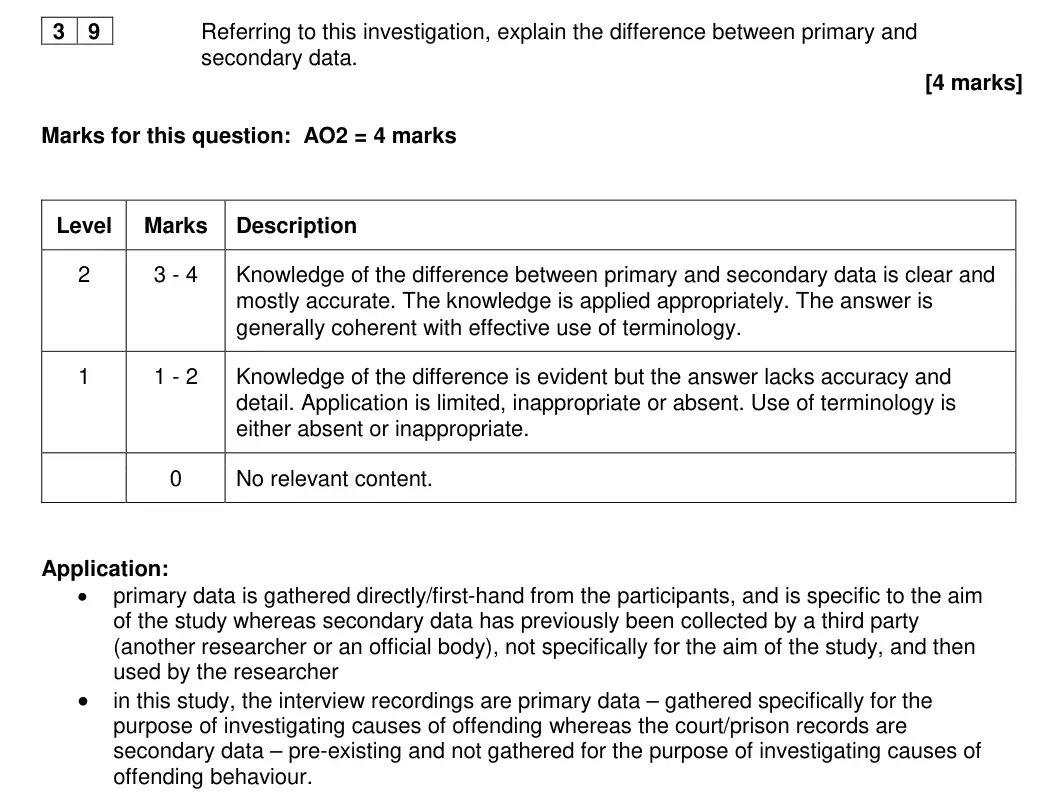
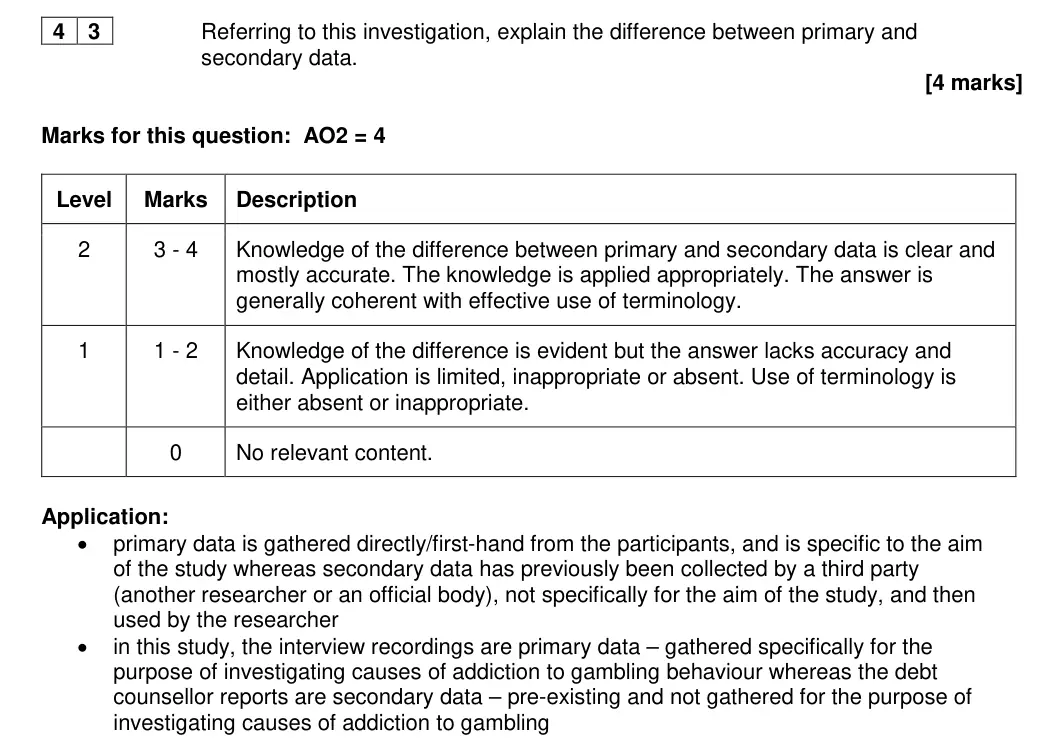
collected first-hand specifically for this EWT study
explicit link to this study needed for second mark
'collected by the researcher' alone not credited
June 2022 · AS Paper 1 · Q7.42 marksAO2=2Research methods
Mark scheme, including level descriptors and indicative content
Examiner's comment
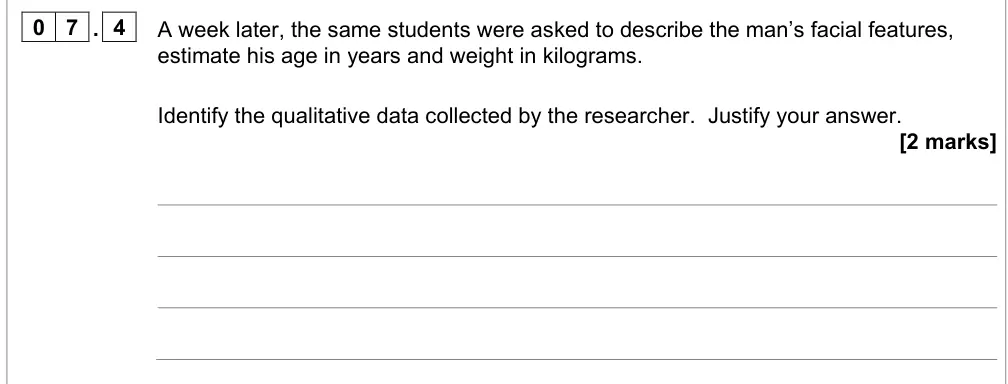
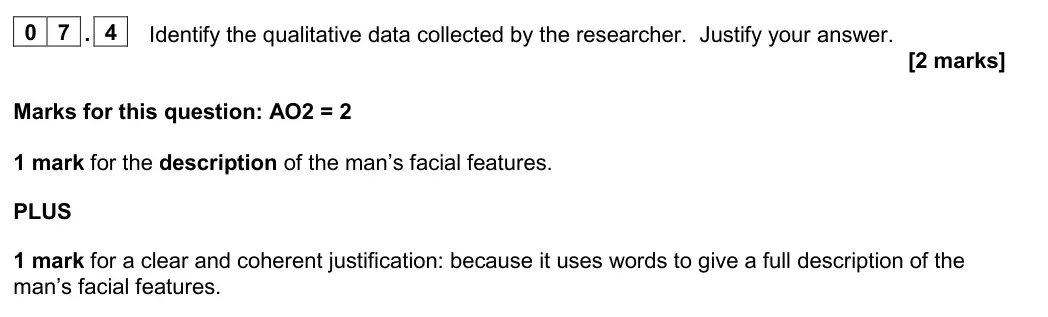
A reasonable number of students failed to identify the qualitative data because they referred only to ‘the man’s facial features’. It was the description of the man’s facial features that provided the qualitative data and this was a crucial difference. As with previous examination questions, students tried to justify their answer by saying what qualitative data is not (numbers) rather than explaining what it is (words). Saying what something is not does not answer the question. Students must read and process the demands of the question carefully.
Notes from the mark scheme and report
the DESCRIPTION of facial features (not 'facial features') + justification that it is in words
saying what qualitative data is not (numbers) did not justify
June 2022 · Paper 1 · Q152 marksAO2=2Research methods
Mark scheme, including level descriptors and indicative content
Examiner's comment
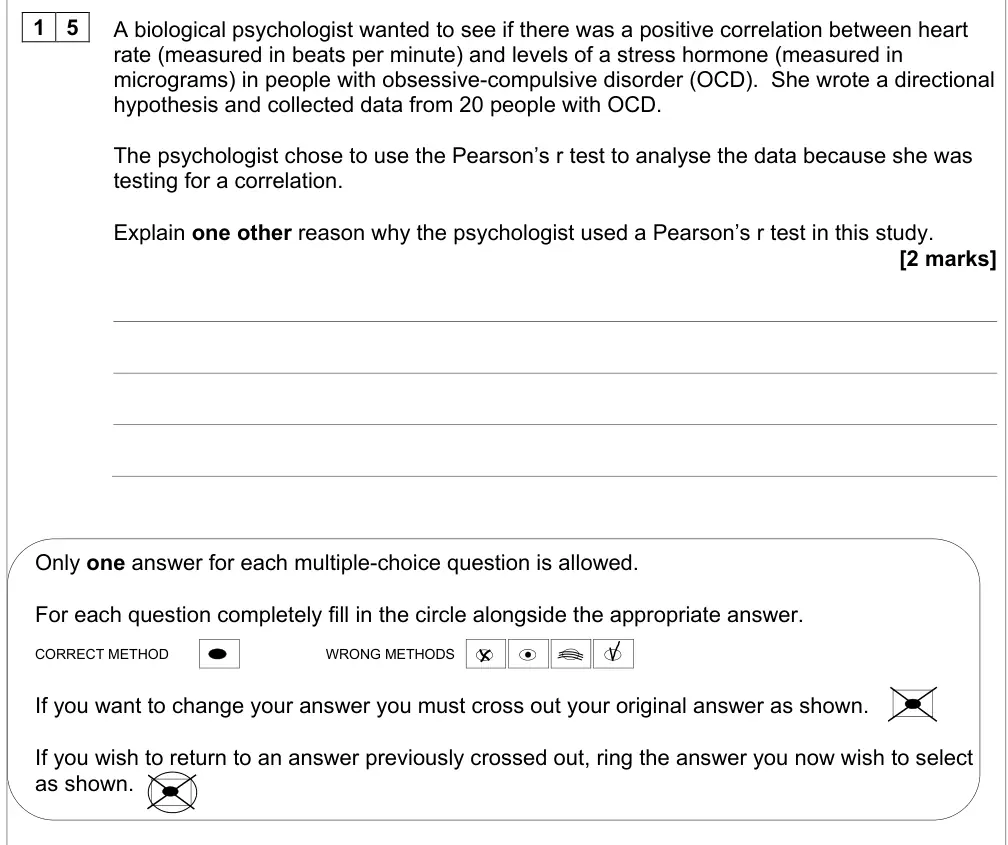
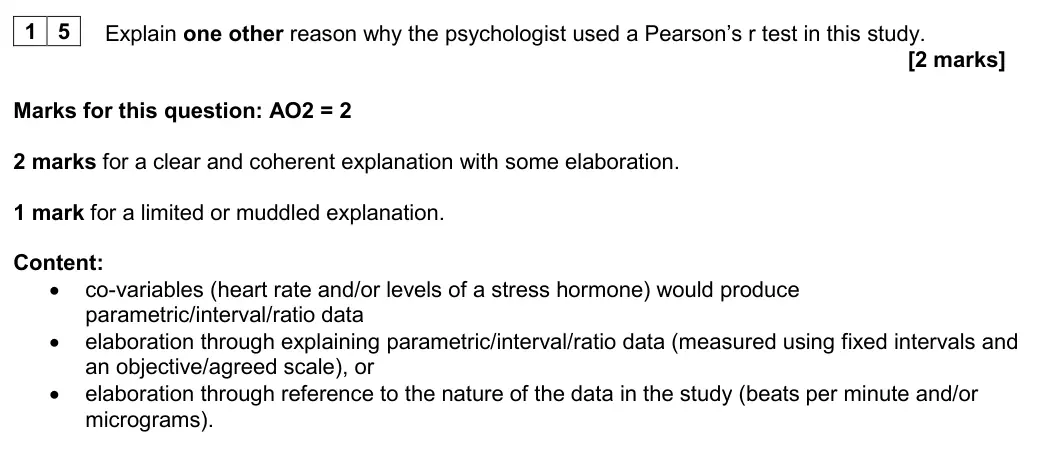
This question was answered reasonably well. Most students could identify parametric/interval/ratio data, but some failed to elaborate accurately, for example by reference to the nature of interval data, or to the actual measures used in the study. It is important to note that a significant number of students failed to attempt Questions 15 and 17, potentially indicating a lack of preparation for the statistics element of the exam.
Notes from the mark scheme and report
interval/ratio/parametric data, elaborated by defining interval data or referring to bpm/micrograms
many did not attempt 15 and 17
June 2022 · Paper 1 · Q161 markAO2=1Multiple choice
Mark scheme, including level descriptors and indicative content
Examiner's comment
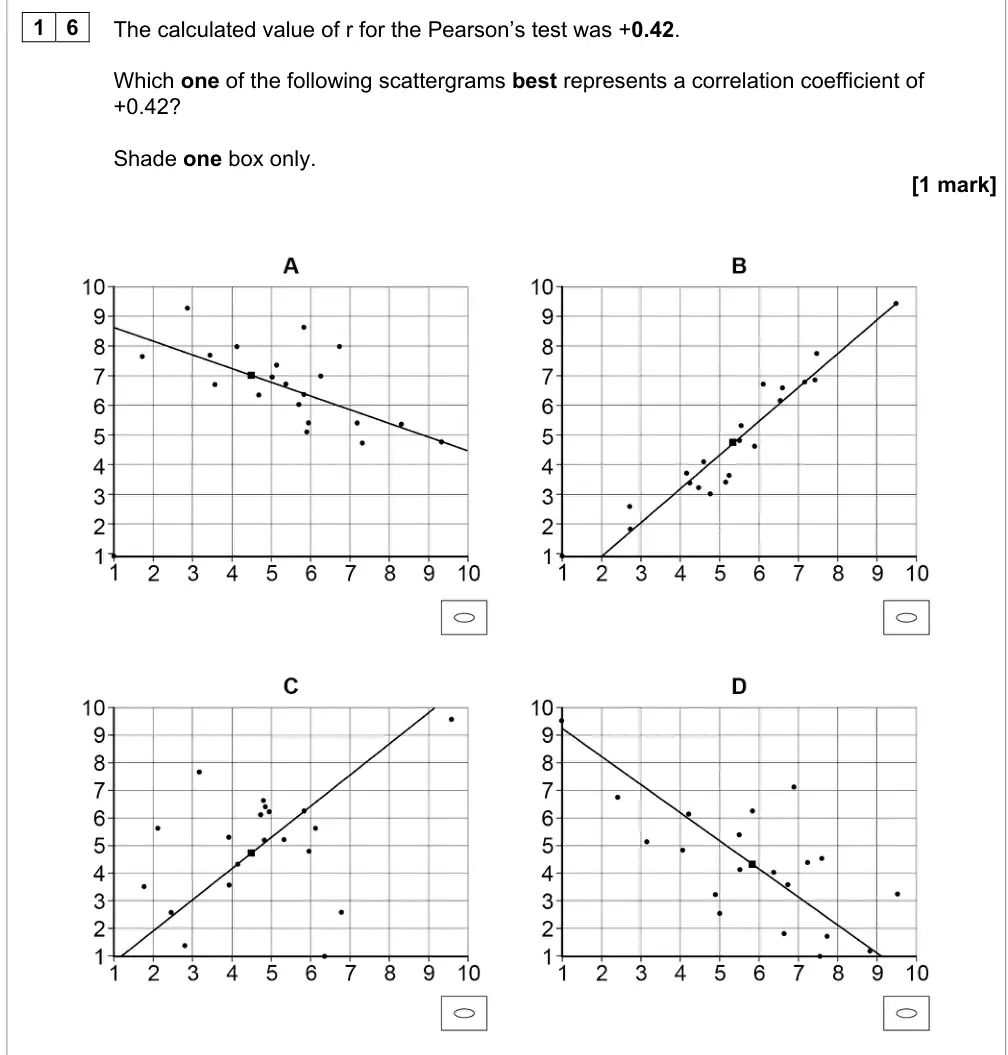
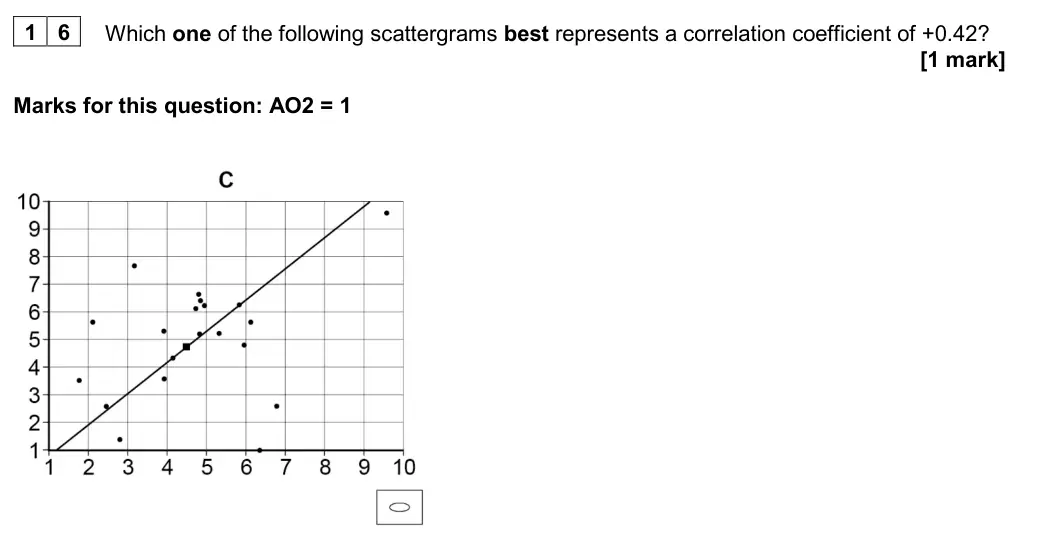
This question was answered reasonably well, with many students accurately identifying the nature of the correlation.
Notes from the mark scheme and report
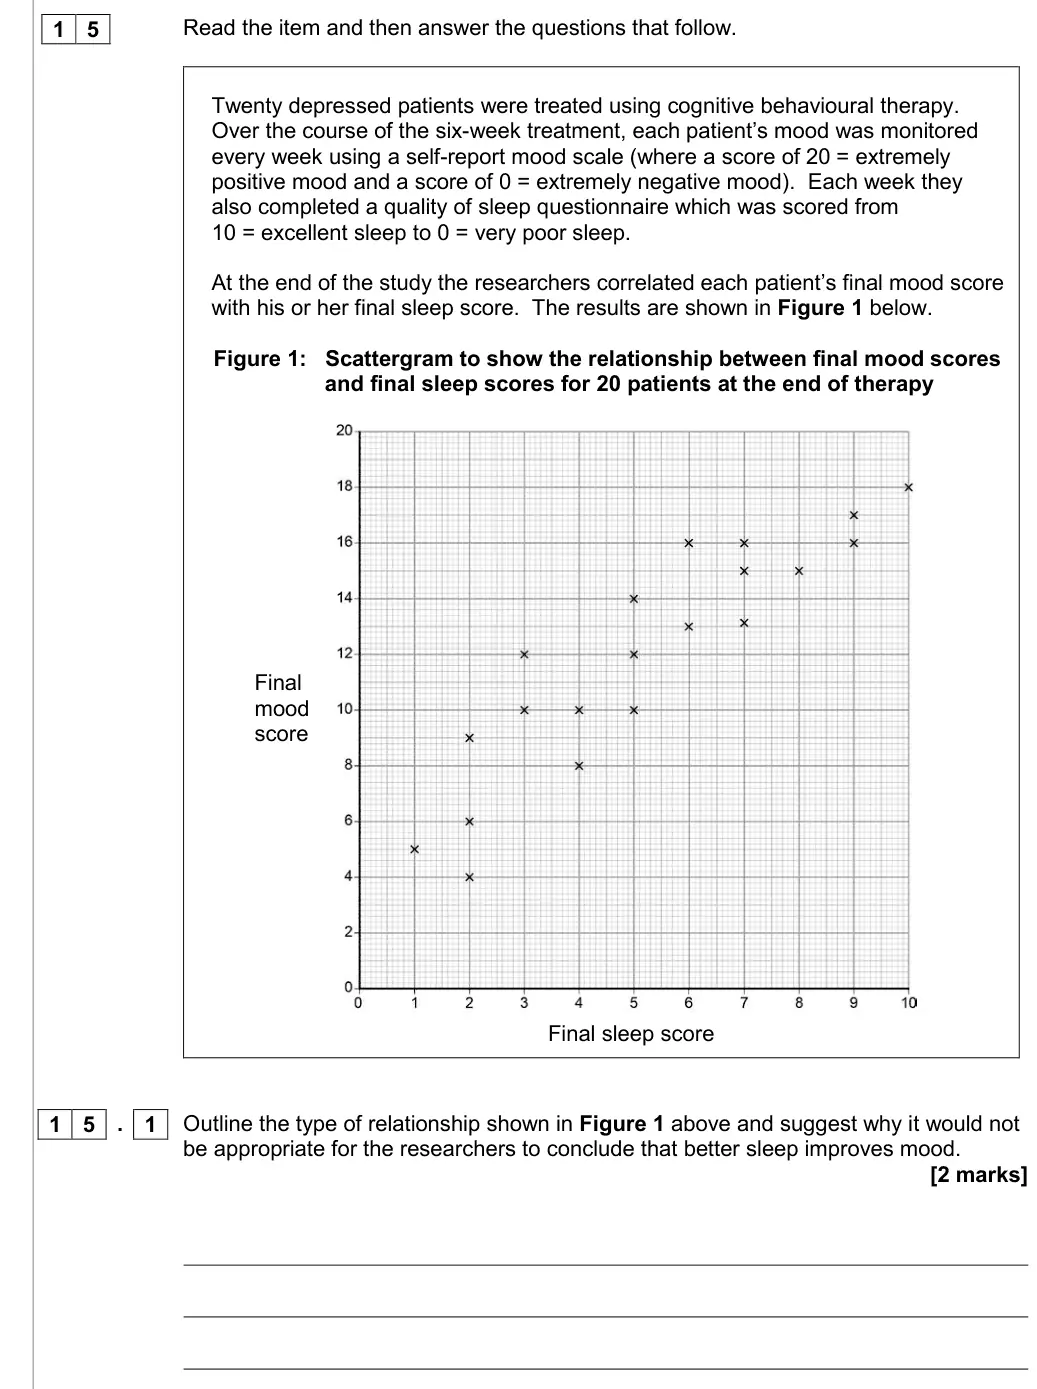
weak-moderate positive correlation scattergram
answered reasonably well
June 2022 · AS Paper 2 · Q10.32 marksAO2=2Research methods
Mark scheme, including level descriptors and indicative content
Examiner's comment
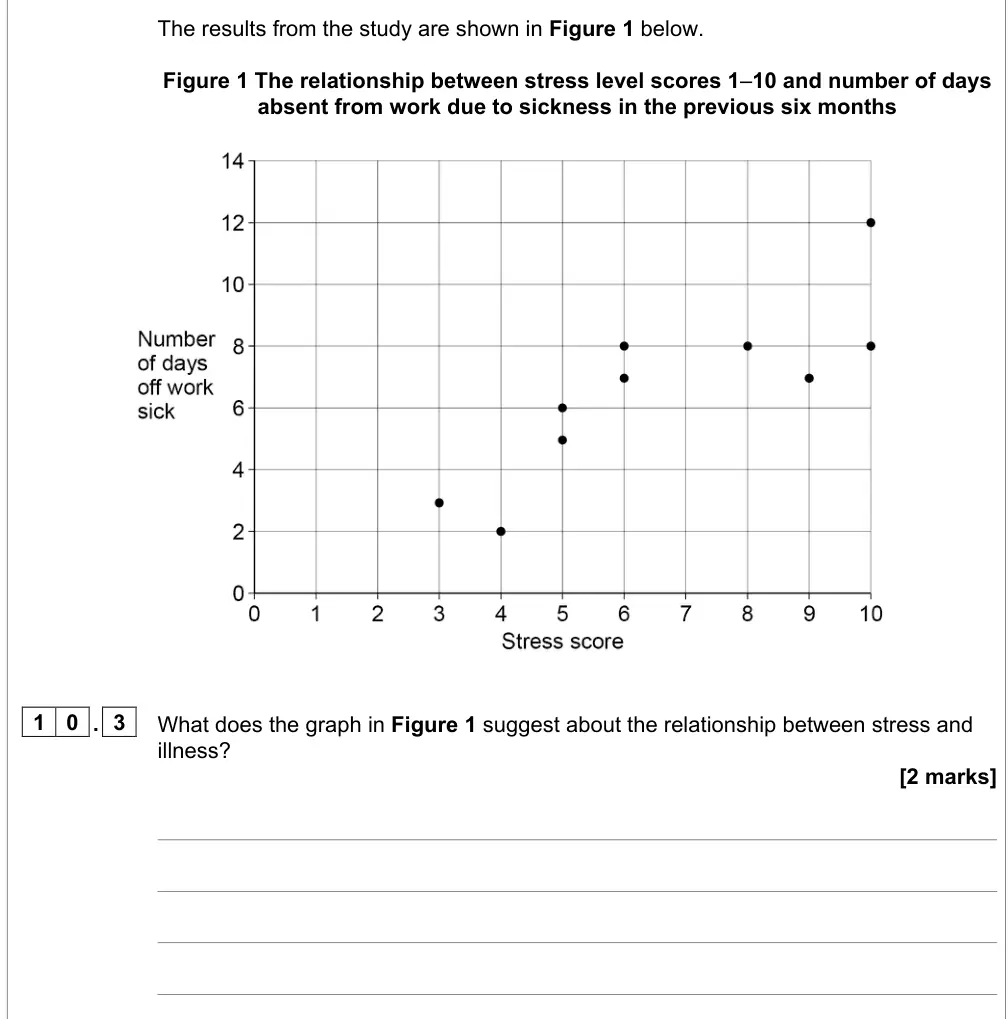
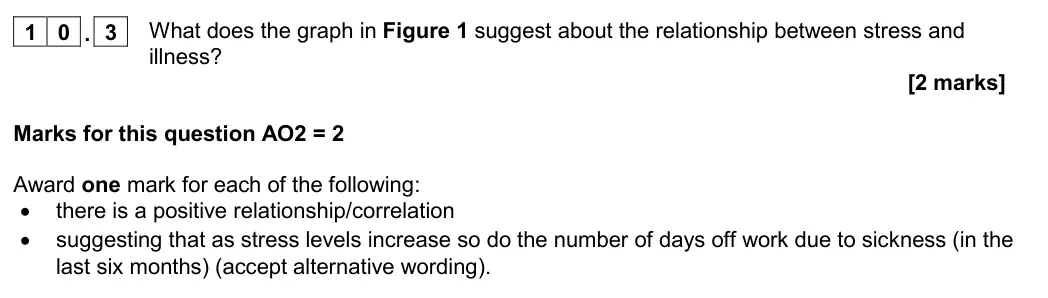
Students struggled with this question and demonstrated a lack of understanding of correlations in general and specifically how to analyse scattergrams. Many students failed to identify the nature of the relationship and for some that did, their justification was often lacking and not fully applied to the context of the study. For example, some students simply stated that as stress increases, so does illness.
Notes from the mark scheme and report
positive correlation + as stress increases so do days absent (in context)
students struggled to read the scattergram
June 2022 · AS Paper 2 · Q10.52 marksAO2=2Multiple choice
Answer
B
Mark scheme, including level descriptors and indicative content
Examiner's comment
There were many full mark responses to this question with most students clearly demonstrating an understanding of types of data and an ability to apply this knowledge to the study.
Notes from the mark scheme and report
answers B (primary) and D (quantitative)
distractors meta-analysis, qualitative, secondary
June 2022 · AS Paper 2 · Q11.12 marksAO2=1, AO3=1Research methods
Mark scheme, including level descriptors and indicative content
Examiner's comment
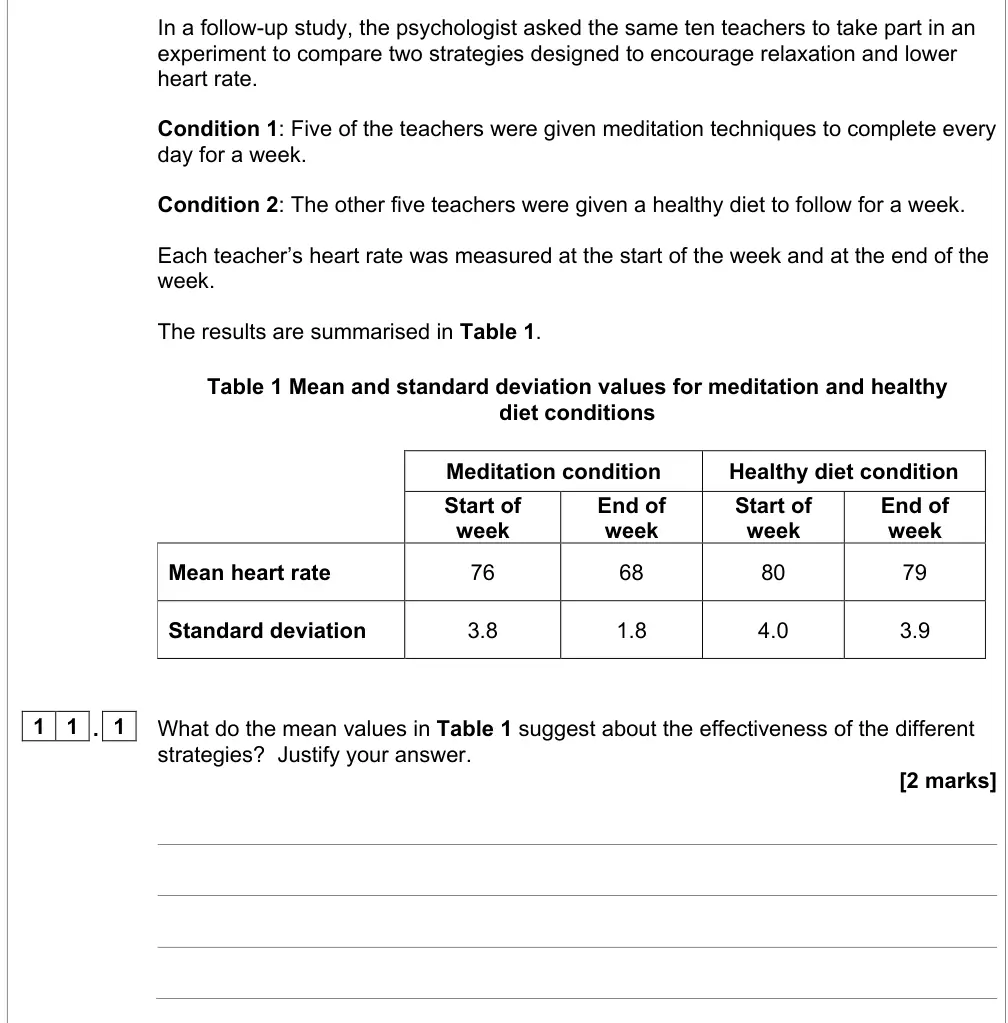
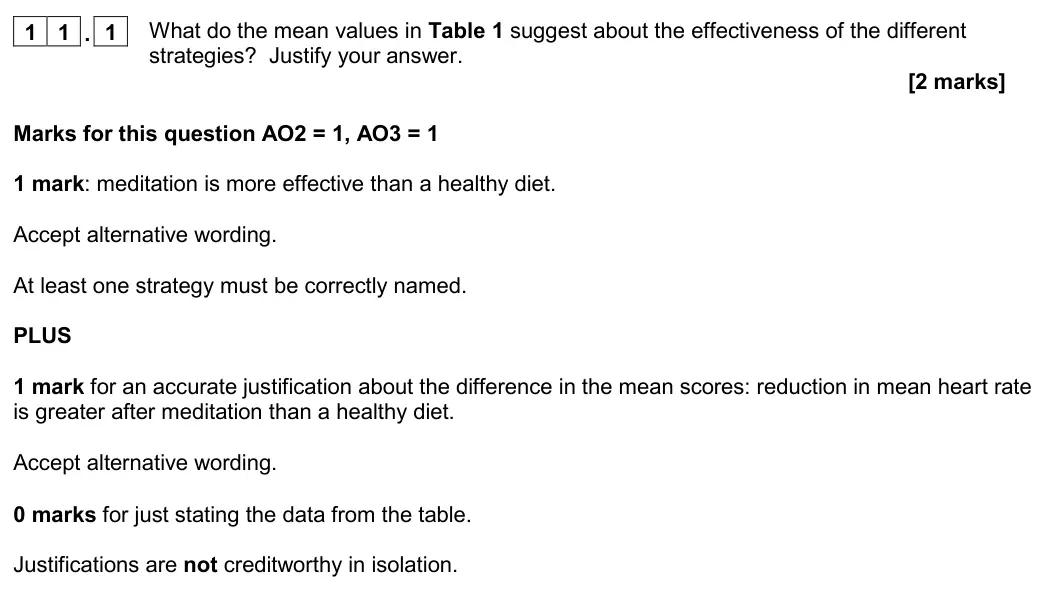
It was clear from responses seen that many students appeared to have some understanding of the mean and what this told us about the effectiveness of the strategies in the follow-up study. Most students were able to correctly state that meditation was more effective. However, some struggled with the justification and simply repeated the values from the table rather than talk about the difference in the mean scores from the start and the end of the week.
Notes from the mark scheme and report
meditation more effective + justification from the greater reduction in mean heart rate
just restating table values = 0
justification not creditworthy in isolation
June 2022 · AS Paper 2 · Q11.22 marksAO2=1, AO3=1Research methods
Mark scheme, including level descriptors and indicative content
Examiner's comment
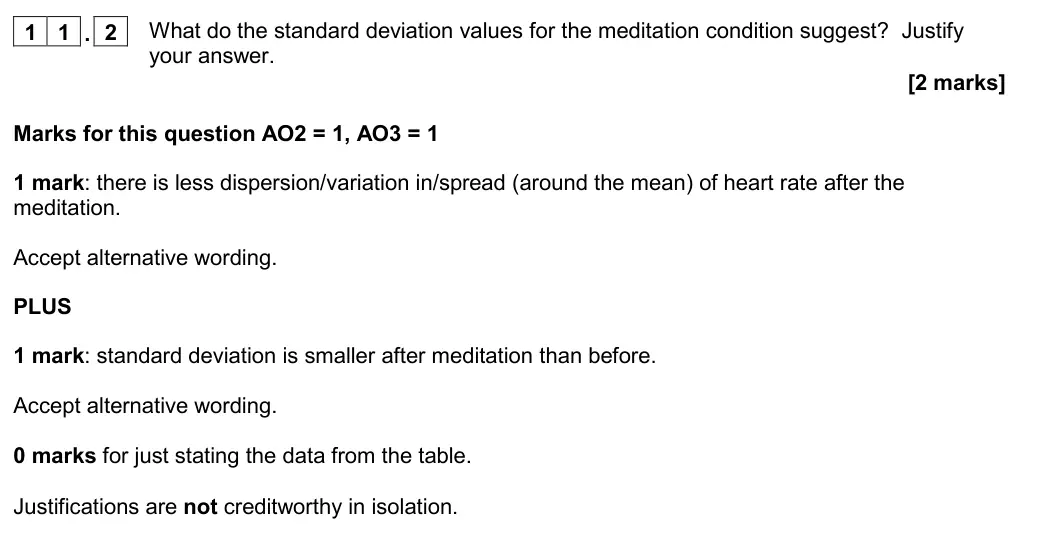
Many students were unable to draw an accurate conclusion and then justify it using the standard deviation scores. These students demonstrated a poor understanding of what the standard deviation is and what it represents. Some responses did not focus on the meditation condition and instead discussed the difference between the two strategies, which was not what the question demanded. As with question 11.1, many students simply repeated the values from the table rather than talk about the difference in the standard deviation scores from the start of and at the end of the week for the meditation condition.
Notes from the mark scheme and report
less spread/variation in heart rate after meditation + SD smaller after than before
many misunderstood SD or compared the two conditions instead
June 2022 · Paper 2 · Q157 marksAO2=7Research methods
Mark scheme, including level descriptors and indicative content
Examiner's comment
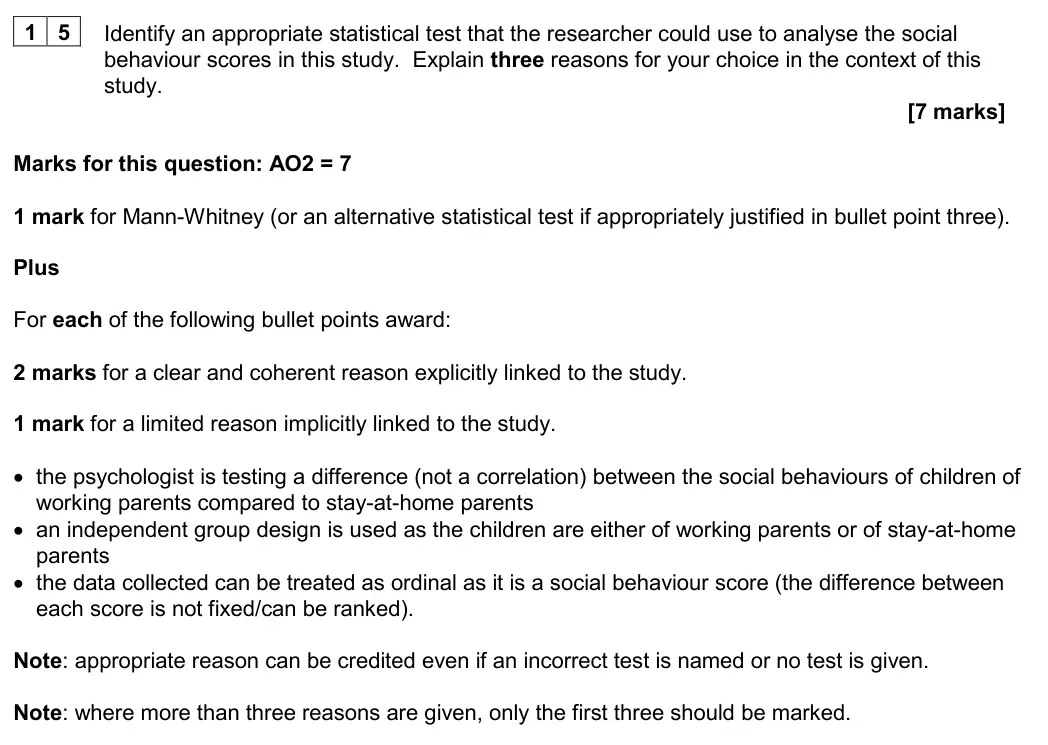
This question discriminated well. Most students remembered to explain their reasons for their choice of statistical test in the context of the study and there were some very clear, accurate and effectively applied responses seen. However, many students identified Chi-Squared test as an appropriate statistical test but did not explain how the data would be converted from ordinal to nominal. Some students suggested that the data was nominal because there were two conditions of the independent variable or because there were different behavioural categories used in the observation. Others incorrectly justified independent group design due to the children being observed separately/independently. Overall, the best explanations for a reason given were those regarding a test of difference.
Notes from the mark scheme and report
Mann-Whitney + three contextualised reasons (difference, independent groups - children of working vs stay-at-home parents, ordinal social behaviour scores), 2 marks each
Chi-squared without explaining conversion to nominal
independent groups wrongly justified by children being observed separately
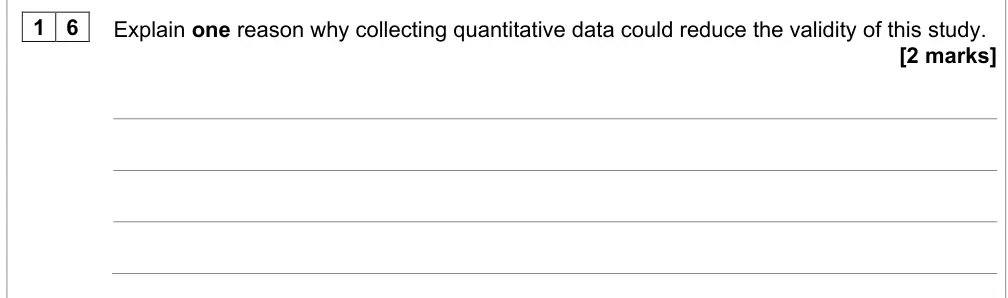
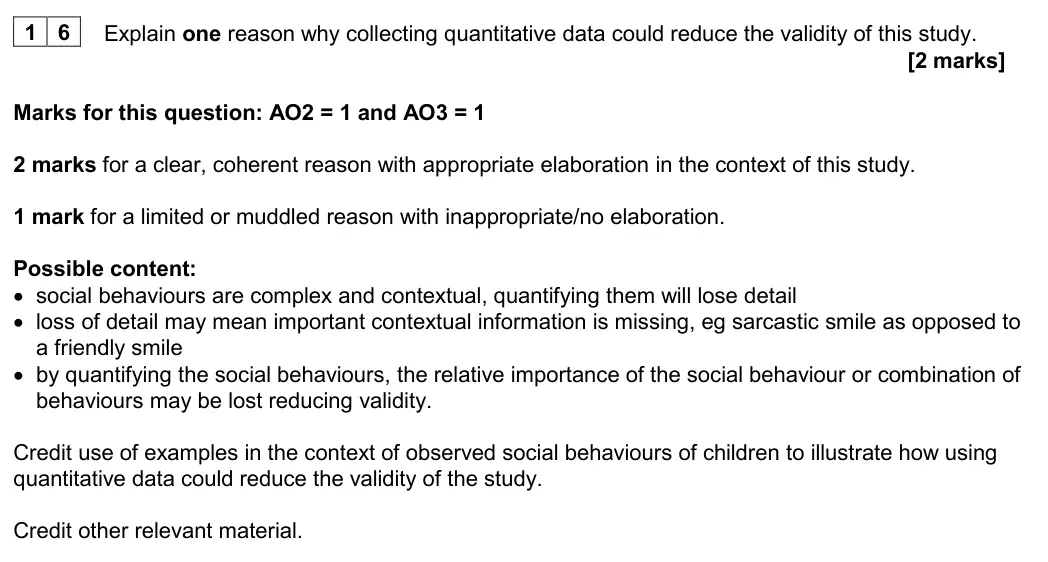
June 2022 · Paper 2 · Q162 marksAO2=1, AO3=1Research methods
Mark scheme, including level descriptors and indicative content
Examiner's comment
This question was generally well answered, although many students were restricted to one mark due to a lack of appropriate elaboration in the context of the study. Additionally, there was some confusion between quantitative and qualitative data with students explaining why collecting qualitative data could reduce the validity of the study.
Notes from the mark scheme and report
quantifying complex contextual social behaviour loses detail (e.g. sarcastic vs friendly smile), reducing validity
lack of contextual elaboration limited to 1
some explained why QUALITATIVE data reduces validity
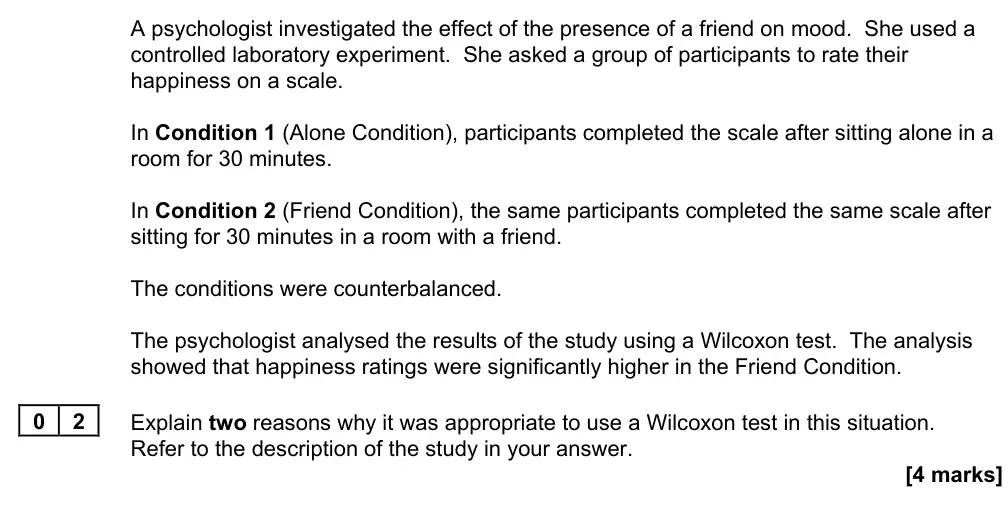
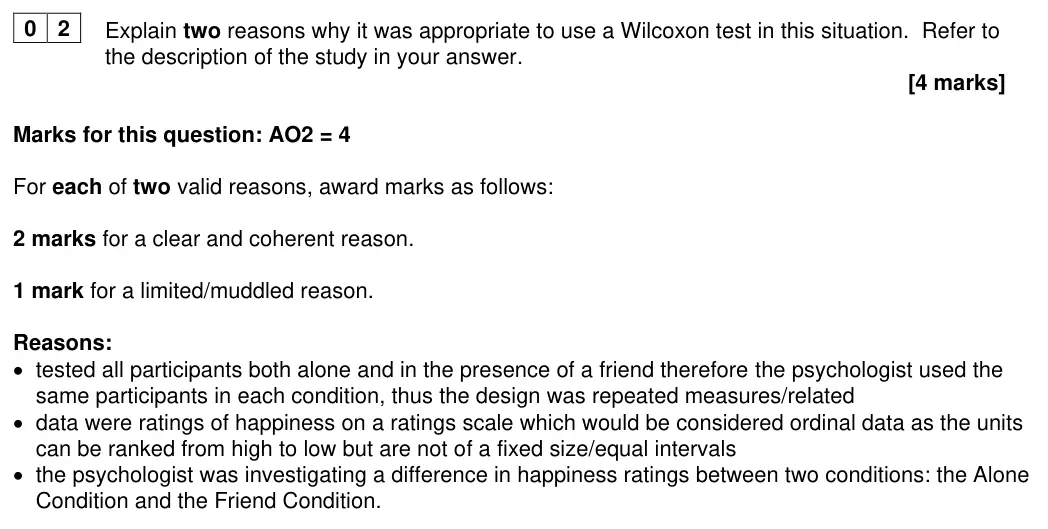
June 2022 · Paper 3 · Q24 marksAO2=4Research methods
Mark scheme, including level descriptors and indicative content
Examiner's comment
Question 02 was usually very well answered and sometimes accompanied by a decision diagram.
Notes from the mark scheme and report
2 marks per reason, in context: same participants alone and with friend = repeated measures/related
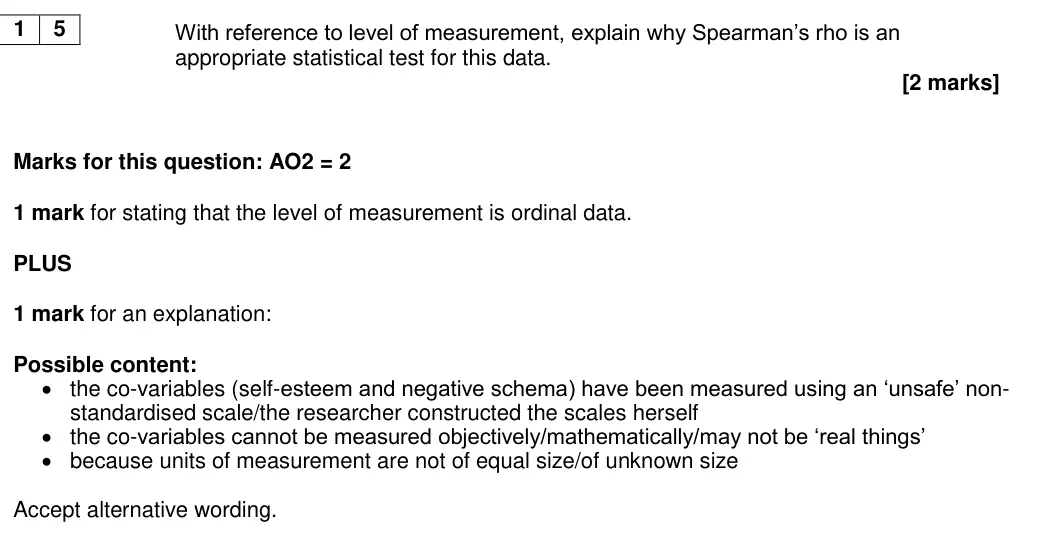
happiness ratings = ordinal
testing for a difference between two conditions
well answered
June 2022 · Paper 3 · Q164 marksAO3=4Research methods
Mark scheme, including level descriptors and indicative content
Examiner's comment
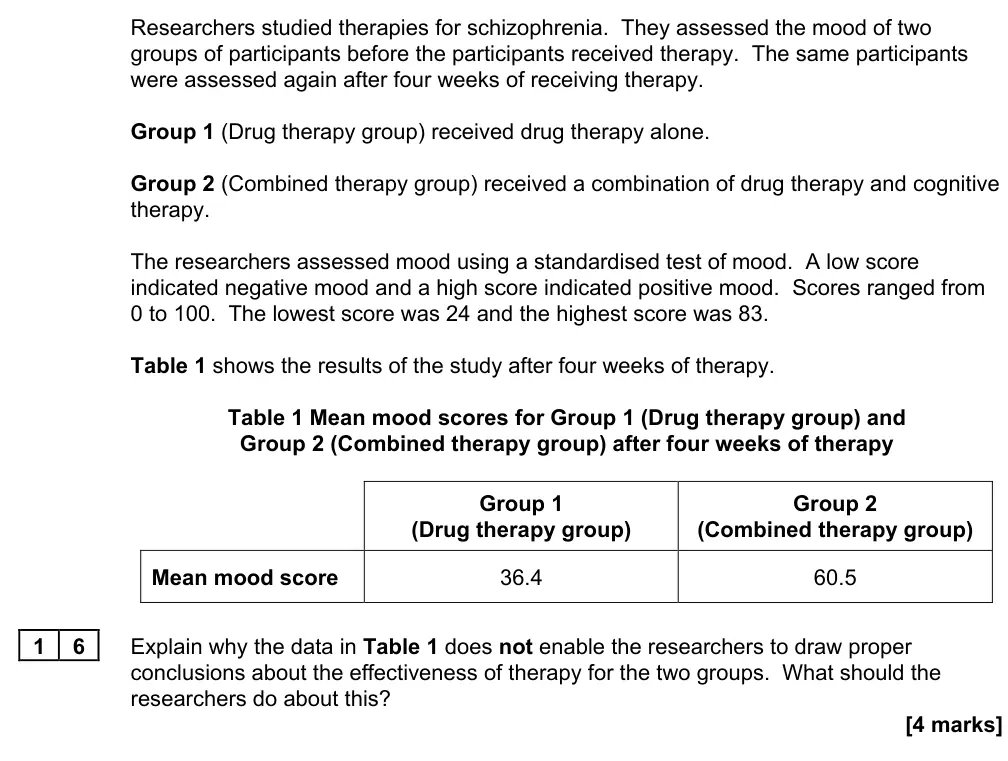
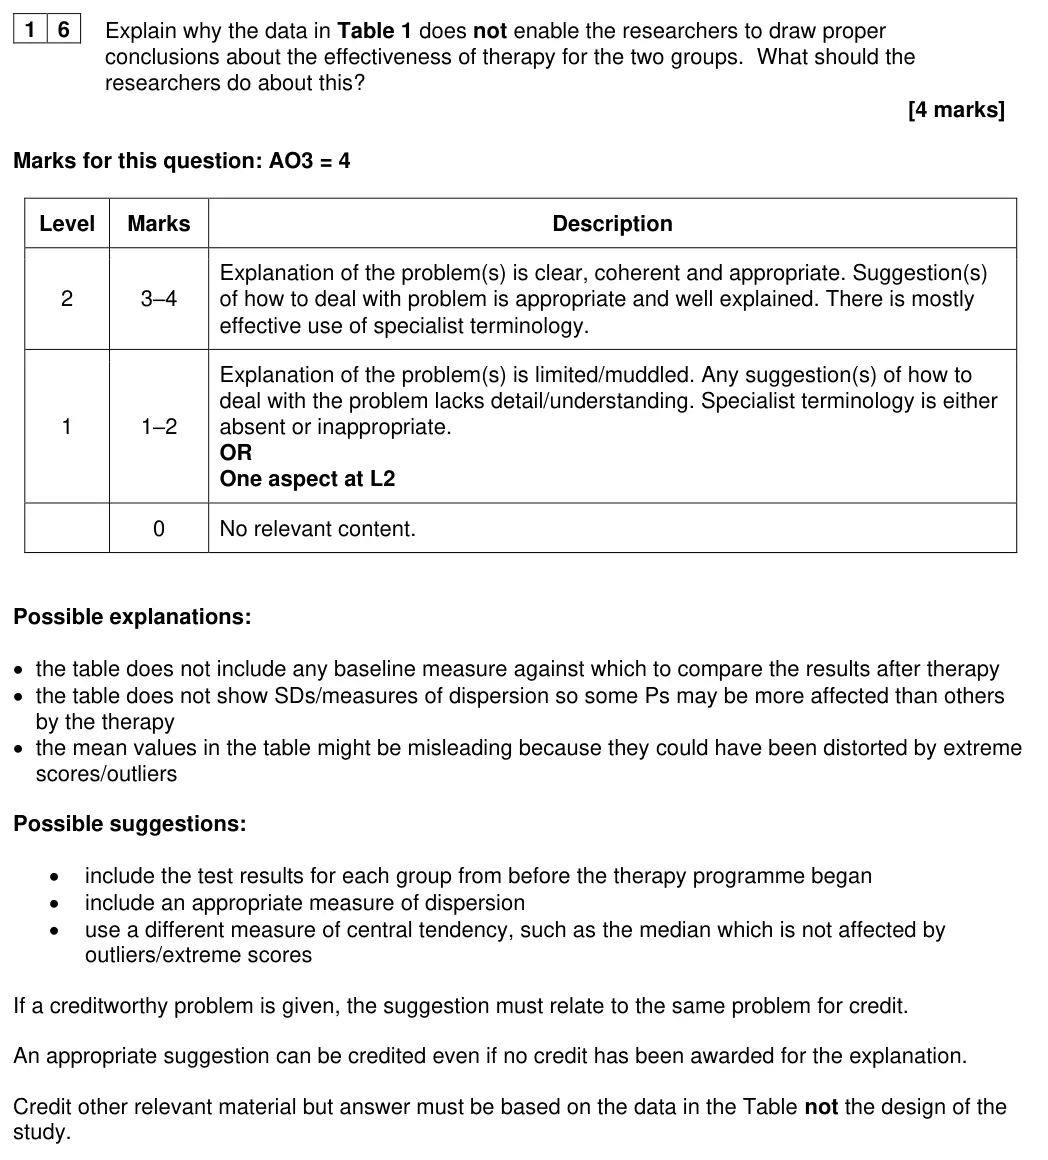
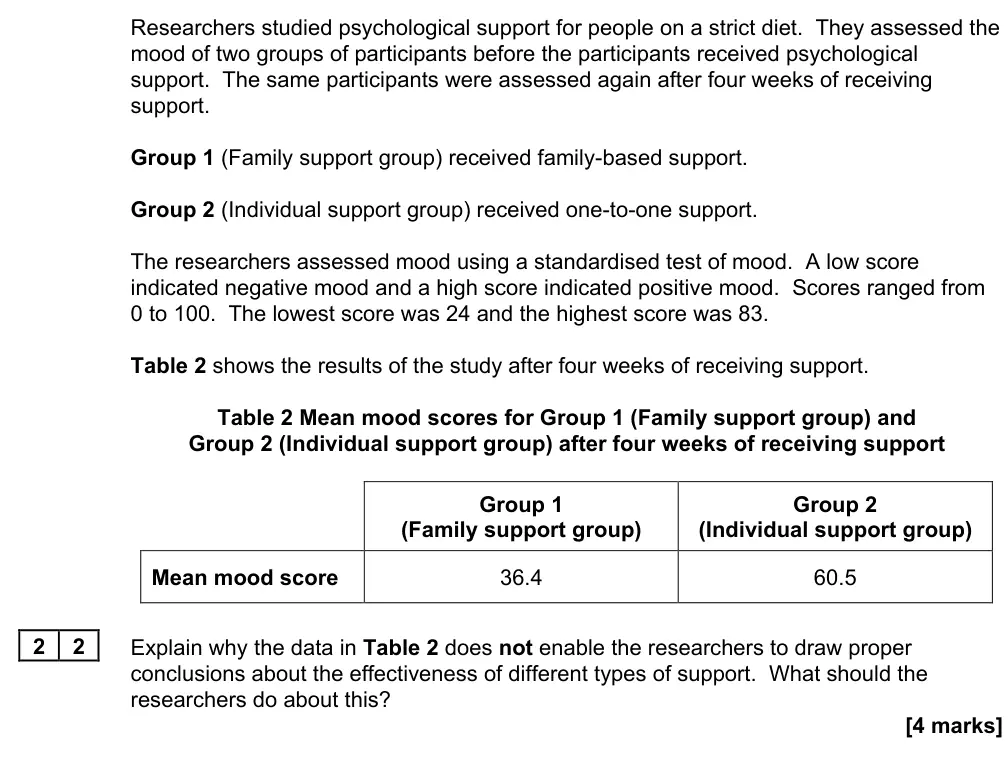
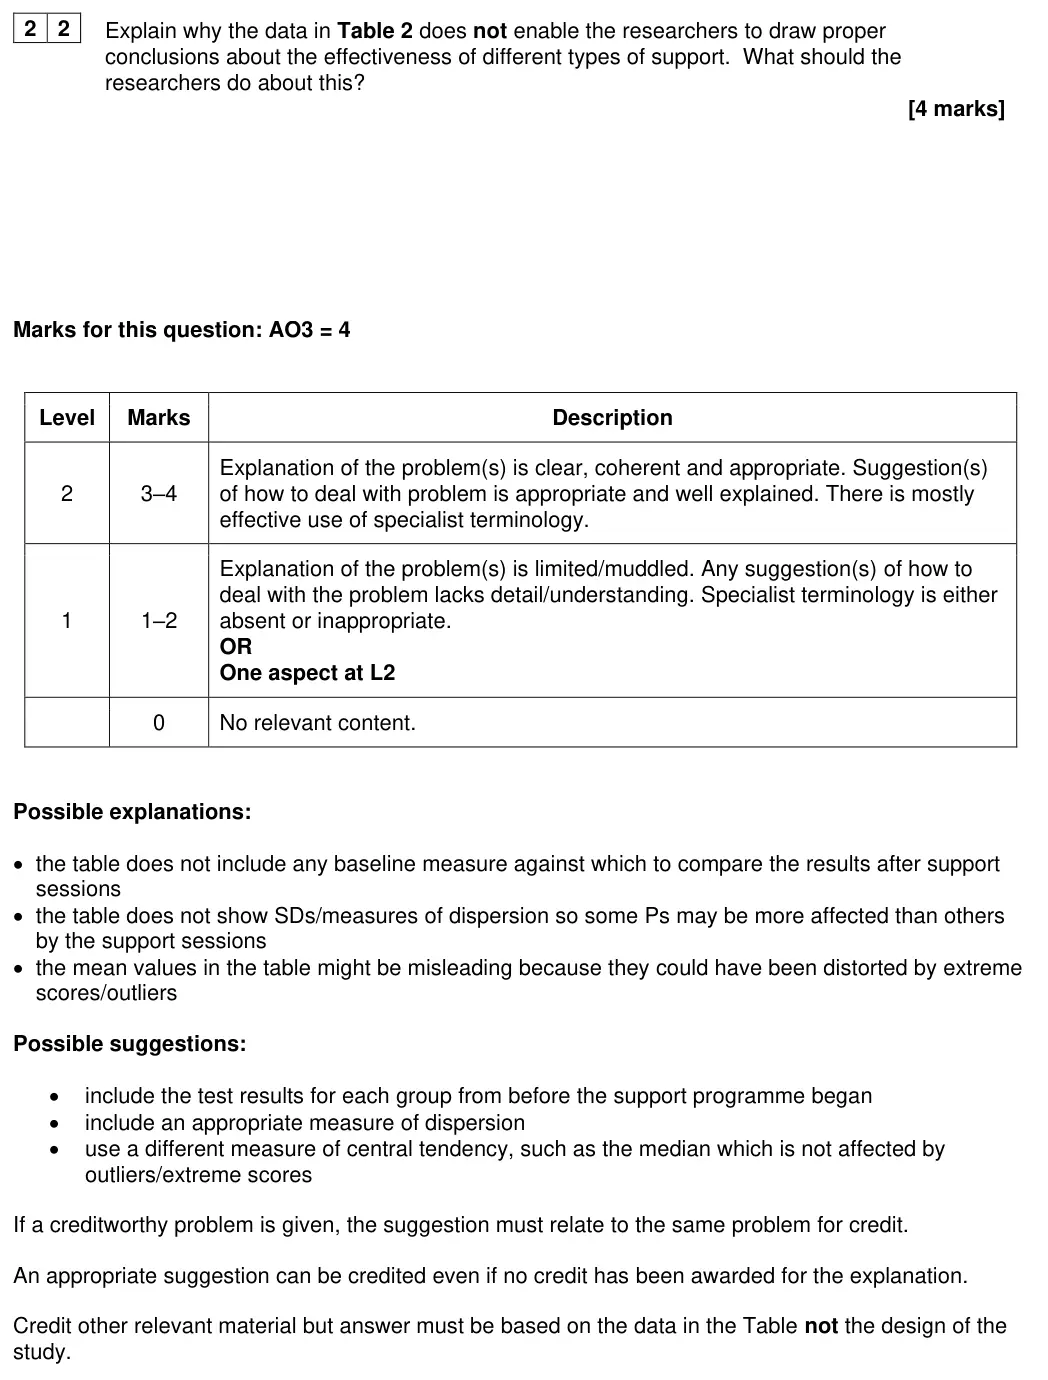
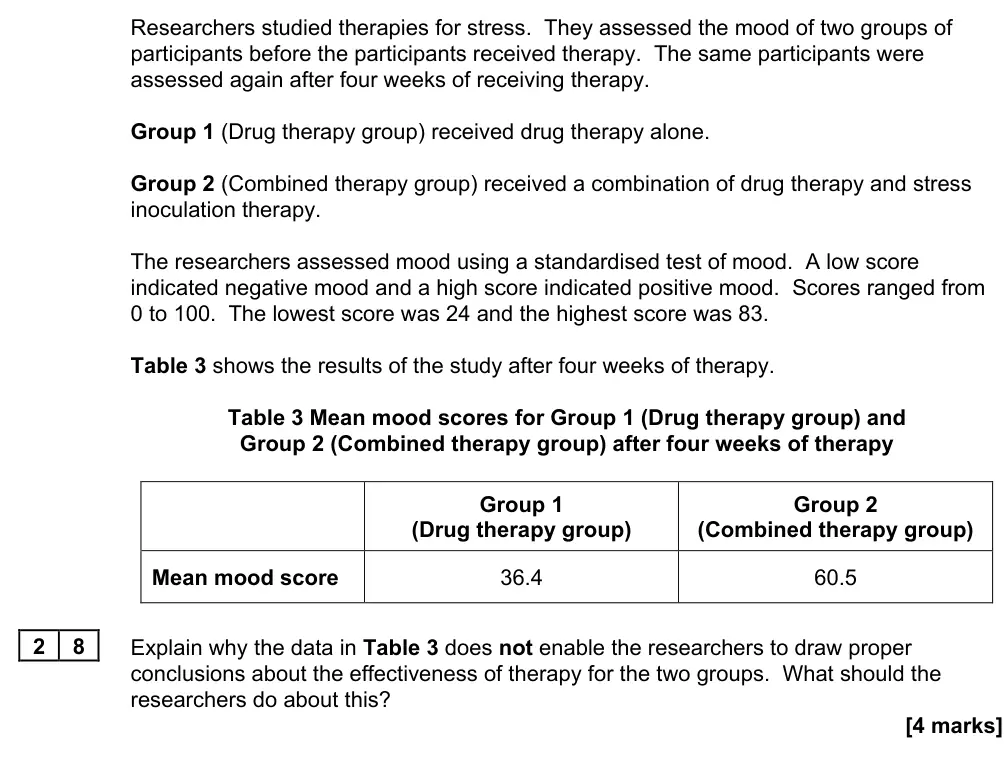
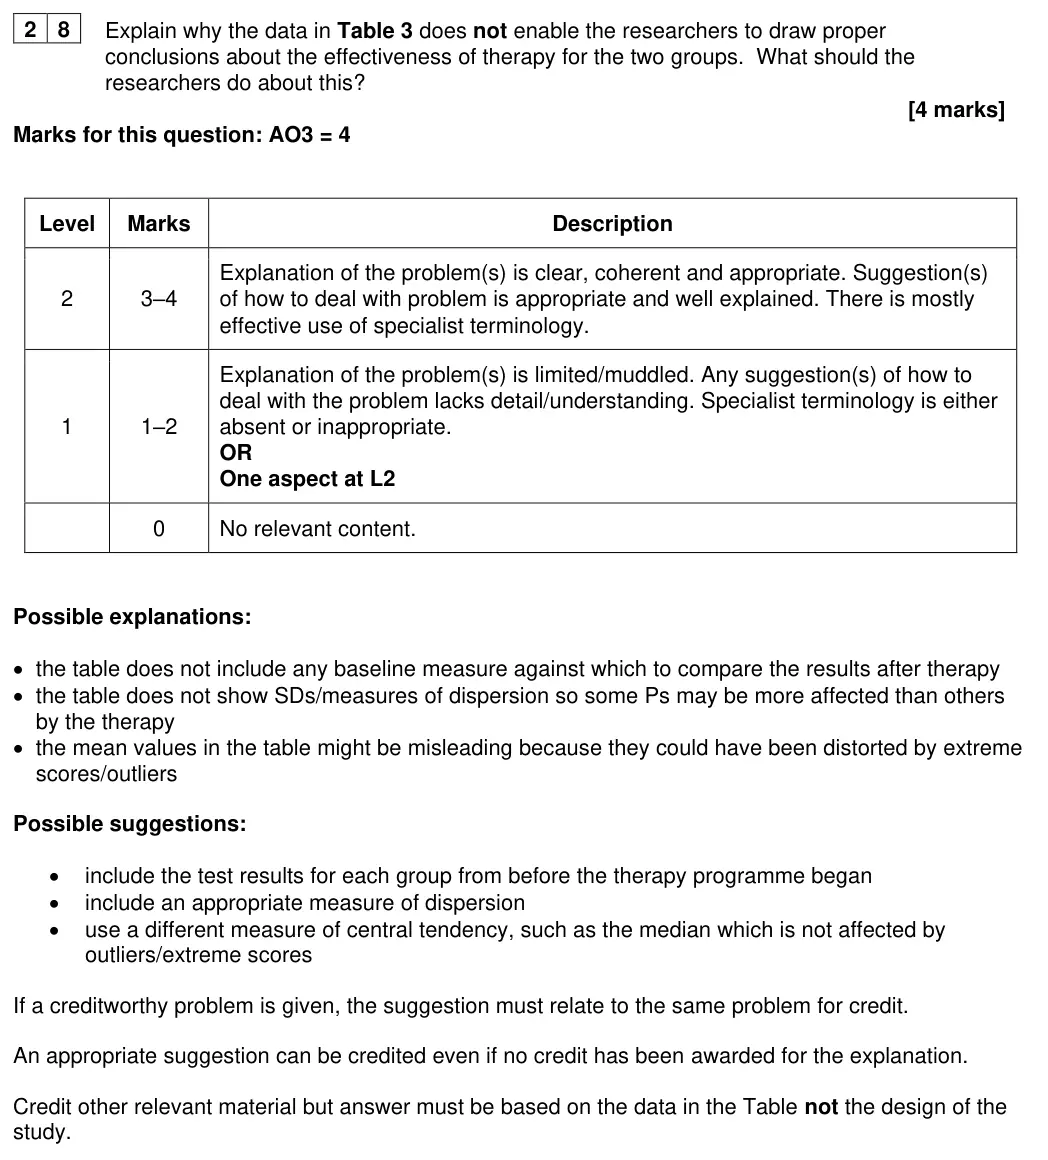
Question 16 was generally not well answered because students focused on aspects of the design of the study rather than on the data in the table. Despite the stem clearly stating that mood was assessed before the therapy began, relatively few students recognised that this data should have been included in the table. Other acceptable reasons included problems with interpretation of the mean and absence of any measure of dispersion. Even where students identified a creditworthy reason for the first part of the question, they sometimes forgot to attend to the second part of the question, offering no solution.
Notes from the mark scheme and report
problem with the DATA not the design: no baseline (pre-therapy) scores, no measure of dispersion, means distorted by outliers + matching remedy (add pre-scores, SD, use median)
design-focused answers scored poorly
many omitted the remedy
June 2022 · Paper 3 · Q174 marksAO2=4Research methods
Mark scheme, including level descriptors and indicative content
Examiner's comment
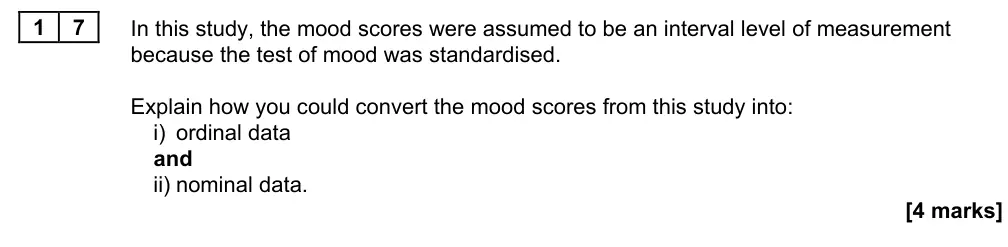
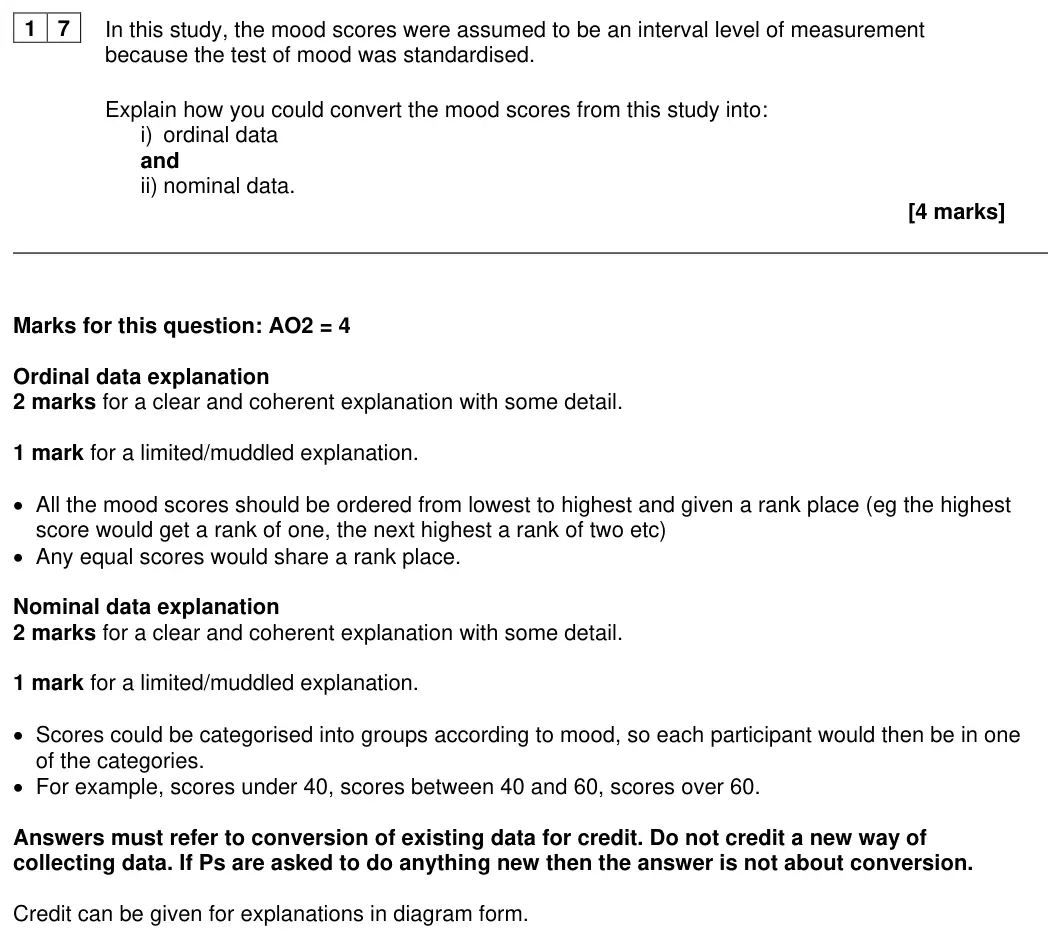
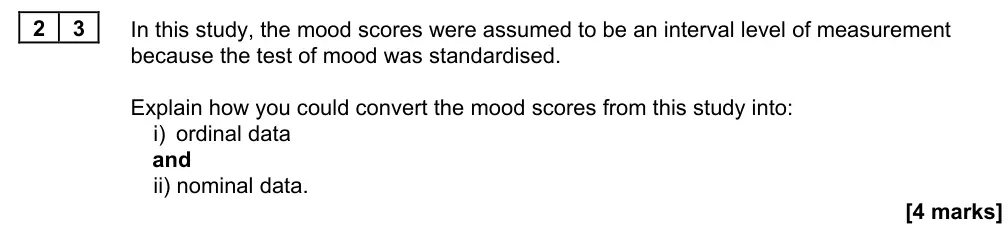
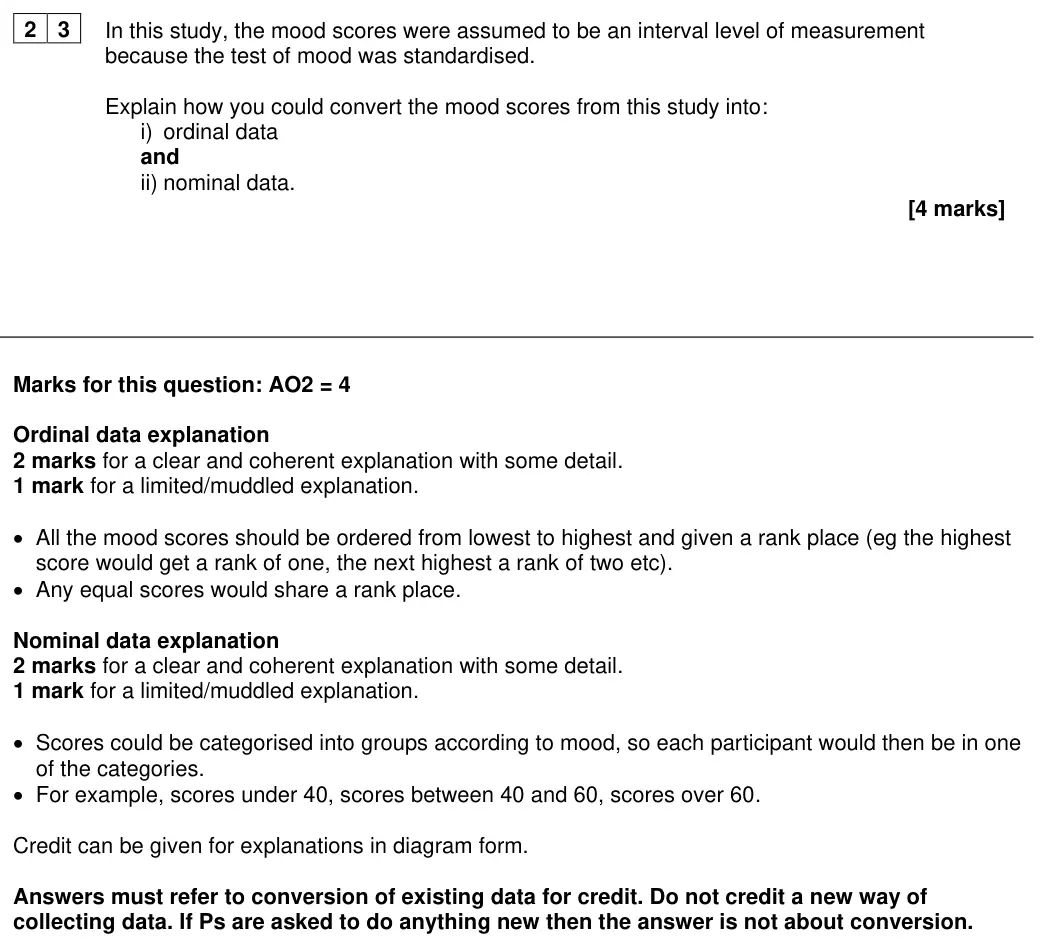
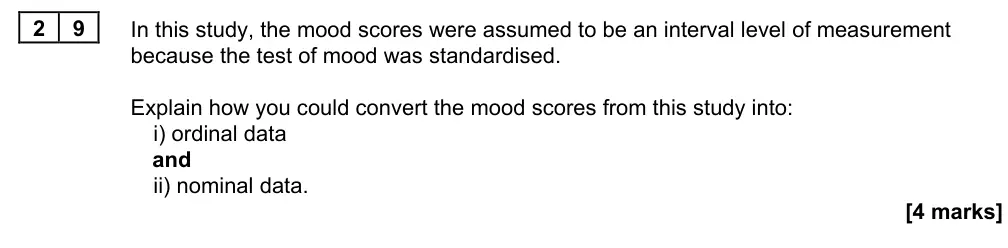
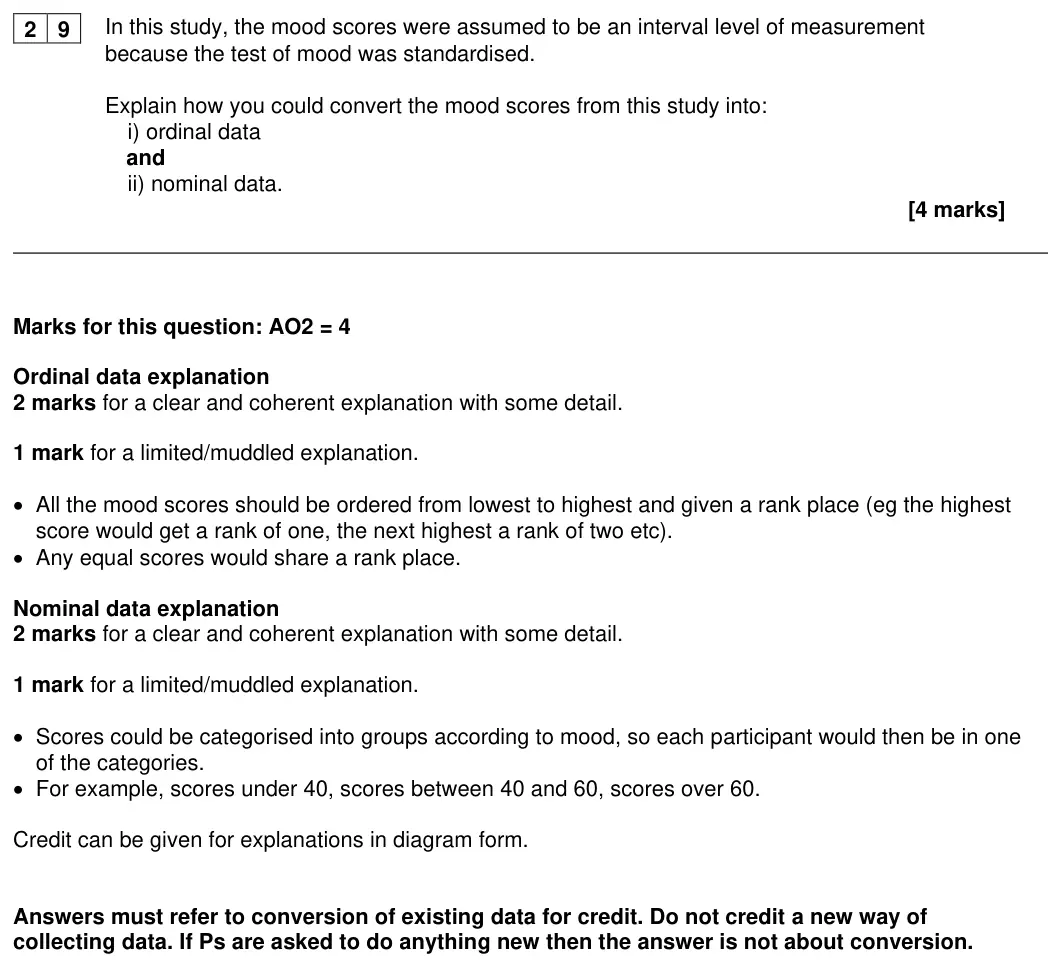
Question 17 was very poorly answered by most students, mainly because entirely new ways of collecting data were suggested rather than ways to convert the existing scores. Converting interval data into ordinal data and then into nominal data is a useful classroom activity, but evidently many students had not benefitted from such experience.
Notes from the mark scheme and report
ordinal: rank all scores (tied ranks shared)
nominal: categorise scores into mood bands (e.g. <40, 40-60, >60)
must convert existing data, not collect new data
very poorly answered
June 2022 · Paper 3 · Q224 marksAO3=4Research methods
Mark scheme, including level descriptors and indicative content
Examiner's comment
Question 22 was generally not well answered because students focused on aspects of the design of the study rather than on the data in the table. Despite the stem clearly stating that mood was assessed before the support programme began, relatively few students recognised that this data should have been included in the table. Other acceptable reasons included problems with interpretation of the mean and absence of any measure of dispersion. Even where students identified a creditworthy reason for the first part of the question, they sometimes forgot to attend to the second part of the question, offering no solution.
Notes from the mark scheme and report
stem is support for people on a strict diet (dieting removed in v1.4) but marks need only data handling: no baseline scores, no dispersion, outliers + matching remedy
design-focused answers scored poorly
June 2022 · Paper 3 · Q234 marksAO2=4Research methods
Mark scheme, including level descriptors and indicative content
Examiner's comment
Question 23 was very poorly answered by most students, mainly because entirely new ways of collecting data were suggested rather than ways to convert the existing scores. Converting interval data into ordinal data and then into nominal data is a useful classroom activity, but evidently many students had not benefitted from such experience.
Notes from the mark scheme and report
ordinal: rank all scores
nominal: categorise into mood bands
must convert existing data, not collect new data
very poorly answered
June 2022 · Paper 3 · Q284 marksAO3=4Research methods
Mark scheme, including level descriptors and indicative content
Examiner's comment
Question 28 was generally not well answered because students focused on aspects of the design of the study rather than on the data in the table. Despite the stem clearly stating that mood was assessed before the therapy began, relatively few students recognised that this data should have been included in the table. Other acceptable reasons included problems with interpretation of the mean and absence of any measure of dispersion. Even where students identified a creditworthy reason for the first part of the question, they sometimes forgot to attend to the second part of the question, offering no solution.
Notes from the mark scheme and report
problem with the DATA not the design: no baseline scores, no dispersion, outliers + matching remedy
June 2022 · Paper 3 · Q294 marksAO2=4Research methods
Mark scheme, including level descriptors and indicative content
Examiner's comment
Question 29 was very poorly answered by most candidates, mainly because entirely new ways of collecting data were suggested rather than ways to convert the existing scores. Converting interval data into ordinal data and then into nominal data is a useful classroom activity, but evidently many students had not benefitted from such experience.
Notes from the mark scheme and report
ordinal: rank all scores
nominal: categorise into mood bands
must convert existing data, not collect new data
very poorly answered
November 2021 · Paper 1 · Q32 marksAO2=1, AO3=1Research methods
Mark scheme, including level descriptors and indicative content
Examiner's comment
Many students did not understand the concept of primary data, although they sometimes received credit for a relevant limitation even where the explanation was incorrect.
Notes from the mark scheme and report
1 mark why primary (collected first-hand for this investigation) + 1 mark limitation (time, effort, cost)
many did not understand primary data but could still gain the limitation mark
November 2021 · Paper 1 · Q137 marksAO2=7Research methods
Mark scheme, including level descriptors and indicative content
Examiner's comment
Overall performance was disappointing, with many students not even attempting this question. There were some excellent answers, and a number of students earned marks for their reasoning even where the incorrect test was identified.
Notes from the mark scheme and report
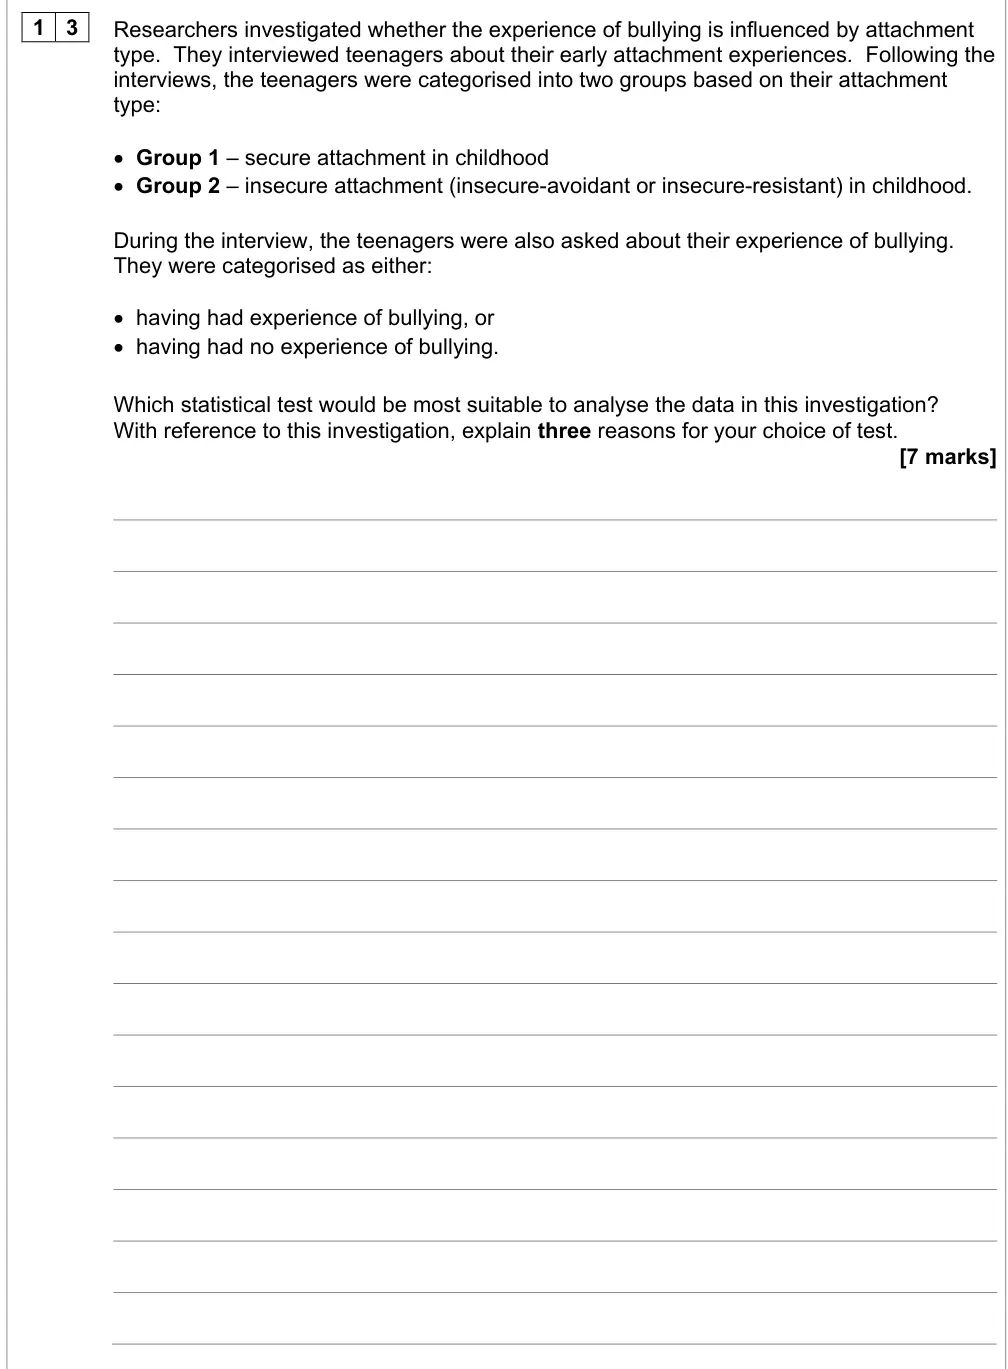
1 mark Chi-Squared + 3 reasons x 2 marks each linked to the study (difference/association, independent design, nominal data)
test of correlation not creditworthy
reasons credited even if wrong test
only first three reasons marked
many did not attempt
November 2021 · Paper 2 · Q132 marksAO2=2Research methods
Mark scheme, including level descriptors and indicative content
Examiner's comment
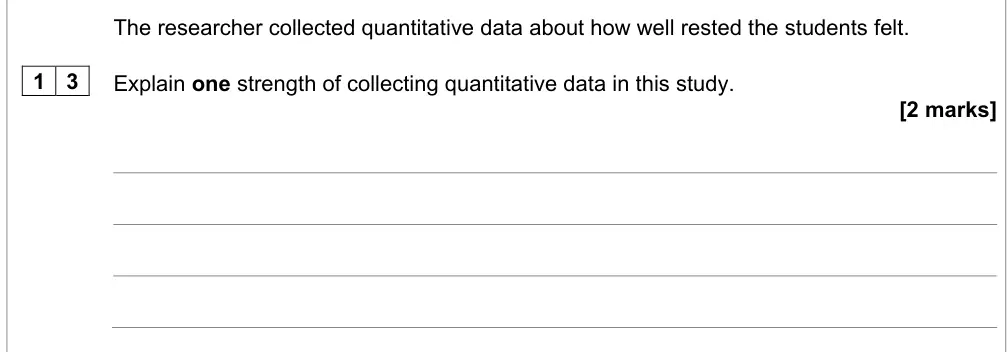
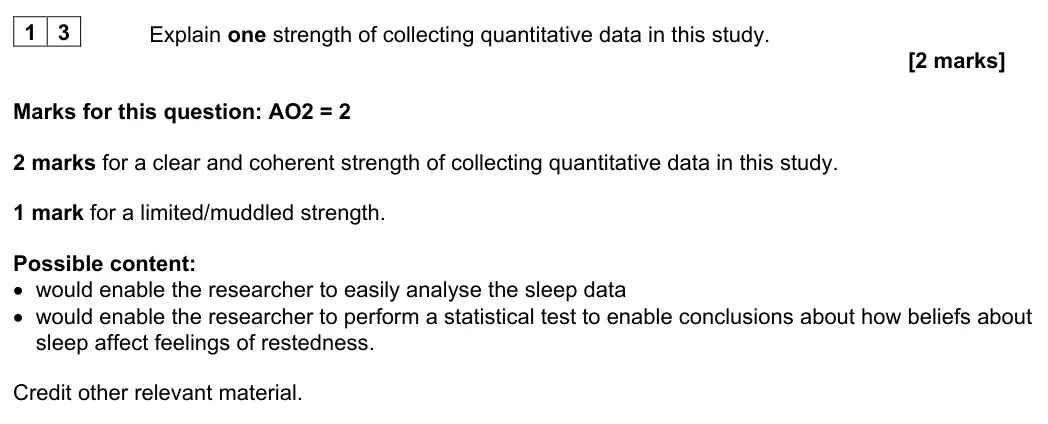
The majority of students were able to identify an appropriate strength of collecting quantitative data, but responses were often generic, with very few students being able to successfully explain the strength in the context of the study. Some students gave strengths of qualitative data, which were not creditworthy, but most showed a good understanding of the strengths of collecting quantitative data.
Notes from the mark scheme and report
easy to analyse/allows statistical testing of how well rested students felt
generic answers limited
strengths of qualitative data not creditworthy
November 2021 · Paper 2 · Q204 marksAO2=4Research methods
Mark scheme, including level descriptors and indicative content
Examiner's comment
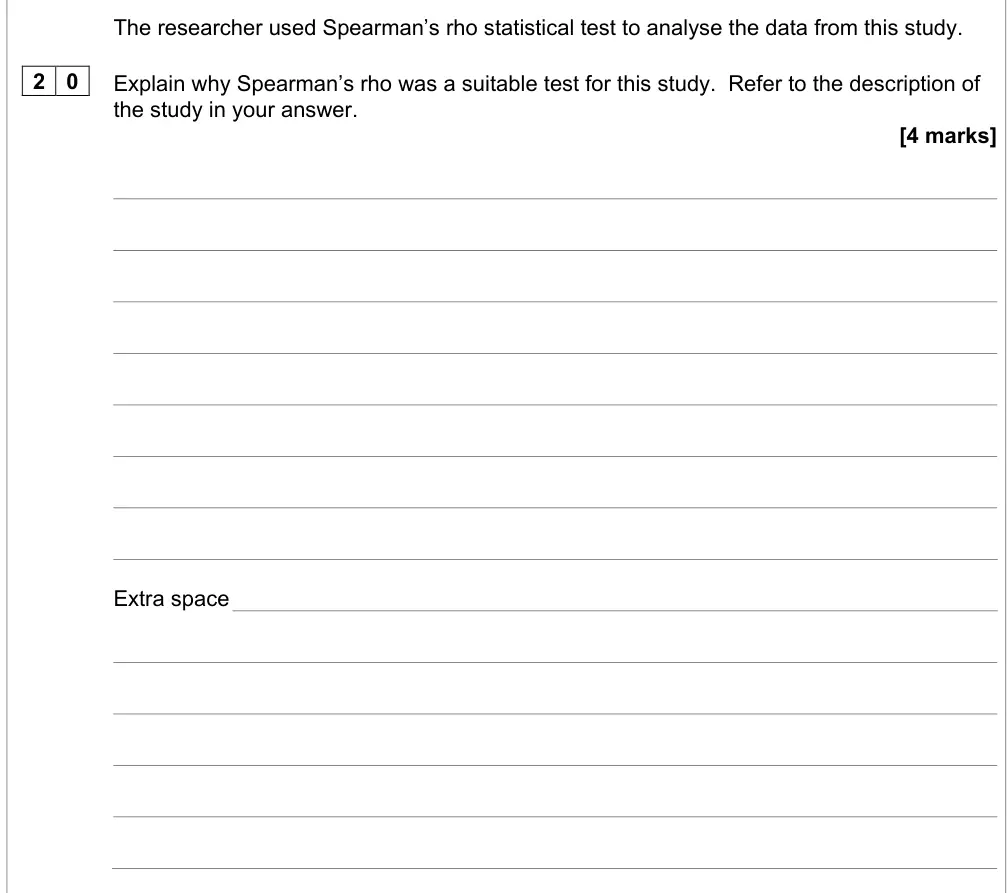
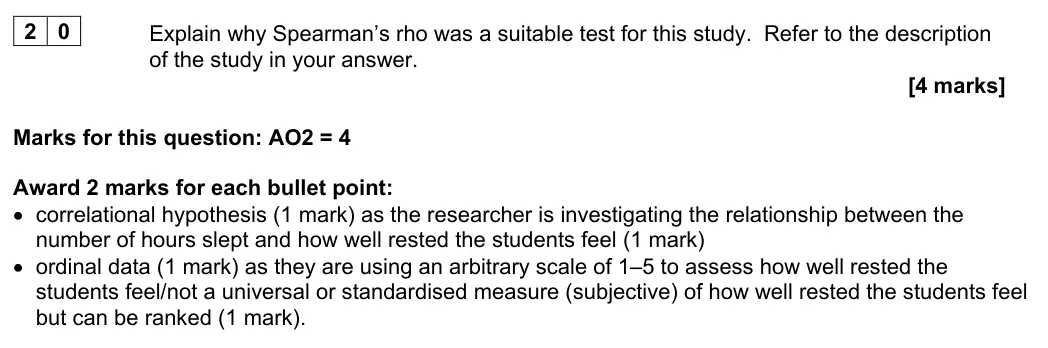
This question differentiated well but there were many students who did not attempt the question. Those attempting the question generally did well, especially on the first bullet point of the mark scheme. Some students did not refer to the description of the study in their answers, which limited them to a maximum of two marks.
Notes from the mark scheme and report
correlational hypothesis (relationship hours slept-restedness) + ordinal data (arbitrary 1-5 rating), 2 marks each
no reference to the study = max 2
many did not attempt
November 2020 · AS Paper 1 · Q5.12 marksAO2=1, AO3=1Research methods
Mark scheme, including level descriptors and indicative content
Notes from the mark scheme and report
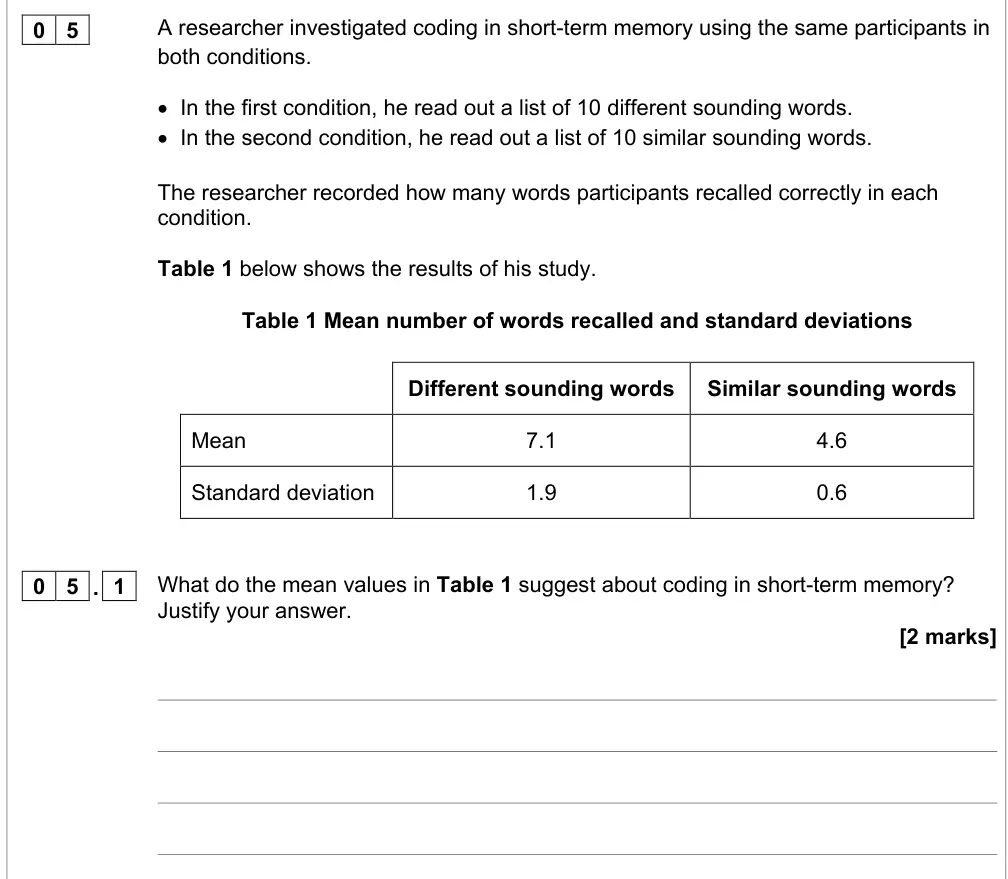
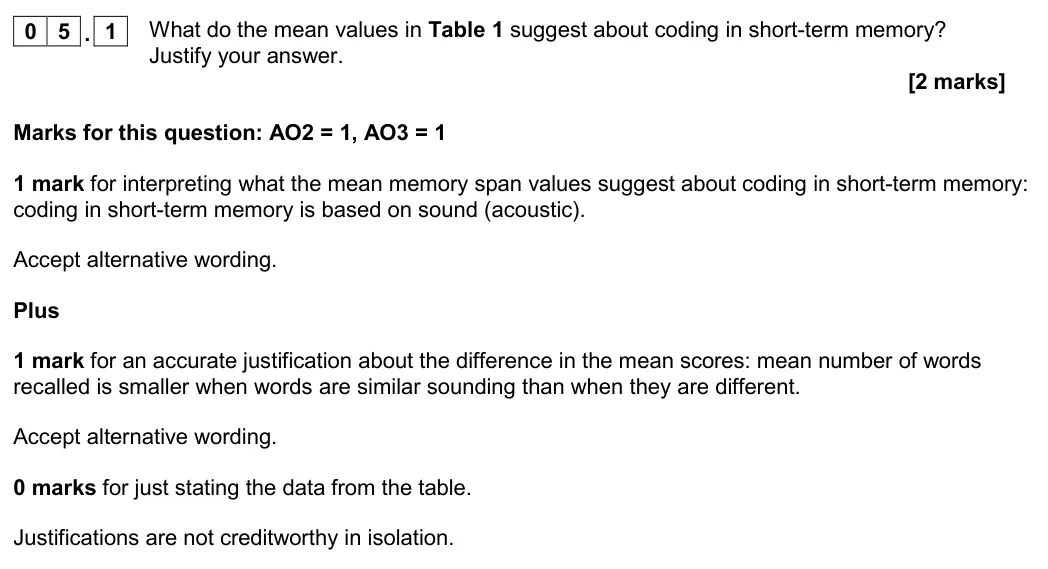
STM coding is acoustic + justification from lower mean for similar-sounding words
stating data alone = 0
justification not creditworthy in isolation
November 2020 · AS Paper 1 · Q5.22 marksAO2=1, AO3=1Research methods
Mark scheme, including level descriptors and indicative content
Notes from the mark scheme and report
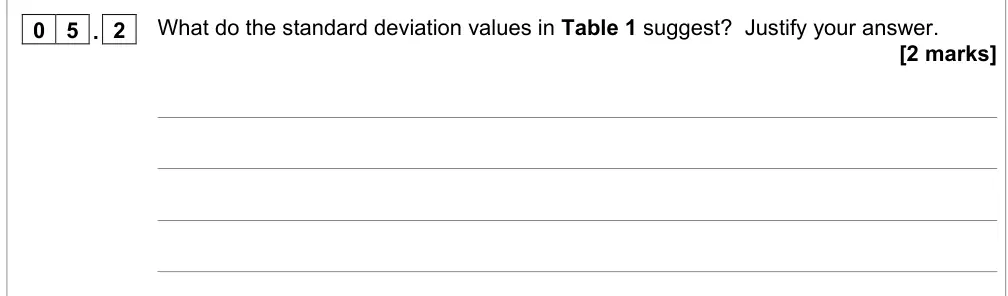
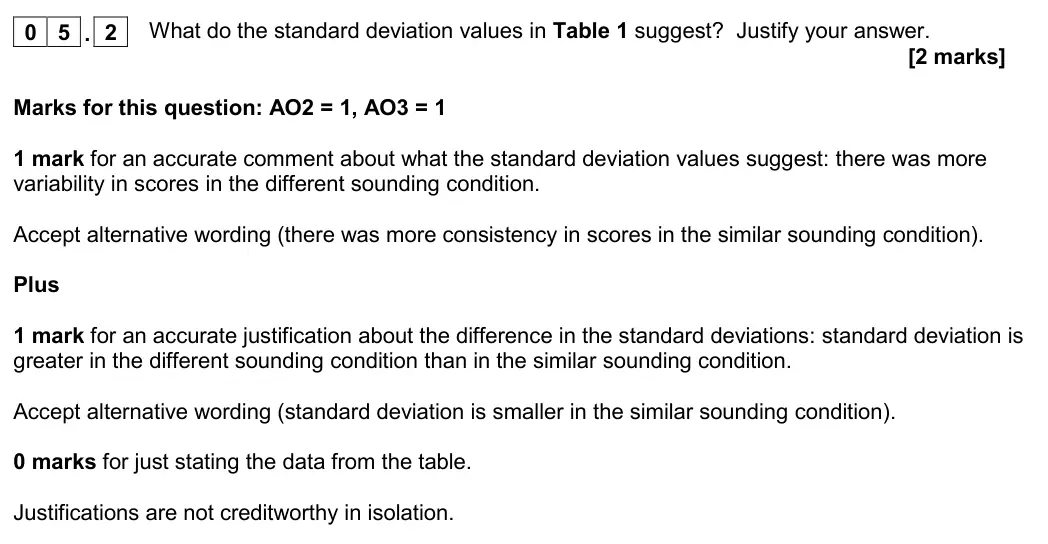
more variability in different-sounding condition + justification (SD 1.9 > 0.6)
stating data alone = 0
justification not creditworthy in isolation
November 2020 · Paper 1 · Q73 marksAO3=3Research methods
Mark scheme, including level descriptors and indicative content
Examiner's comment
This question was not done well. There were many incorrect answers, and even some of the correct responses failed to explain why the median should be used. Overall, students were not prepared for this research methods question. At the lower end there were indications of lack of preparation and coverage of the Specification (e.g. Q13), while research methods questions were on the whole not done well (e.g. 03, 07).
Notes from the mark scheme and report
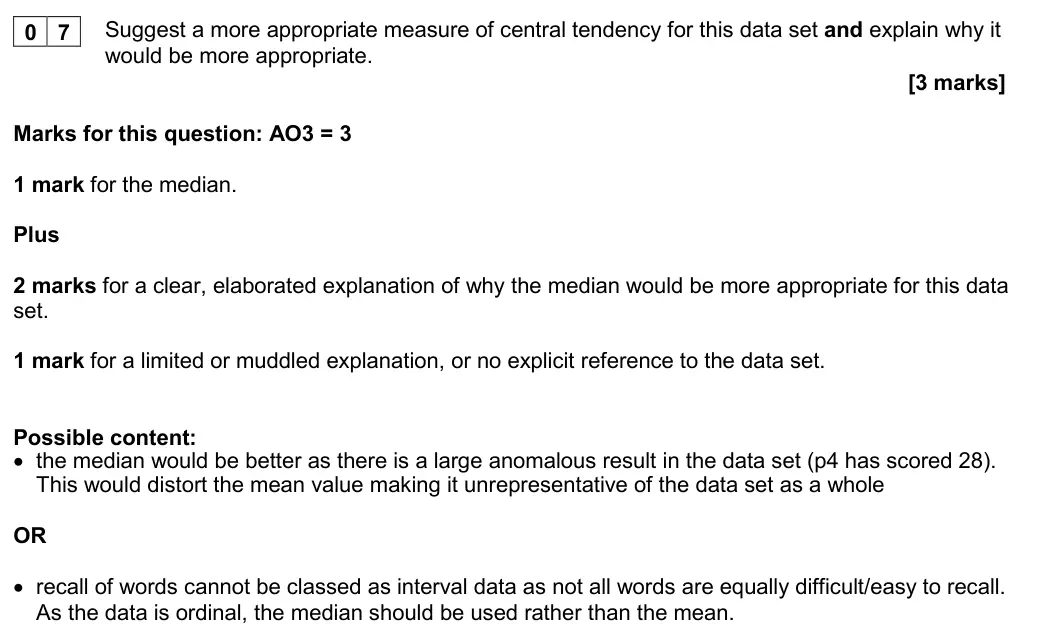
median + explanation with reference to the data: outlier (participant 4 = 28) distorts the mean, or recall data is ordinal
no reference to the data = max 1 for explanation
done poorly
November 2020 · Paper 2 · Q131 markAO2=1Multiple choice
Answer
A
Mark scheme, including level descriptors and indicative content
Examiner's comment
Most students were able to identify the correct correlation coefficient and reassuringly the most common incorrect response was B, suggesting that students were generally able to identify a negative correlation.
Notes from the mark scheme and report
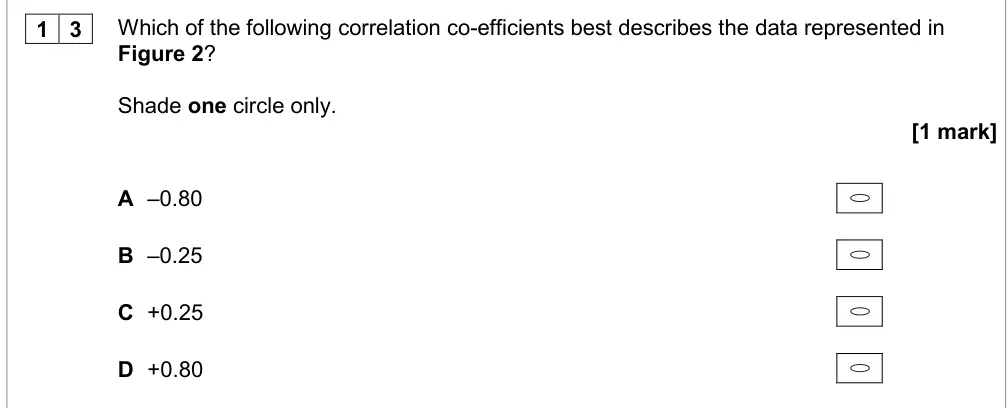
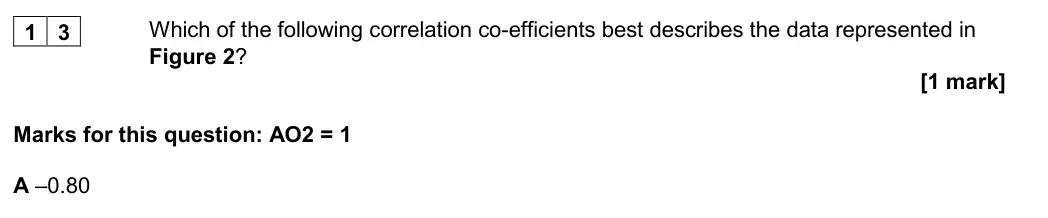
correct answer A (-0.80) read from the scattergram
most common wrong answer B
November 2020 · Paper 2 · Q143 marksAO2=3Research methods
Mark scheme, including level descriptors and indicative content
Examiner's comment
Most students were able to identify the graph as being a scattergram and were able to give a limited explanation of why this would be appropriate but fewer managed to provide an explanation that referred to the actual data collected.
Notes from the mark scheme and report
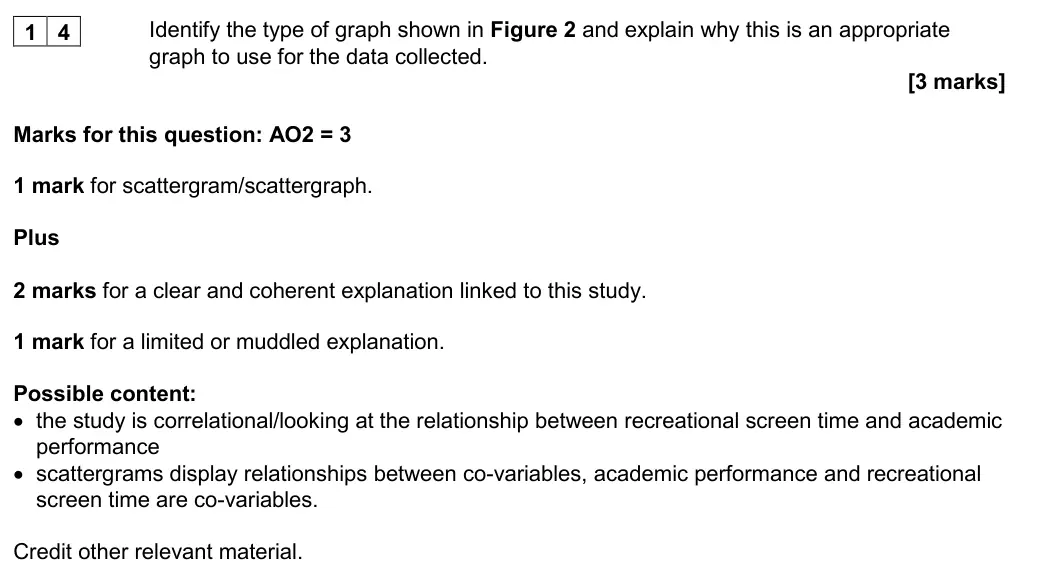
scattergram (1) + explanation linked to this study: correlational study of co-variables screen time and academic performance
few referred to the actual data
November 2020 · AS Paper 2 · Q154 marksAO2=2, AO3=2Research methods
Mark scheme, including level descriptors and indicative content
Notes from the mark scheme and report
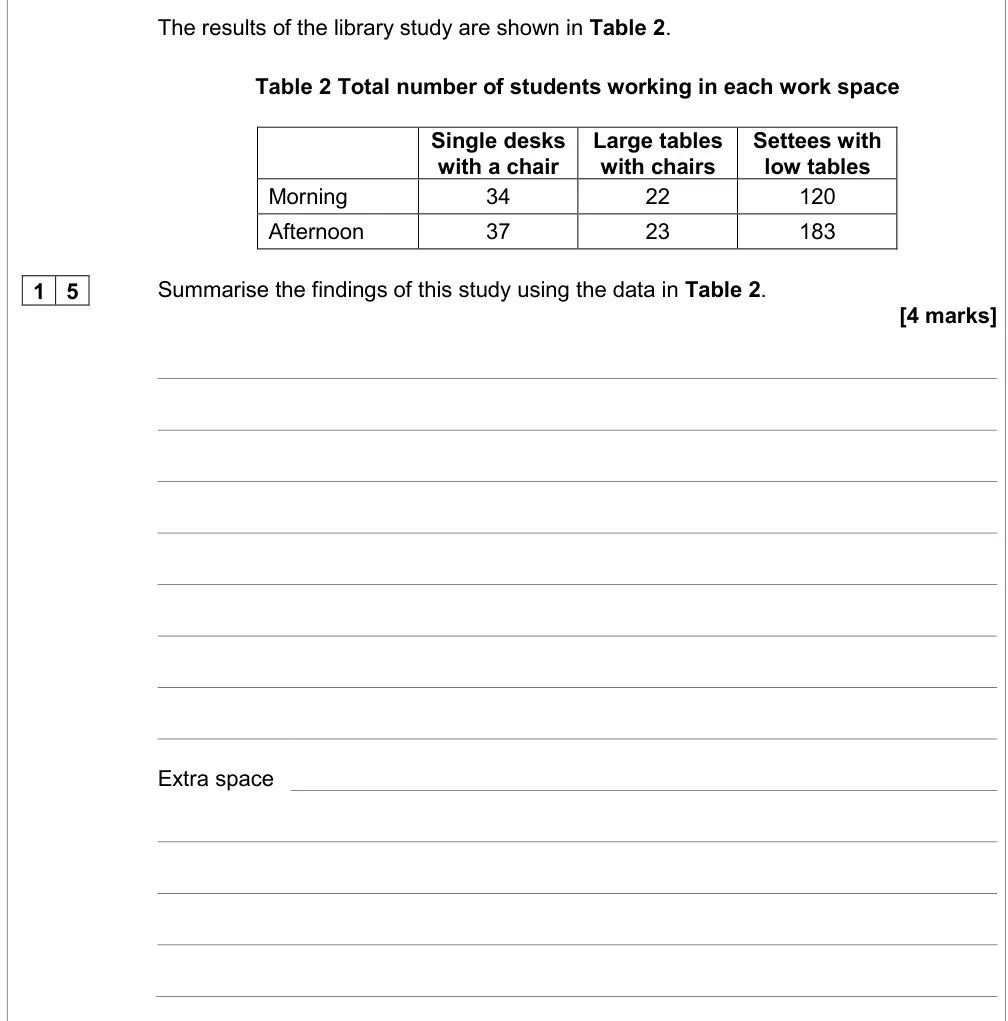
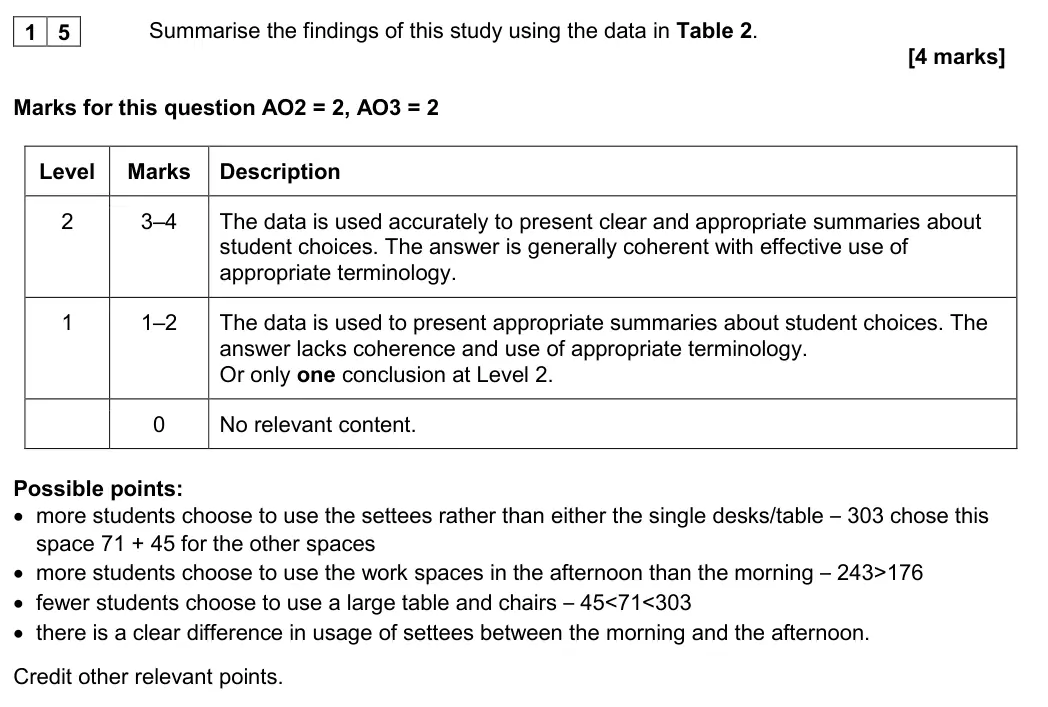
e.g. settees most popular (303 vs 71 vs 45), more use in afternoon (243 > 176), large tables least used, settee use rises most in afternoon
only one conclusion = Level 1
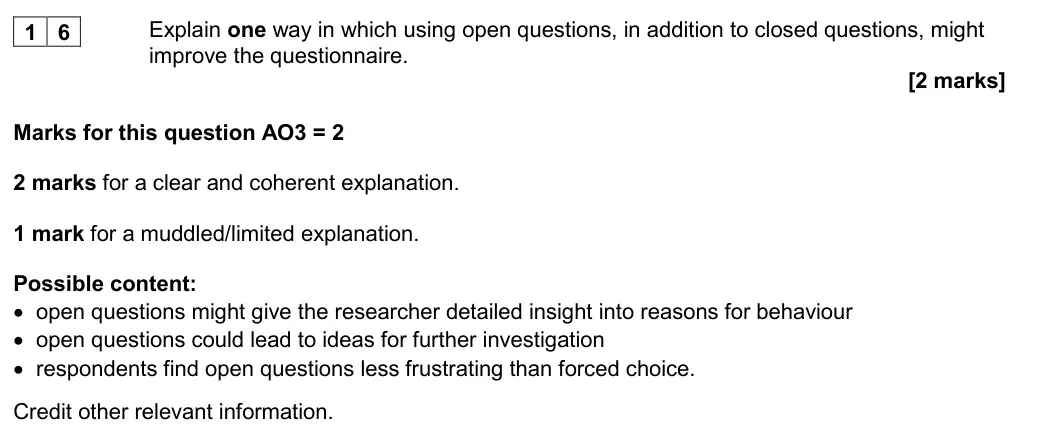
November 2020 · AS Paper 2 · Q162 marksAO3=2Research methods
Mark scheme, including level descriptors and indicative content
Notes from the mark scheme and report
open questions give detailed insight into reasons, ideas for further research, less frustrating than forced choice
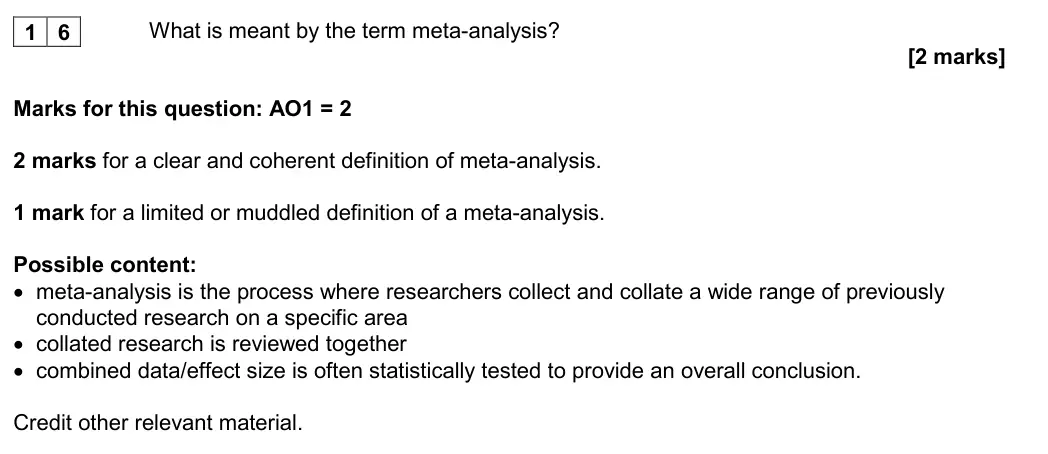
November 2020 · Paper 2 · Q162 marksAO1=2Research methods
Mark scheme, including level descriptors and indicative content
Examiner's comment
Most students seemed to have an idea of what a meta-analysis is but many struggled to clearly explain what the term meant with lots just giving examples of meta-analysis studies. Good answers made it clear that a range of previous studies on a specific topic were analysed together to draw overall conclusions.
Notes from the mark scheme and report
collating and analysing a range of previous studies on one area together to reach an overall conclusion/effect size
many only gave examples of meta-analyses
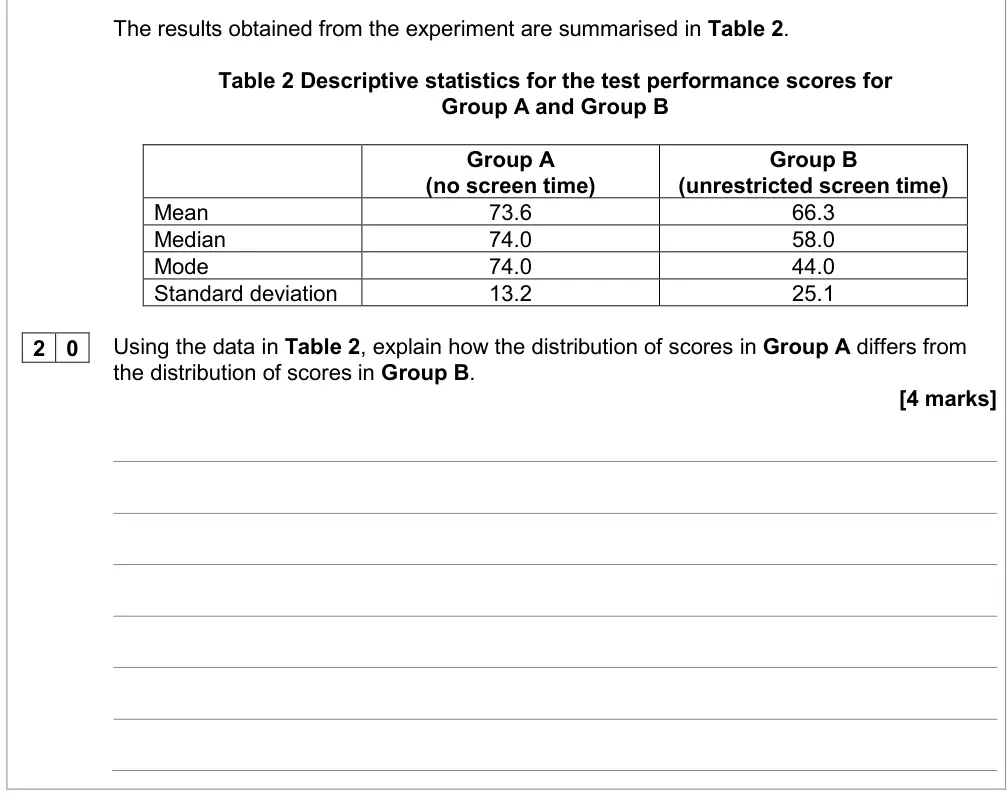
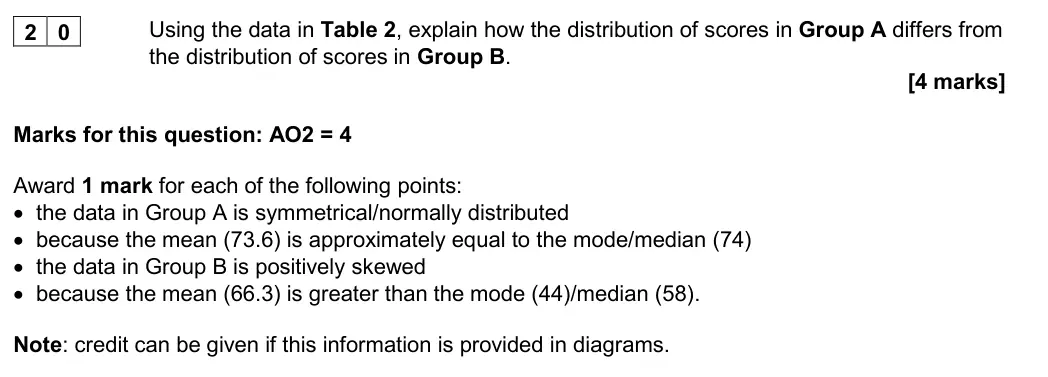
November 2020 · Paper 2 · Q204 marksAO2=4Research methodsMedium
Mark scheme, including level descriptors and indicative content
Examiner's comment
This question really challenged students and revealed a common gap in students’ knowledge/understanding. The vast majority compared the mean and standard deviation values (despite this being asked in question 21) with no reference to distributions. Of those students who did recognise normal and skewed distributions, there was some confusion between positive and negative skews. Very few students managed to achieve full marks for this question.
Notes from the mark scheme and report
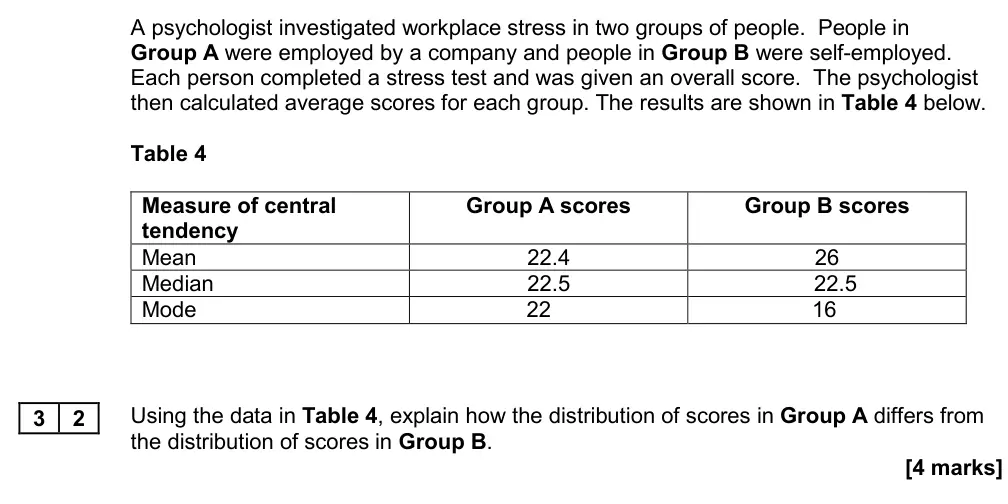
Group A roughly normal/symmetrical (mean ~ median/mode 74)
Group B positively skewed (mean 66.3 > median 58 > mode 44), 1 mark each
most compared mean and SD instead
confusion of positive and negative skew
very few full marks
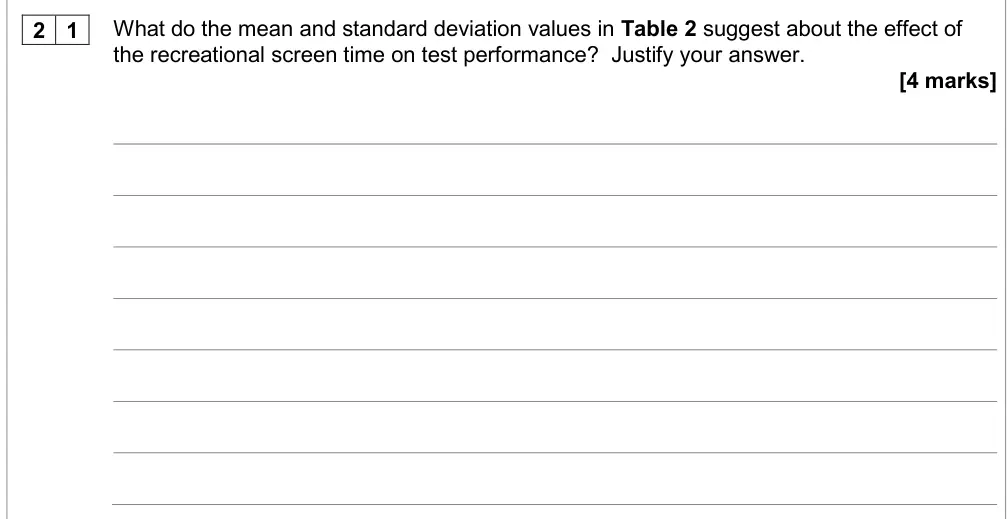
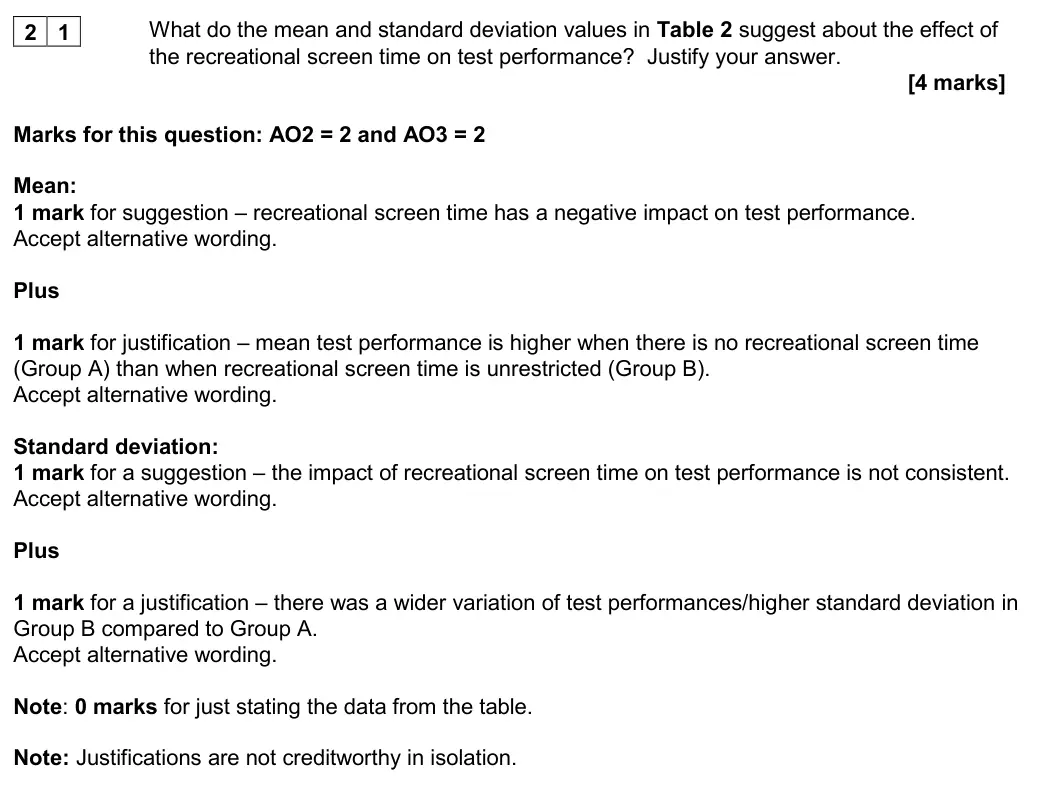
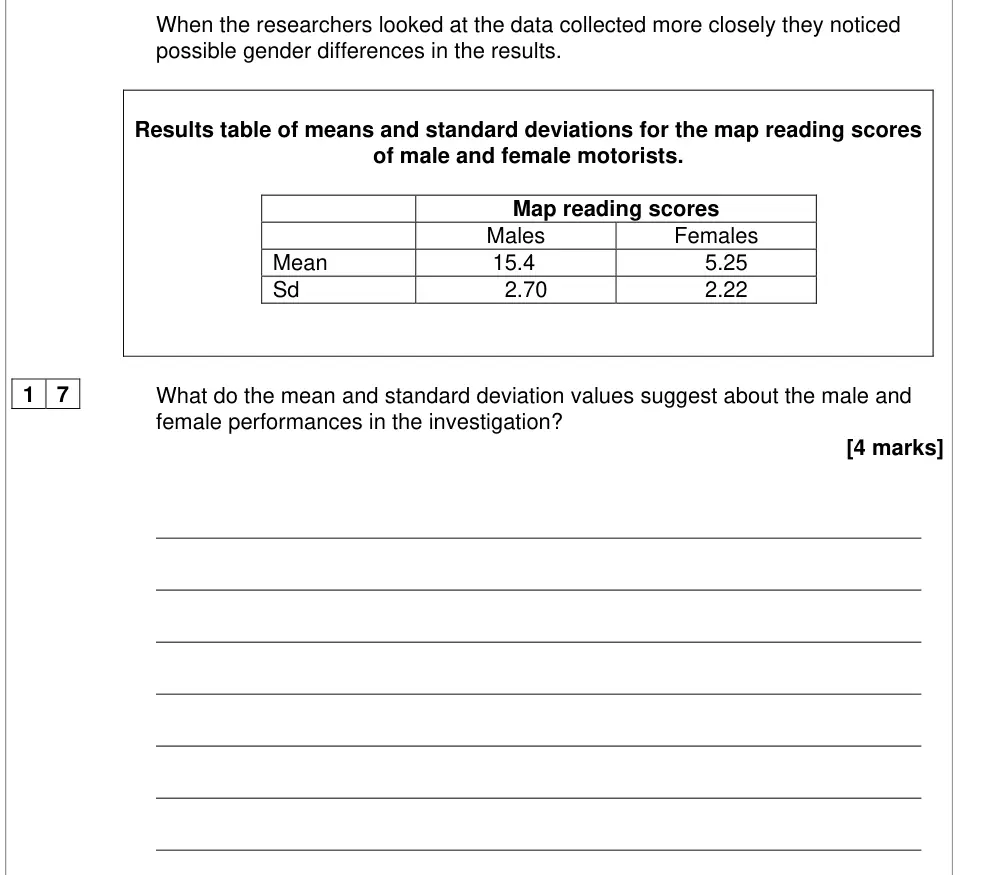
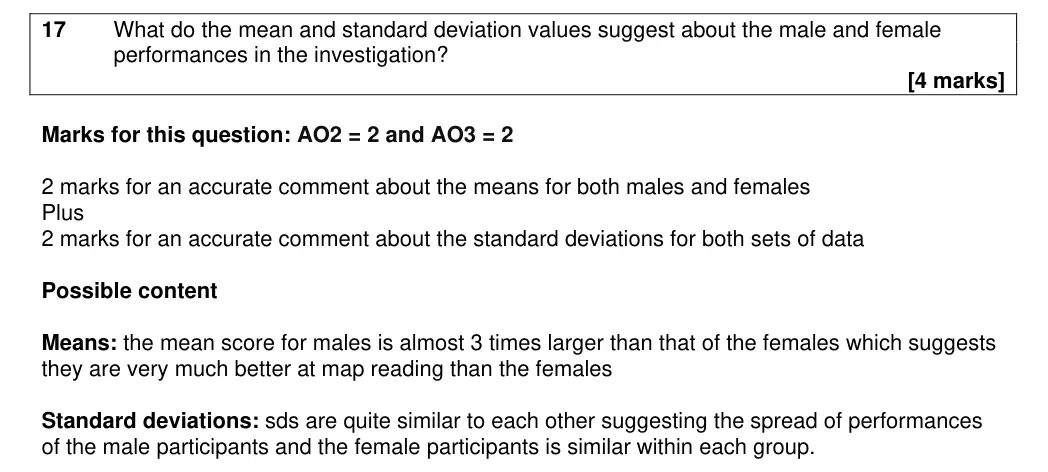
November 2020 · Paper 2 · Q214 marksAO2=2, AO3=2Research methods
Mark scheme, including level descriptors and indicative content
Examiner's comment
Most students were able to offer an anwer about what the data suggested about the effects of screen time on test performance although some still failed to justify their responses with a comparison. Despite this type of question being commonly asked on exam papers, a surprising number of students merely described/stated the data or focussed only on the mean or standard deviation, providing only a partial answer.
Notes from the mark scheme and report
mean: screen time lowers performance + comparison
SD: effect inconsistent + Group B more varied
stating data alone = 0
justifications not creditworthy in isolation
many covered only mean or only SD
November 2020 · Paper 2 · Q227 marksAO2=7Research methods
Mark scheme, including level descriptors and indicative content
Examiner's comment
Sadly, a large number of students did not attempt this question which was costly given the number of marks available. Those who answered the question achieved their marks for identifying the appropriate statistical test and explaining why the test would be appropriate but struggled to do so in the context of the study. It was good to see that some students were able to clearly and accurately contextualise their reasons and achieve full marks but this is a skill that teachers are advised to encourage students to practise, (justifying their choice of statistical test in context).
Notes from the mark scheme and report
Mann-Whitney (or unrelated t-test if data type justified) + three contextualised reasons (difference, independent groups, ordinal/skewed data) 2 marks each
only first three reasons marked
many did not attempt
reasons rarely contextualised
November 2020 · Paper 3 · Q65 marksAO3=5Research methods
Mark scheme, including level descriptors and indicative content
Examiner's comment
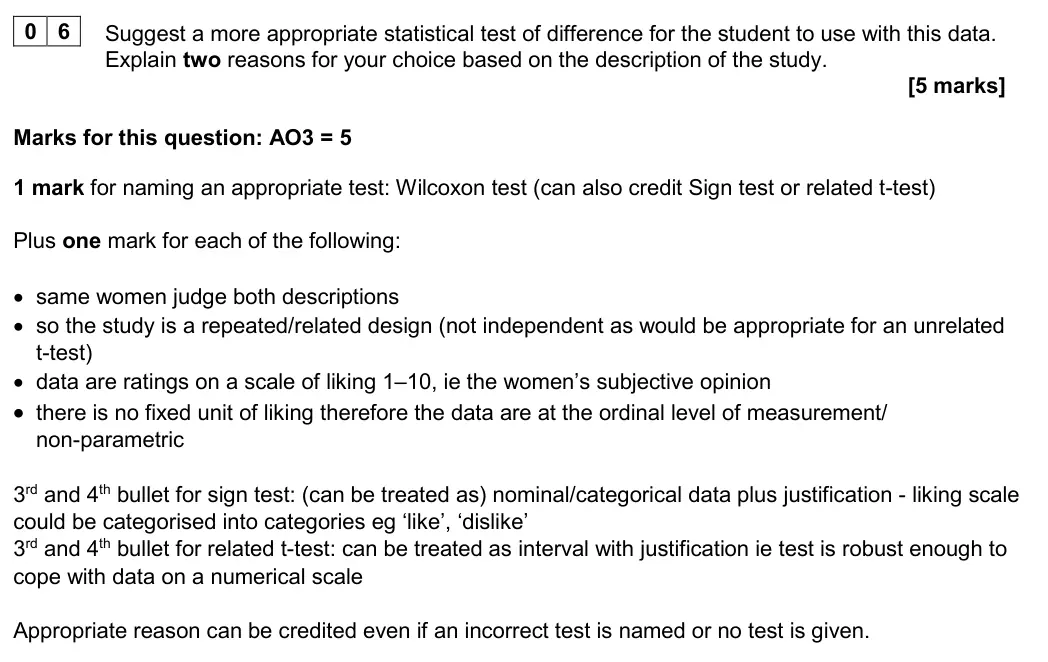
Most answers to the questions on statistical testing showed some relevant knowledge and understanding. Where an incorrect test was given students could still get some credit for relevant reasoning based on the scenario. Alternatives to the Wilcoxon test were credited (Sign and related-t) as these could have been made appropriate here, but once these had been credited any accompanying reasoning had to be consistent with the test given.
Notes from the mark scheme and report
1 mark test (Wilcoxon
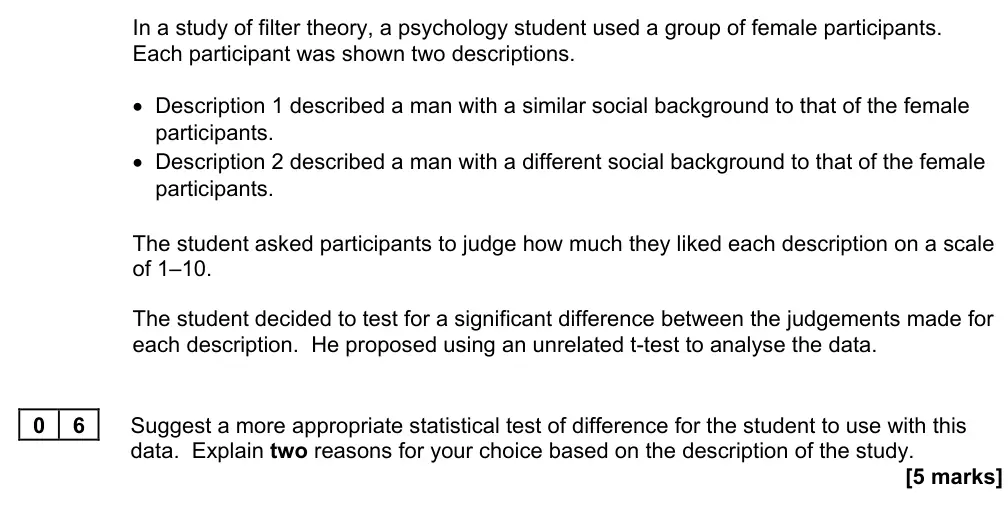
also sign test or related t-test) + reasons: same women judge both = repeated/related design
1-10 liking ratings subjective = ordinal
reasons creditable even if wrong test named
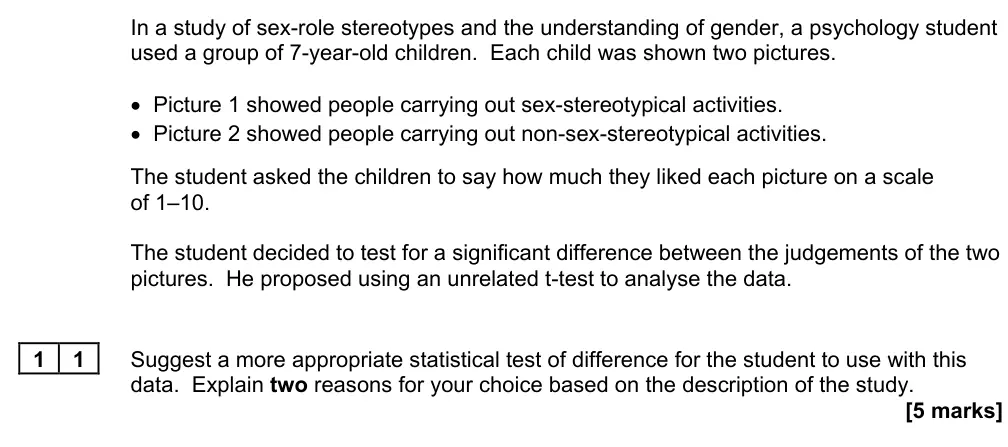
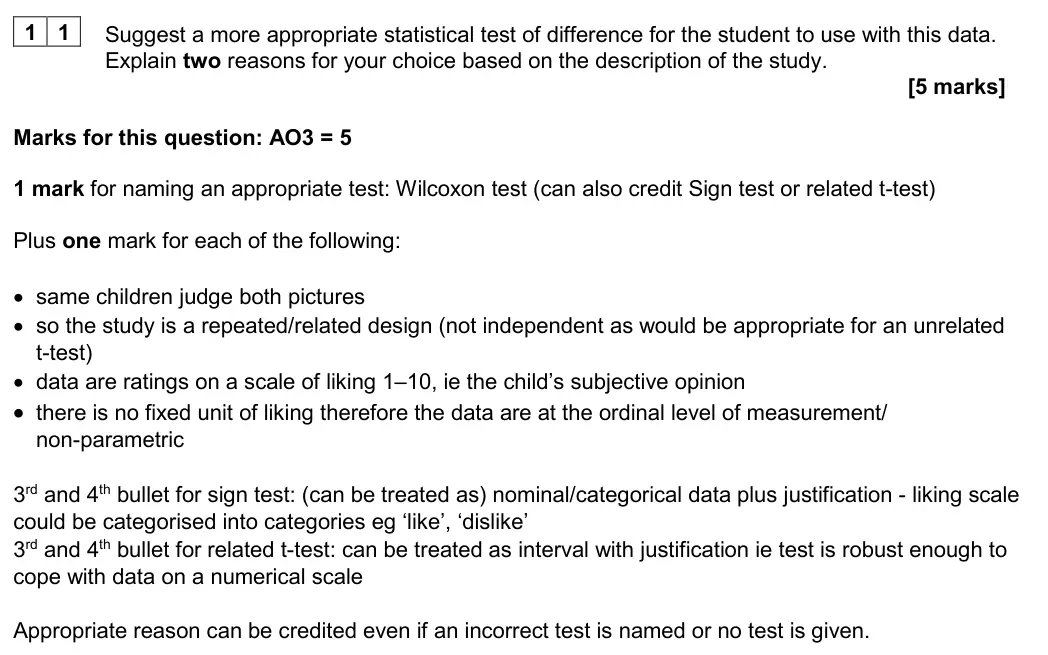
November 2020 · Paper 3 · Q115 marksAO3=5Research methods
Mark scheme, including level descriptors and indicative content
Examiner's comment
Most answers to the questions on statistical testing showed some relevant knowledge and understanding. Where an incorrect test was given students could still get some credit for relevant reasoning based on the scenario. Alternatives to the Wilcoxon test were credited (Sign and related-t) as these could have been made appropriate here, but once these had been credited any accompanying reasoning had to be consistent with the test given.
Notes from the mark scheme and report
stem is about sex-role stereotypes (removed in v1.4) but marks need only test choice
Wilcoxon (or sign/related t) + same children = related design + ratings = ordinal
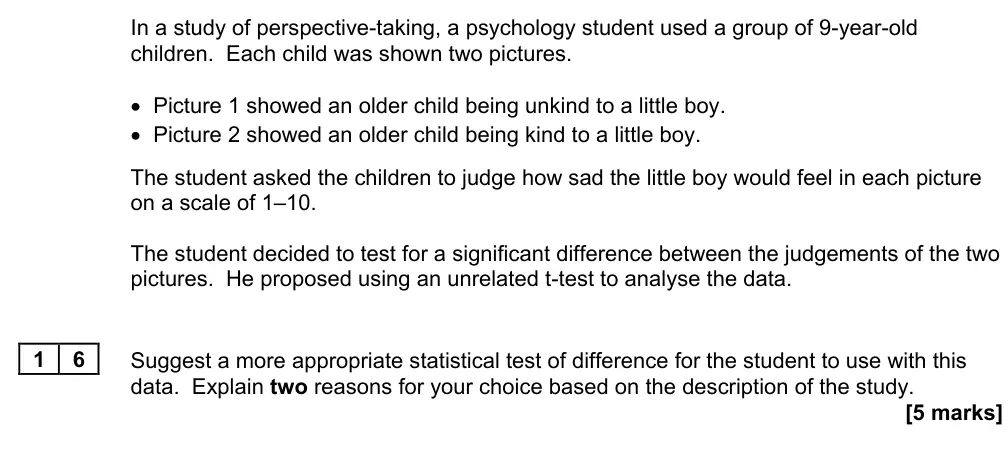
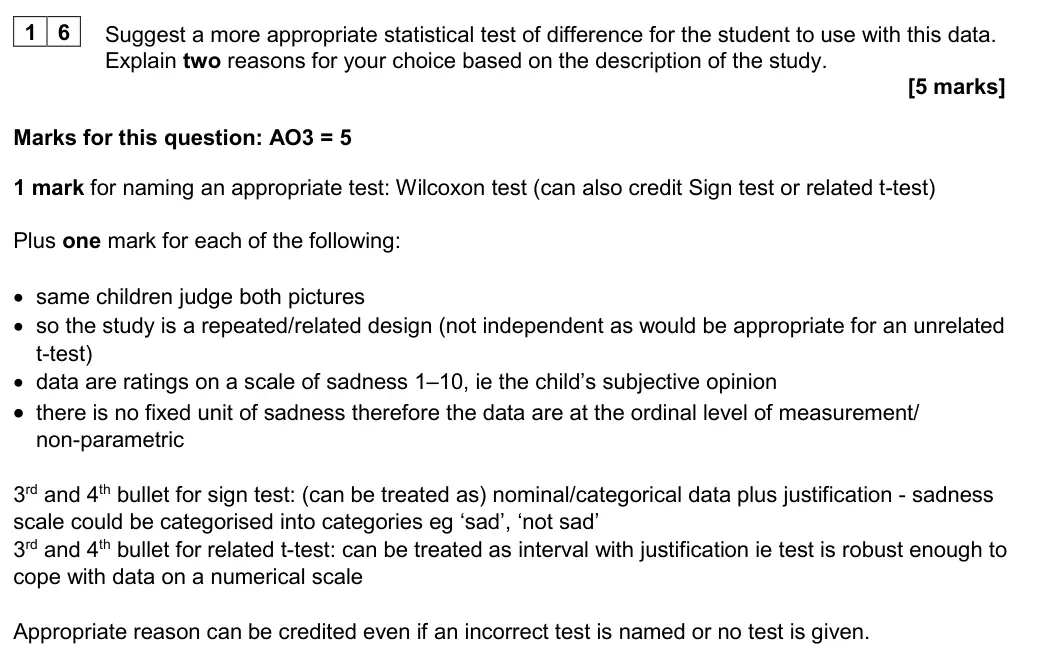
November 2020 · Paper 3 · Q165 marksAO3=5Research methods
Mark scheme, including level descriptors and indicative content
Examiner's comment
Most answers to the questions on statistical testing showed some relevant knowledge and understanding. Where an incorrect test was given students could still get some credit for relevant reasoning based on the scenario. Alternatives to the Wilcoxon test were credited (Sign and related-t) as these could have been made appropriate here, but once these had been credited any accompanying reasoning had to be consistent with the test given.
Notes from the mark scheme and report
Wilcoxon (or sign/related t) + same children judge both = related design + sadness ratings = ordinal
reasons creditable even if wrong test named
June 2019 · Paper 1 · Q22 marksAO2=2Calculation
Mark scheme, including level descriptors and indicative content
Examiner's comment
Again this was answered well by many students, though a number did not present the ratio in its simplest form and failed to gain a mark. A minority had the ratio the wrong way round and did not receive credit.
Notes from the mark scheme and report
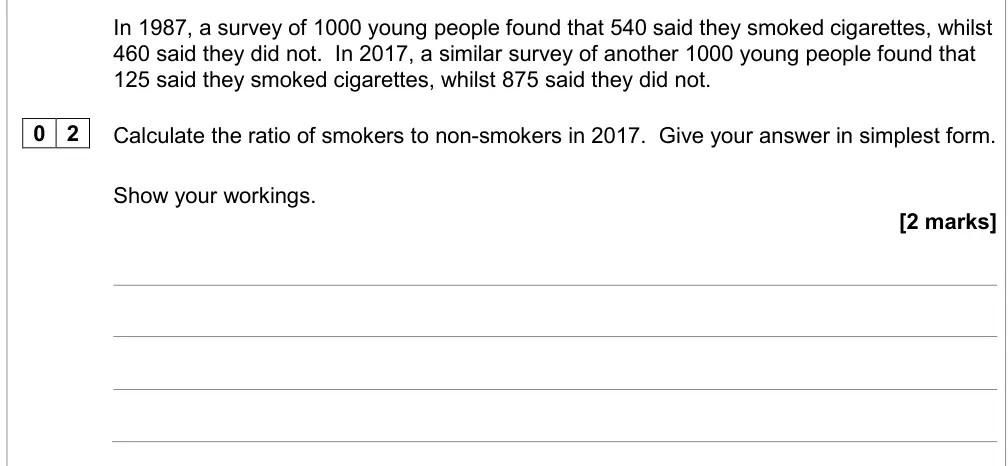
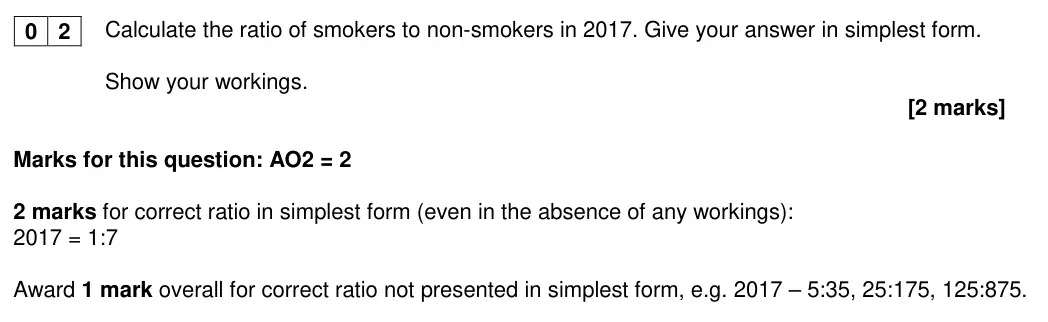
125:875 = 1:7
unsimplified ratio = 1 mark
reversed ratio = 0
June 2019 · Paper 1 · Q34 marksAO2=4Research methods
Mark scheme, including level descriptors and indicative content
Examiner's comment
Exceptions were question 3, where a significant minority of answers demonstrated a lack of understanding of statistics and experimental design, and question 10, on economic implications of research into the role of fathers in attachment. To achieve full marks students had to identify the chi square test as a test of difference for nominal/categorical data using an independent/unrelated design. As marks were awarded for identifying the reasons correctly even if the wrong test was named, most students did reasonably well on this question. However, a significant minority did poorly, referring for example to correlations, interval data, related design, sign test or t-test etc, reflecting a weak understanding of statistics and experimental design.
Notes from the mark scheme and report
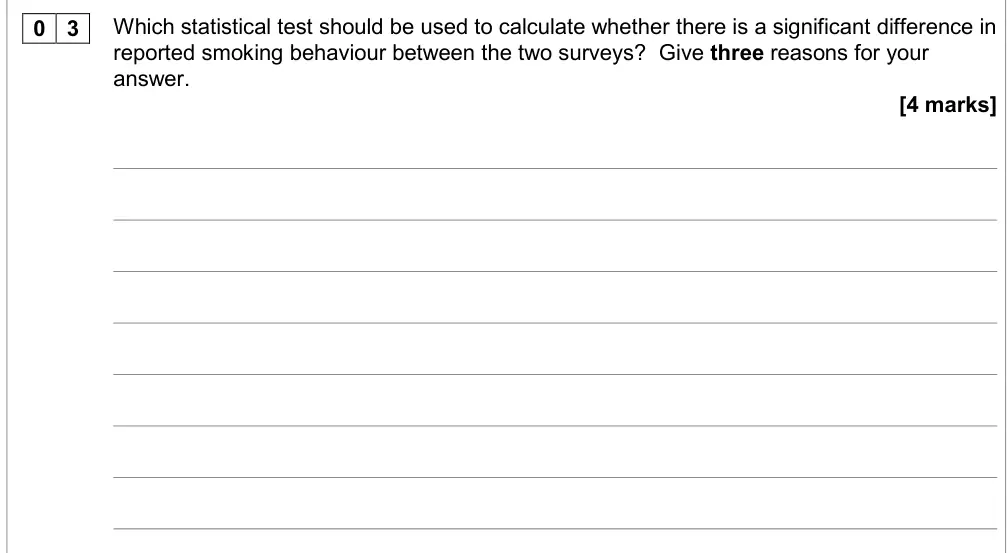
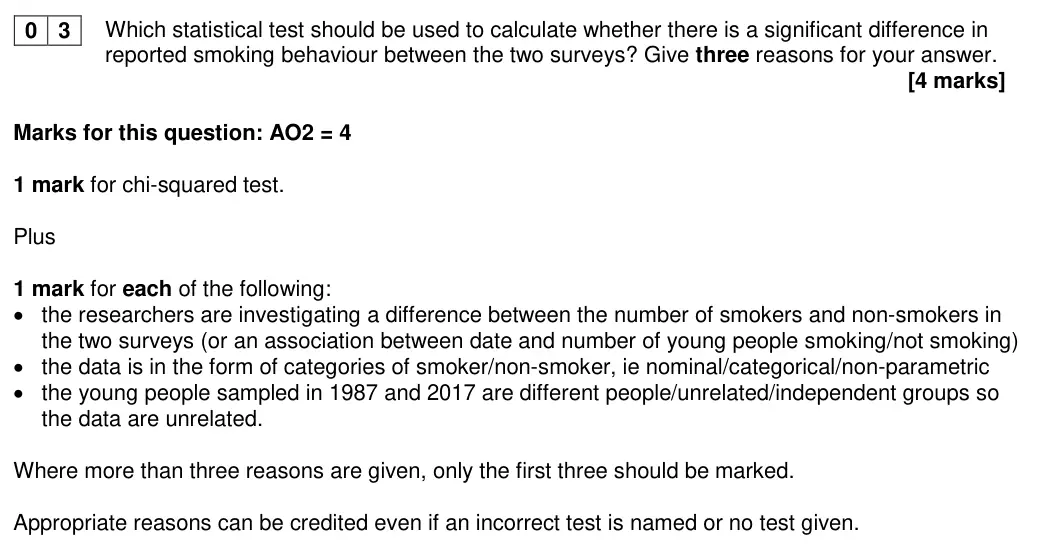
chi-squared + test of difference/association, nominal data (smoker/non-smoker), independent groups
reasons credited even if wrong test named
first three reasons only
June 2019 · AS Paper 1 · Q4.31 markAO2=1Multiple choiceEasy
Answer
B
Mark scheme, including level descriptors and indicative content
Examiner's comment
Questions 04.3 and 04.4 The majority of students answered both questions accurately.
Notes from the mark scheme and report
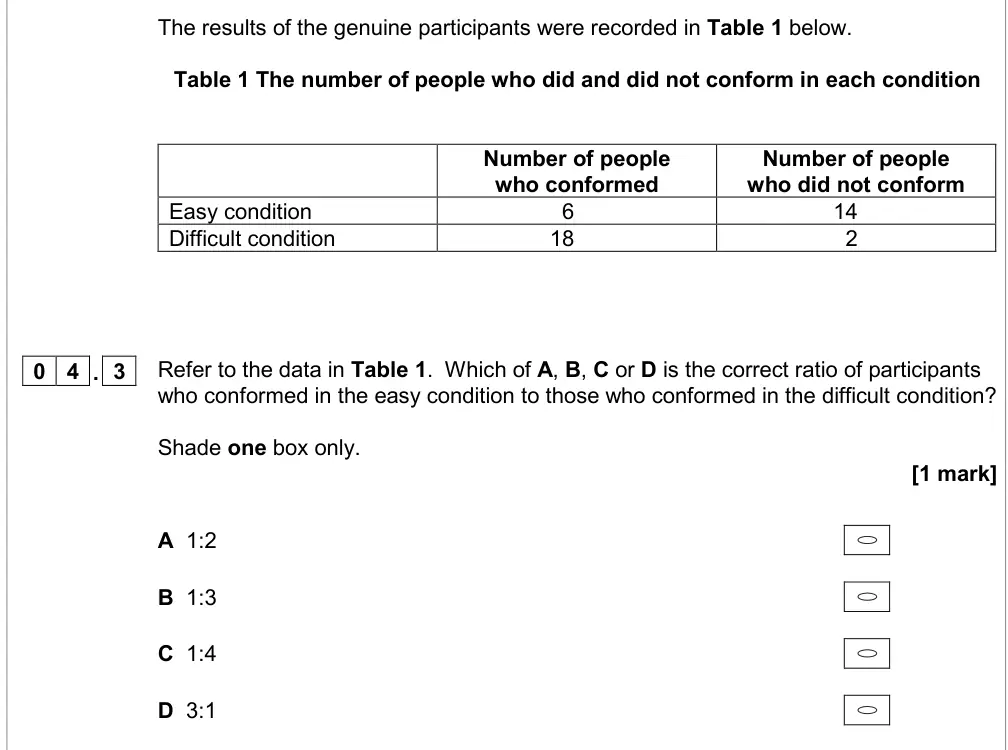
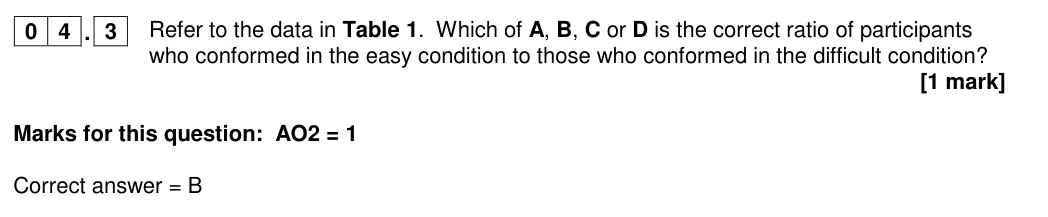
correct B (6:18 = 1:3)
June 2019 · AS Paper 1 · Q4.41 markAO2=1Multiple choiceEasy
Answer
C
Mark scheme, including level descriptors and indicative content
Examiner's comment
Questions 04.3 and 04.4 The majority of students answered both questions accurately.
Notes from the mark scheme and report
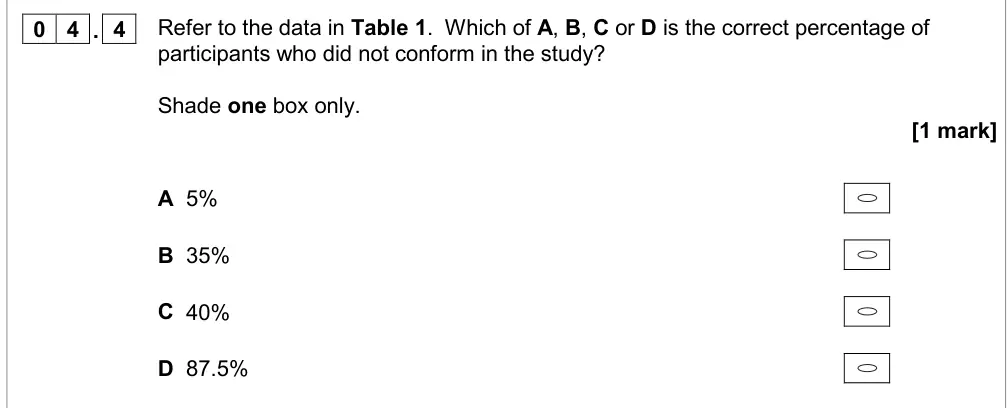
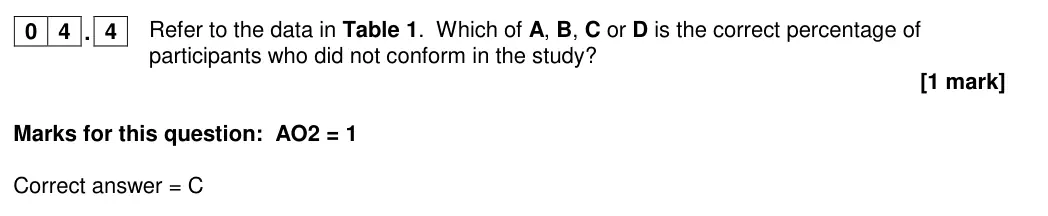
correct C (16/40 = 40%)
June 2019 · AS Paper 1 · Q5.33 marksAO2=3CalculationEasy
Mark scheme, including level descriptors and indicative content
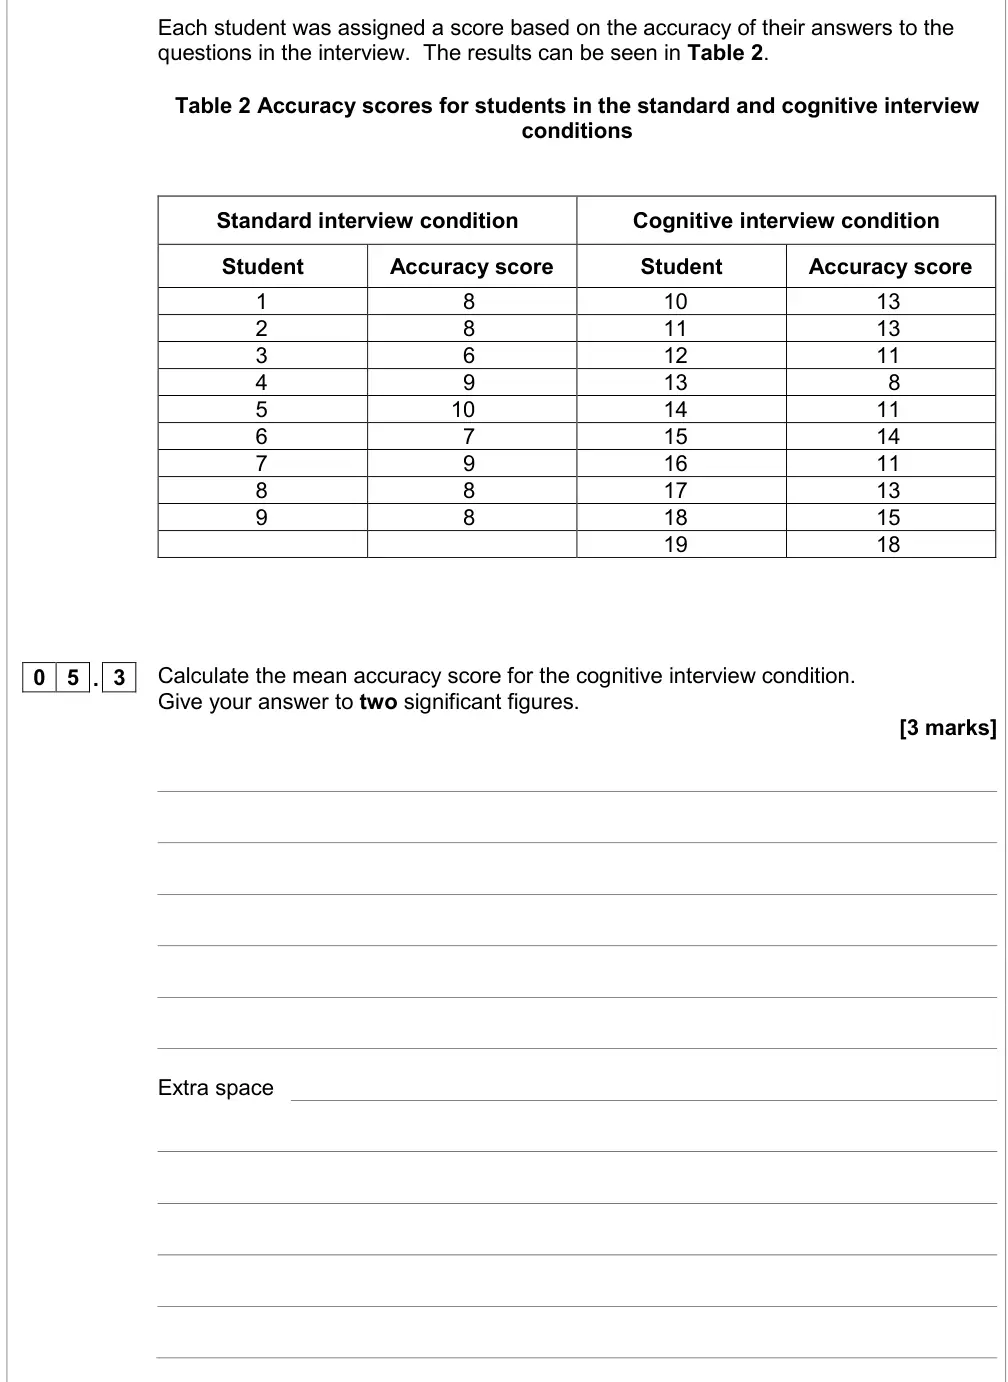
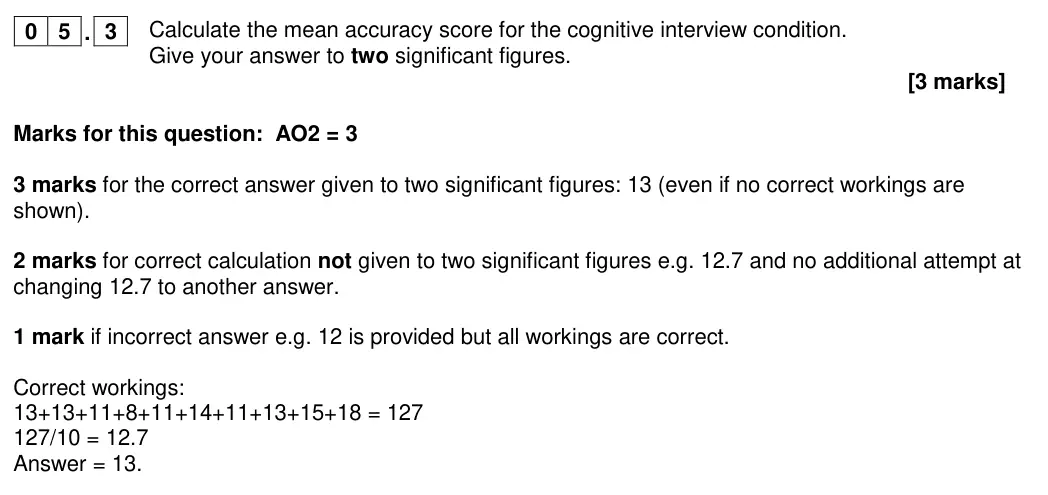
Examiner's comment
Question 05.3 Although the majority of students achieved full marks on this question, a number made one of several common errors. Some students miscalculated the mean, with a few dividing their total by 9 instead of 10. Some students did not attempt to round their answer. Some misunderstood two significant figures and gave their answer to two decimal places.
Notes from the mark scheme and report
127/10 = 12.7 = 13 (2 s.f.)
12.7 = 2 marks
dividing by 9, decimal places instead of significant figures
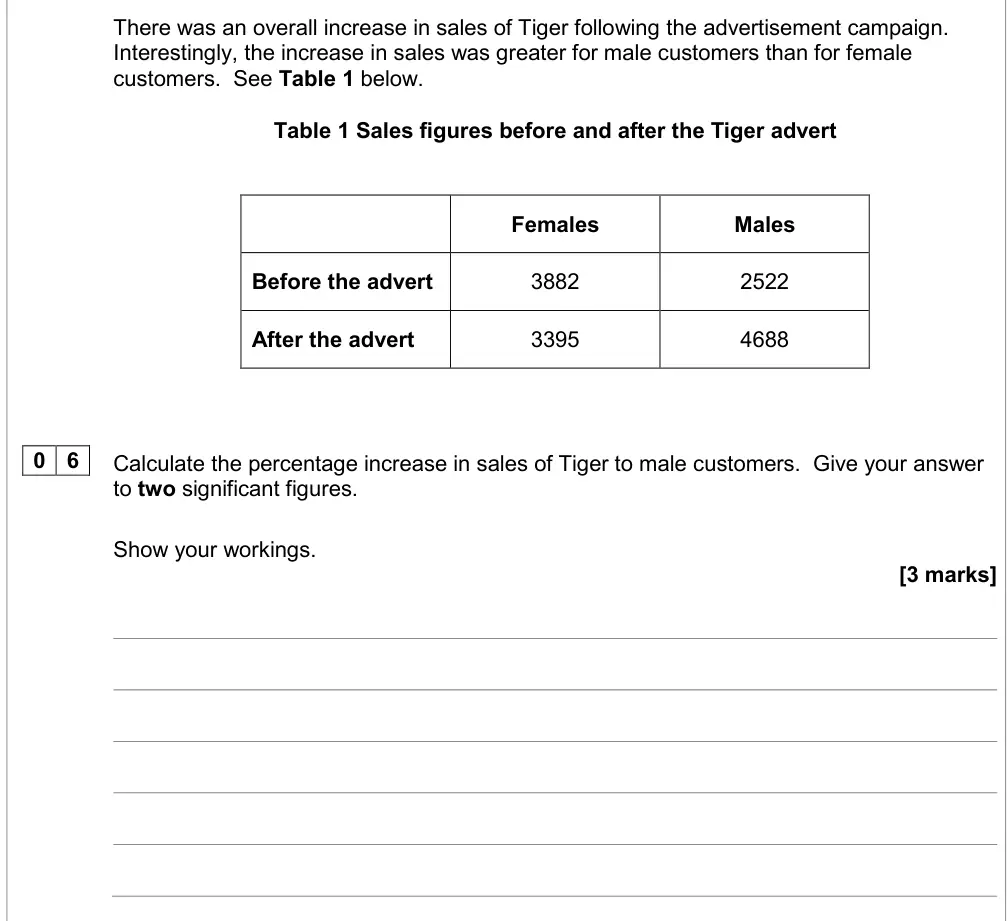
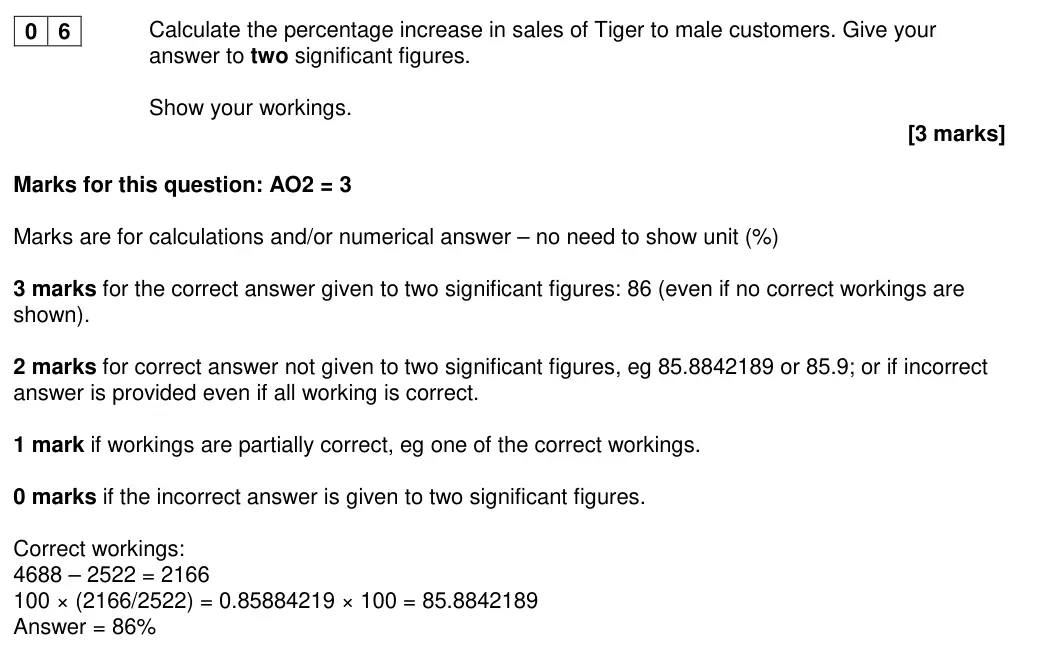
June 2019 · Paper 2 · Q63 marksAO2=3Calculation
Mark scheme, including level descriptors and indicative content
Examiner's comment
This question differentiated well with marks distributed across the range. The responses to the question suggested that overall many students are unable to give an answer to 2 significant figures. Many students confused significant figures with decimal places and there were numerous rounding errors. It was encouraging to see most students providing their working, as many gained credit for partial working out despite giving an incorrect final answer.
Notes from the mark scheme and report
answer 86 (3 marks only if given to 2 s.f.)
85.9 etc = 2 marks
incorrect answer to 2 s.f. = 0
many confused significant figures with decimal places
June 2019 · AS Paper 2 · Q104 marksAO2=4Research methods
Mark scheme, including level descriptors and indicative content
Examiner's comment
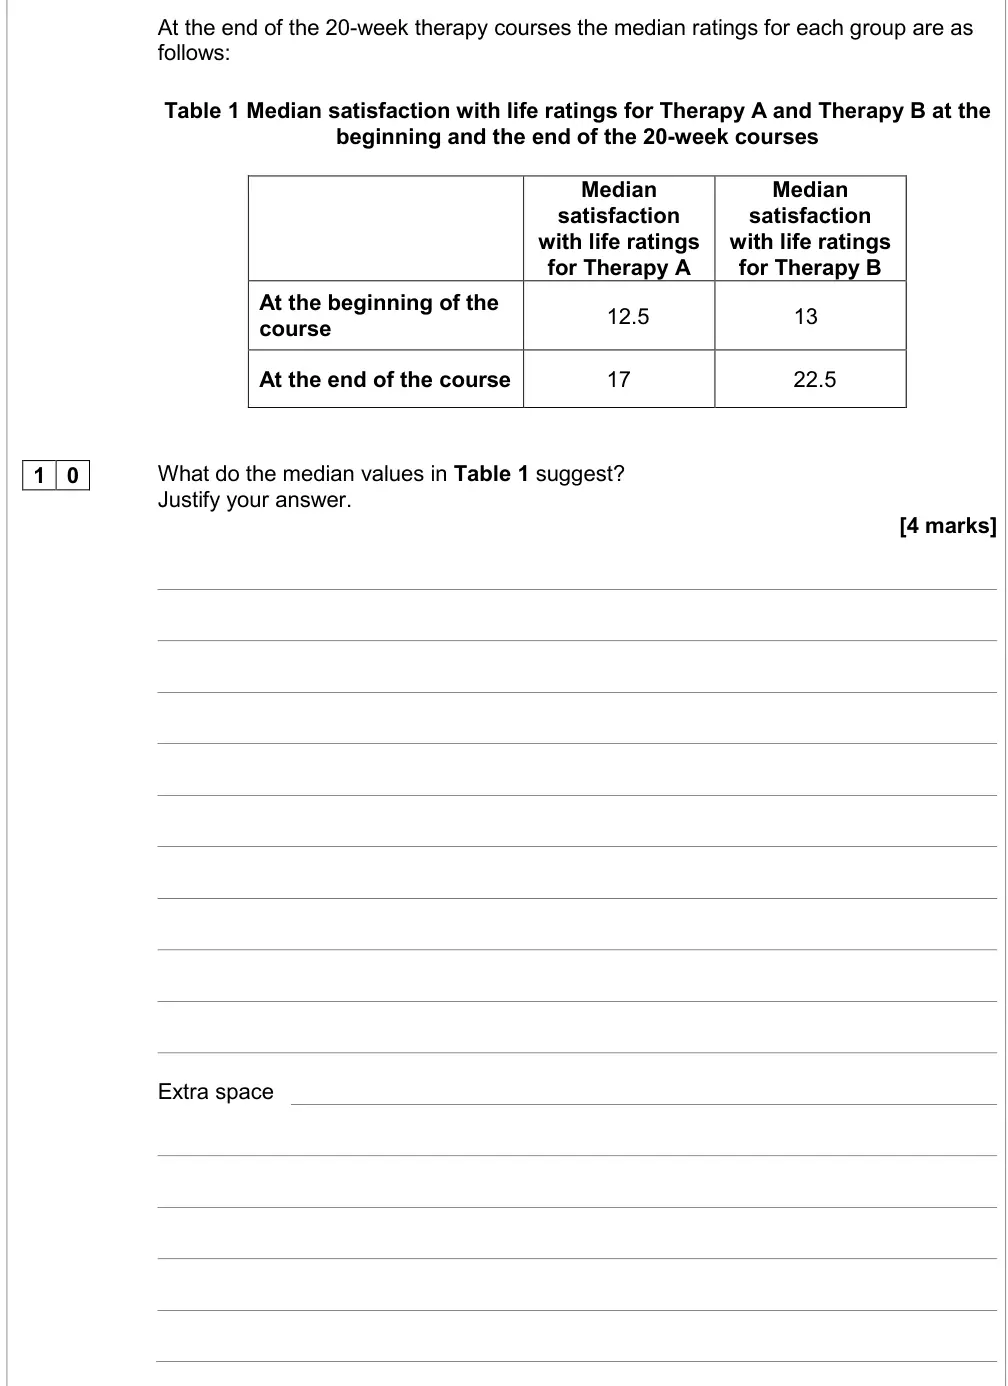
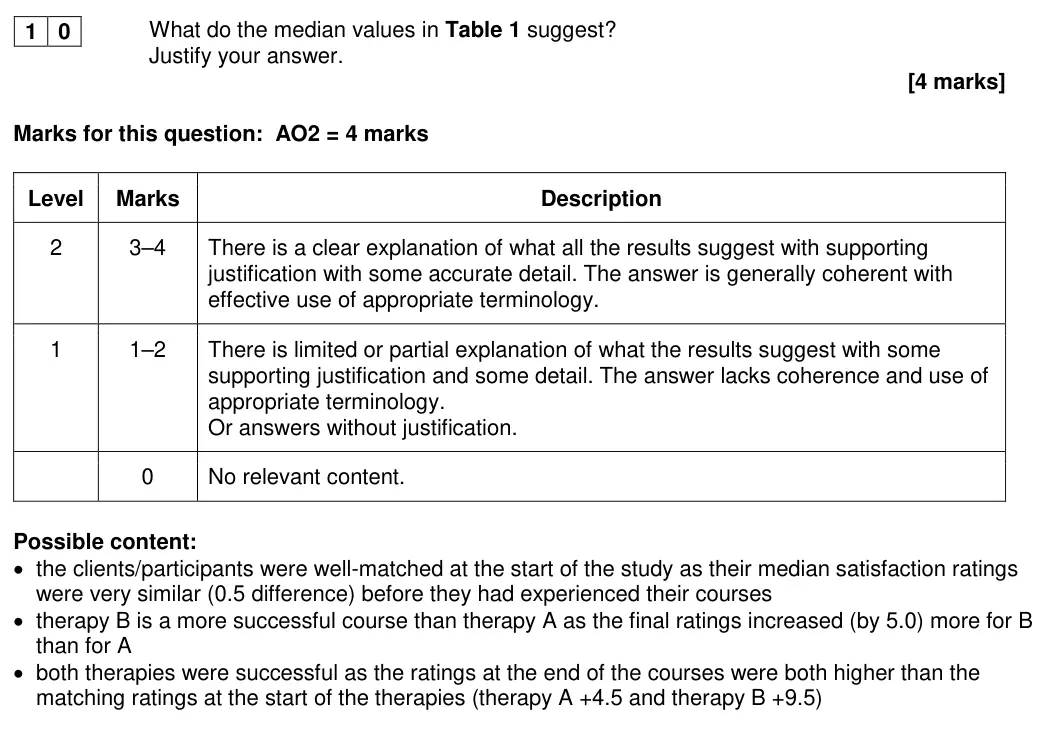
This question was attempted by most students, but many responses focused solely on the scores after therapy rather than all four scores or the improvement in scores. This meant that many responses only had a limited explanation of what the results suggested with only partial justification. Few students mentioned that both therapies were successful, and fewer still mentioned that the median scores at the beginning showed how well-matched the clients were.
Notes from the mark scheme and report
well matched at start (0.5 difference), both therapies improved satisfaction (A +4.5, B +9.5), B more effective
many used only the end scores
no justification = Level 1
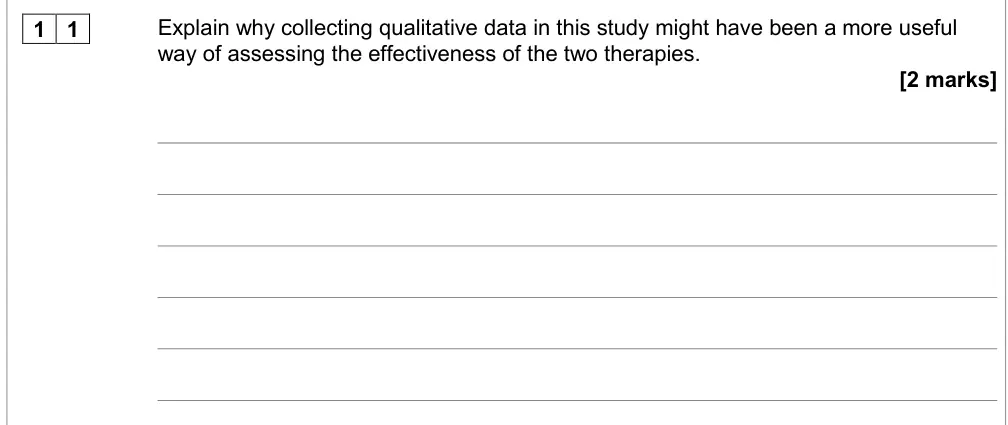
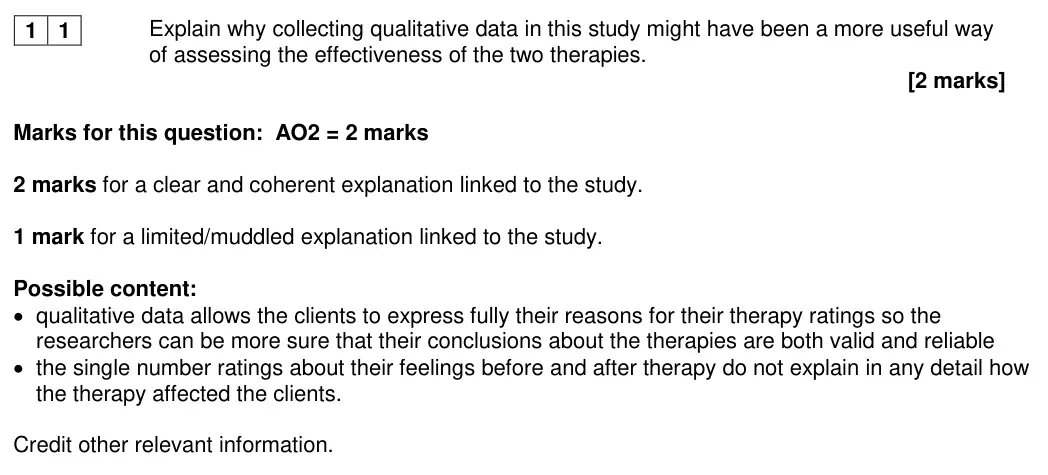
June 2019 · AS Paper 2 · Q112 marksAO2=2Research methods
Mark scheme, including level descriptors and indicative content
Examiner's comment
This question was generally well answered with many students gaining full marks. There was some confusion with quantitative and qualitative data in certain responses whilst some students failed to link their response to the study and thus were awarded no marks. It is important to remind students to read questions carefully and to apply their answers to the context of the study when this is required by the question.
Notes from the mark scheme and report
clients can explain reasons for their ratings
single number ratings give no detail on how therapy helped
unlinked to the study = 0
confusion of qualitative and quantitative
June 2019 · AS Paper 2 · Q194 marksAO2=2, AO3=2Research methods
Mark scheme, including level descriptors and indicative content
Examiner's comment
Most students were able to draw an accurate conclusion and then justify it using the mean scores and it is clear that they had a good understanding of what the mean is and what it represents. However, few students managed to do the same using the standard deviation. It is clear from student responses that many do not fully understand what a standard deviation is or what it represents. Many responses claimed that the standard deviations were different and although this might be literally true, the difference between the two is so small it would be more noteworthy to remark on the fact that they are almost identical. For the few students who did grasp this concept, only some then went on to demonstrate what this meant in terms of the spread of performance across the two conditions.
SD: similar spread in both conditions + justification
stating figures alone = 0
many said the SDs were different
June 2019 · AS Paper 2 · Q203 marksAO2=3Research methods
Mark scheme, including level descriptors and indicative content
Examiner's comment
It was clear from responses that many students appeared to have some limited understanding of the relative weaknesses of using the range. However, fewer students seemed to clearly understand the reasons why the standard deviation was more appropriate to use and thus many failed to fully answer the question posed. Many students simply stated one basic reason to use the standard deviation and thus were limited to 1 mark. There was also significant confusion with a minority of students incorrectly stating that the standard deviation was not affected by extreme scores.
Notes from the mark scheme and report
SD less distorted by the extreme score, uses every value/distance from mean, more accurate comparison
some wrongly said SD unaffected by extreme scores
June 2019 · AS Paper 2 · Q213 marksAO2=3Research methods
Mark scheme, including level descriptors and indicative content
Examiner's comment
Students generally answered this question well with most responses scoring at least 2 marks. However, only a few students achieved all 3 marks as some failed to read the question carefully and wrote a title instead of the name of the graph. Others had inaccuracies with one or both of the axis labels with many simply referring to ‘conditions’ and/or ‘number of words recalled’.
Notes from the mark scheme and report
bar chart
x = location condition (same vs different)
y = mean number of words recalled
marks independent
titles given instead of graph name
vague labels
June 2019 · Paper 2 · Q274 marksAO2=2, AO3=2Research methods
Mark scheme, including level descriptors and indicative content
Examiner's comment
This question discriminated well. Most students were able to identify a range of correct reasons but often got the name of the test incorrect. Those who chose an unrelated t-test were able to gain credit for justifying this by identifying the data as interval data, which was considered acceptable at this level. Some students suggested Chi-Square test as a suitable test but many were unable to justify why the data collected would be at a nominal level.
Notes from the mark scheme and report
Mann-Whitney: test of difference, independent groups, ordinal data (1 mark each, max first 3 reasons)
unrelated t-test accepted if justified by interval data
reasons credited even if test wrong
Chi-squared rarely justified
June 2019 · Paper 2 · Q2812 marksAO2=6, AO3=6Extended writing
Mark scheme, including level descriptors and indicative content
Examiner's comment
Responses to this question overall showed an excellent understanding of the four elements asked for, yet many students did not justify their design choices. For this type of question students need to think about why certain controls and data analysis is needed. There were some very effective answers where students gave appropriate suggestions that were well justified. Unfortunately, many responses were not practical or not sufficiently explained, with students frequently failing to give a task and merely providing generic extraneous variables and controls. Data handling and analysis was also generally poorly done, with inappropriate graphs being suggested and measures of dispersion being rarely mentioned. As in previous series, many students wasted precious time providing details such as hypothesis, ethical considerations, inferential statistics, etc. rather than focusing on the requested information in the bullet points. A number of students presented their answer with an abstract and reference sections and provided results of the study, drawing graphs, etc. which was time consuming and not creditworthy. Students should be aware that only material relating to the bullet points will be creditworthy. Whilst most students designed an experiment on the effects of group tasks on students’ happiness, some designed alternative experiments and could gain credit for these. Unfortunately, there were some experiments which were designed as a repeated measures study meaning that many of their design decisions were inappropriate.
Notes from the mark scheme and report
four elements: aim (4.2.3.1-01), IV/DV and task, controls (random allocation, standardisation), descriptive statistics/graphs with justification
all four elements needed for top band
justification often missing
time wasted on hypotheses, ethics, inferential tests, abstracts
must not repeat the Q16 sport design
MS also credits confounding variables, removed in v1.4
June 2019 · Paper 3 · Q244 marksAO2=4Calculation
Mark scheme, including level descriptors and indicative content
Examiner's comment
This was another discriminating question and one which nicely illustrates the sometimes blurred distinction between knowledge and understanding. It was evident that many students who could probably calculate and define the median became confused when required to apply their knowledge to the example. More able students often drew a diagram with 23 in the middle and numbered cases either side, concluding that 23 would be the 8th score and therefore 7 people would score less than the median. Various other ways of reaching the same conclusion were credited. One successful approach was the use of a formula to subtract the median score (1 score) from the total number of scores (15 scores) to give 14 scores which, divided by 2, would give the number of scores on either side. Many unsuccessful students attempted calculations using any or all available numbers (15, 23, 40), and lots of other numbers that were not available, to yield an impressive variety of incorrect and implausible answers. The mark scheme awarded separate credit for understanding the symbol and a good number of students managed to gain credit for this even though their answer was incorrect. Conversely, some students who got the correct answer did not get credit for the symbol because they said ‘greater’ or ‘more’. In only a handful of cases did students recognise that we could only be certain of the answer because we were told that all 15 scores were different. Several students did not attempt this question or left it until the end of the paper.
Notes from the mark scheme and report
answer 7
< means less than
all 15 scores different so median is the 8th score
separate mark for the symbol
very few noted scores all different
June 2019 · Paper 3 · Q284 marksAO2=4Calculation
Mark scheme, including level descriptors and indicative content
Examiner's comment
This was another discriminating question and one which nicely illustrates the sometimes blurred distinction between knowledge and understanding. It was evident that many students who could probably calculate and define the median became confused when required to apply their knowledge to the example. More able students often drew a diagram with 23 in the middle and numbered cases either side, concluding that 23 would be the 8th score and therefore 7 people would score less than the median. Various other ways of reaching the same conclusion were credited. One successful approach was the use of a formula to subtract the median score (1 score) from the total number of scores (15 scores) to give 14 scores which, divided by 2, would give the number of scores on either side. Many unsuccessful students attempted calculations using any or all available numbers (15, 23, 40), and lots of other numbers that were not available, to yield an impressive variety of incorrect and implausible answers. The mark scheme awarded separate credit for understanding the symbol and a good number of students managed to gain credit for this even though their answer was incorrect. Conversely, some students who got the correct answer did not get credit for the symbol because they said ‘greater’ or ‘more’. In only a handful of cases did students recognise that we could only be certain of the answer because we were told that all 15 scores were different. Several students did not attempt this question or left it until the end of the paper.
Notes from the mark scheme and report
answer 7
< means less than
all 15 scores different so median is the 8th score
separate mark for the symbol
June 2019 · Paper 3 · Q324 marksAO2=4Calculation
Mark scheme, including level descriptors and indicative content
Examiner's comment
This was another discriminating question and one which nicely illustrates the sometimes blurred distinction between knowledge and understanding. It was evident that many students who could probably calculate and define the median became confused when required to apply their knowledge to the example. More able students often drew a diagram with 23 in the middle and numbered cases either side, concluding that 23 would be the 8th score and therefore 7 people would score less than the median. Various other ways of reaching the same conclusion were credited. One successful approach was the use of a formula to subtract the median score (1 score) from the total number of scores (15 scores) to give 14 scores which, divided by 2, would give the number of scores on either side. Many unsuccessful students attempted calculations using any or all available numbers (15, 23, 40), and lots of other numbers that were not available, to yield an impressive variety of incorrect and implausible answers. The mark scheme awarded separate credit for understanding the symbol and a good number of students managed to gain credit for this even though their answer was incorrect. Conversely, some students who got the correct answer did not get credit for the symbol because they said ‘greater’ or ‘more’. In only a handful of cases did students recognise that we could only be certain of the answer because we were told that all 15 scores were different. Several students did not attempt this question or left it until the end of the paper.
Notes from the mark scheme and report
answer 7
< means less than
all 15 scores different so median is the 8th score
separate mark for the symbol
June 2018 · AS Paper 1 · Q3.34 marksAO3=4Research methods
Mark scheme, including level descriptors and indicative content
Examiner's comment
Question 03.3 It was pleasing to see how well the majority of students performed on this question. Many were able to produce accurate and detailed answers, drawing some sensible conclusions from the data. For example, the school needs to do more to encourage the recycling of food, the initiative seems to work better with younger years, so they need to try harder with the older groups. The pitfall for some students was to go beyond the data in the table and refer to conformity and obedience. For others it was to interpret the table as if it was a correlation.
Notes from the mark scheme and report
1 mark conclusion + 1 mark supporting data for age trend and for item type (younger recycle more
plastic most, food least)
going beyond the data into conformity/obedience
treating the table as a correlation
June 2018 · AS Paper 1 · Q9.22 marksAO2=2Research methods
Mark scheme, including level descriptors and indicative content
Examiner's comment
Question 09.2 This was another question students found easy. The most common answer was quantitative data because she used closed questions. Credit was also given to those who chose qualitative data because she recorded what they said; or primary data because she collected the data specifically for this study.
Notes from the mark scheme and report
quantitative (closed questions), qualitative (recorded what they said) or primary (collected for this study) + justification
levels of measurement also accepted
June 2018 · Paper 1 · Q144 marksAO2=4Research methods
Mark scheme, including level descriptors and indicative content
Examiner's comment
Many students were able to provide appropriate scattergrams, with accurate title, axes, and plotting. Others missed out on one or two marks with vague titles and/or axes. However some students, despite the questions in this section mentioning ‘relationship’, Spearman’s rho and ‘correlation’, provided completely inappropriate graphical displays e.g. histograms and bar charts. A small minority did not attempt this question at all.
Notes from the mark scheme and report
scattergram: title with both co-variables and 'relationship', labelled axes (operationalised 'score'), accurate points
joined points/bar charts = max 1 for title
June 2018 · Paper 1 · Q152 marksAO2=2Research methods
Mark scheme, including level descriptors and indicative content
Examiner's comment
This question required reference to ‘level of measurement’. Although the majority of answers could identify ordinal data for 1 mark, very few went on to characterise ordinal data or why this study produced ordinal data, which would have fully justified the use of Spearman’s rho.
June 2018 · Paper 1 · Q161 markAO2=1Multiple choice
Mark scheme, including level descriptors and indicative content
Examiner's comment
A straightforward question if the scattergram was plotted accurately, but a significant minority of students were clearly unaware that 0.15 is a negligible correlation and 0.95 a virtually perfect correlation (straight line).
Notes from the mark scheme and report
+0.70
some unaware 0.15 is negligible and 0.95 near perfect
June 2018 · Paper 2 · Q103 marksAO2=3CalculationEasy
Mark scheme, including level descriptors and indicative content
Examiner's comment
Generally this question was answered well, with over half of the students achieving all three marks available. The vast majority of students showed all the correct workings but many did not know what two significant figures meant, with many answers being given to two decimal places or students missing marks due to incorrect rounding up. Unfortunately, despite having all the correct workings, some students gave the wrong answer due to incorrect mental arithmetic. Students should be reminded to use a calculator to check their workings and save them time in the examination.
Notes from the mark scheme and report
58.5/7 = 8.4 hours (2 s.f.)
2 marks if not 2 s.f.
1 mark wrong answer with correct workings
many gave 2 d.p. or rounded wrongly
June 2018 · Paper 2 · Q112 marksAO2=2Research methodsMedium
Mark scheme, including level descriptors and indicative content
Examiner's comment
Although there were some strong responses, students generally found this harder than anticipated, with nearly one third of students failing to achieve any marks. The majority of responses given were muddled or limited, achieving only 1 mark.
Notes from the mark scheme and report
no extreme values/not skewed, uses all the data, time is interval data
nearly a third scored 0
June 2018 · Paper 2 · Q121 markAO2=1Multiple choice
Answer
C
Mark scheme, including level descriptors and indicative content
Examiner's comment
This question was answered correctly by the vast majority of students.
Notes from the mark scheme and report
answer C 27% estimated from Figure 2
vast majority correct
June 2018 · Paper 2 · Q142 marksAO1=1, AO2=1Research methods
Mark scheme, including level descriptors and indicative content
Examiner's comment
The vast majority of students were able to give an accurate description of qualitative data but less than half of these students were able to apply this to the practical scenario to gain the second mark. Many students wasted time giving generic strengths of collecting qualitative data.
Notes from the mark scheme and report
1 mark non-numerical/descriptive + 1 mark strength applied to dreams
generic strength = 0 for that mark
June 2018 · Paper 2 · Q164 marksAO2=4Research methodsMedium
Mark scheme, including level descriptors and indicative content
Examiner's comment
When students understood the concept of content analysis, this was well answered; however, over one third of students failed to achieve any marks. A worrying number of students had no idea what content analysis is, with students frequently describing correlational analysis, statistical analysis, concurrent validity, descriptive statistics and even peer review in an attempt to explain how the content (data) from an experiment could be analysed. Those that understood the term generally explained how occurrences of each category could be tallied, with better students able to explain how categories would be identified from the interview data and giving appropriate examples of these. A surprisingly small number of students seemed to have a sound practical understanding of how content analysis should be conducted and teachers should be encouraged to offer further opportunities for students to develop their understanding of content analysis through practical research.
Notes from the mark scheme and report
1 mark each: devise categories/themes, example category, work through transcripts, tally occurrences
over a third scored 0, many did not know what content analysis is
June 2018 · AS Paper 2 · Q171 markAO2=1Research methods
Mark scheme, including level descriptors and indicative content
Examiner's comment
The overwhelming majority of students answered this question correctly and there was a wide range of appropriate questions which would generate qualitative data seen in student responses. Unfortunately, a very small minority of students wrote Likert scale questions which would have generated quantitative data.
Notes from the mark scheme and report
open question, e.g. what did you like/dislike about online lessons
Likert items (quantitative) not credited
June 2018 · AS Paper 2 · Q182 marksAO2=2Research methods
Mark scheme, including level descriptors and indicative content
Examiner's comment
There were some excellent responses to this question with a range of different appropriate problems with analysing qualitative data seen. Most students who identified an appropriate problem went on to clearly explain it and thus gain full credit. However, some students failed to address the actual question posed and explained problems either with collecting qualitative data (such as ‘it takes time for participants to complete’) or with the validity of the qualitative data (such as ‘participants might lie in their responses’). Responses must be based on analysis to gain credit and the most common error seen was where students were focusing on subjectivity of the participants when answering the questions to produce the qualitative data rather than subjectivity of the researcher when analysing the qualitative data.
Notes from the mark scheme and report
researcher interpretation subjective/biased, hard to categorise/summarise
must be a problem of ANALYSIS (not collection or participants lying)
'hard to analyse/time consuming' alone = 0
June 2018 · Paper 2 · Q182 marksAO2=2CalculationEasy
Mark scheme, including level descriptors and indicative content
Examiner's comment
This question was well answered with the vast majority of students achieving full marks. Those students who lost marks generally lost them due to not answering the question posed, with students working out friendly rather than aggressive dreams or trying to calculate the number of males opposed to number of dreams or assuming that 375 dreams were classified as friendly as opposed to including social interactions. There were a small number of students who provided the right workings but gave the wrong answer, wasting valuable time unsuccessfully calculating the answer by hand. Students need to take care when reading questions and data given in tables and should use a calculator to check their answers to avoid losing unnecessary marks.
Notes from the mark scheme and report
60% of 375 = 225
1 mark correct workings wrong answer
errors: calculating friendly dreams or numbers of males
June 2018 · Paper 2 · Q194 marksAO2=4Research methodsEasy
Mark scheme, including level descriptors and indicative content
Examiner's comment
This question was generally answered well with over three quarters of students achieving at least three marks. Most commonly students lost marks for not giving both conditions of the IV in their titles or referring incorrectly to histograms or for having the bars touching. Teachers should make students aware that with discontinuous/discrete data bars should not be touching on a graph.
Notes from the mark scheme and report
1 mark each: title with IV and DV, accurate bars not touching, y-axis %, x-axis label with key
unsuitable display = max 1 (title)
title mentioning histogram not credited
June 2018 · AS Paper 2 · Q204 marksAO2=4Research methods
Mark scheme, including level descriptors and indicative content
Examiner's comment
Most students were able to draw an accurate scattergram with two appropriately labelled axes on suitable scales. A small minority of these students also produced an accurate and appropriate title which referred to the relationship between the two co-variables. However, many students failed to either provide a title for their graph or produced an inaccurate or vague title which was not sufficient for credit. There were also errors in plotting points in some responses and some students produced very small graphs with inappropriate scaling. Some students failed to read the question correctly and did not draw a scattergram. A variety of incorrect types of graph were seen but the most common was a line graph where students had joined up the plotted points.
Notes from the mark scheme and report
1 mark each: title naming the (negative) relationship and both co-variables, x axis 0-10 online hours, y axis 0-20 satisfaction, 11 points plotted accurately
not a scattergram = max 1
many omitted/vague titles
line graphs drawn
June 2018 · AS Paper 2 · Q212 marksAO2=2Research methods
Mark scheme, including level descriptors and indicative content
Examiner's comment
The vast majority of students scored one mark for this question as few responses had both components required for two marks. Most responses only included a description of the relationship between online hours and satisfaction but did not identify the relationship as a negative correlation. The description of the relationship was expressed in several different accurate ways but the most common was more online hours the less satisfied they were. A small number of students produced confused conclusions based on causal relationships which were incorrect.
Notes from the mark scheme and report
1 mark negative correlation + 1 detail (more online hours, less satisfied
no cause and effect)
most described the relationship without naming it
causal conclusions incorrect
June 2018 · AS Paper 2 · Q222 marksAO2=2CalculationEasy
Mark scheme, including level descriptors and indicative content
Examiner's comment
This question was answered very well with the vast majority of students correctly calculating both the mode and median satisfaction scores and thus being awarded full marks. A very small minority made a mistake in their calculations leading them to produce an incorrect median and/or mode. Unfortunately, a very small number of students failed to fully answer the actual question posed and calculated a mean value instead of either the median or mode.
Notes from the mark scheme and report
mode = 19, median = 12
some calculated the mean
June 2018 · AS Paper 2 · Q232 marksAO2=2Research methods
Mark scheme, including level descriptors and indicative content
Examiner's comment
There was evidently much confusion amongst students as to why the median would be more representative than the mode in this data set. Most responses simply consisted of statements of how to calculate the median and the mode rather than explaining a reason why the median might be more suitable to represent the average score in this study. Some students were able to explain why the mode was less representative of the average satisfaction scores and thus produced a limited explanation but very few were able to explain why the median was more representative. Only a very small minority of students were able to explain that the median was more representative as it is numerically closer to more of the other scores in the data set compared to the mode and thus few students gained 2 marks. Some students simply repeated the question stating that the median is more representative than the mode without any explanation.
Notes from the mark scheme and report
mode is at the top end of the scores, median is numerically closer to more scores
ordinal vs nominal argument accepted
many just described how to calculate each
June 2018 · AS Paper 2 · Q241 markAO1=1Multiple choice
Answer
B
Mark scheme, including level descriptors and indicative content
Examiner's comment
There were a lot of correct answers to this question and it was apparent that many students had the knowledge to be able to identify the negative skew in this data. However, when compared to the other MCQ on this paper, more students did not attempt this question and the number of correct responses was lower. This suggests that their knowledge of negative skew was poorer than their knowledge of introspection (Q1) and overt observations (Q4).
Notes from the mark scheme and report
correct answer B (mean < median < mode)
more non-attempts than other MCQs
June 2018 · Paper 2 · Q254 marksAO2=2, AO3=2Research methods
Mark scheme, including level descriptors and indicative content
Examiner's comment
Overall, students were able to answer this question well, although understanding of mean scores was generally better than standard deviation. It appeared that students often understood the data but failed to appropriately justify their suggestions, often simply restating information given in the table. There were also a few costly examples of justifications given without suggestions.
Notes from the mark scheme and report
mean: more nightmares after horror films + justification
SD: greater spread in horror condition + justification
restating data = 0
justifications not creditworthy in isolation
June 2018 · Paper 3 · Q244 marksAO2=4Research methods
Mark scheme, including level descriptors and indicative content
Examiner's comment
Although many students seemed well prepared for the examination, there were some notable gaps in knowledge and understanding, particularly in relation to the question on distribution. This was without doubt the worst answered question on the whole paper, with a modal mark of 0. Most students failed to address the issue of distribution and instead gave lengthy interpretations of the data in the table, comparing the measures of central tendency for the two groups and attempting to draw conclusions in relation to the study. The poor performance on this question illustrates the importance of reading questions carefully and thinking carefully about what the question means. It is likely that, having seen many examples of data interpretation questions with tables on previous papers, students automatically thought that this was a similar question and responded according. It is also likely that many students left the examination hall believing that they had answered this question well. A lucky minority of students who were not actually answering the question at all nevertheless managed to gain 1 mark by incidentally noting that the measures of central tendency for Group A were all about the same. A very small minority who understood the point of the question gained 4 marks very swiftly, often in a single sentence. A handful of students illustrated their answers with sketches of a bell-shaped curve and a positive skew.
Notes from the mark scheme and report
Group A normal (mean, median, mode similar) vs Group B positively skewed (mean > median/mode)
worst answered on paper, modal mark 0: most compared averages instead of distributions
June 2018 · Paper 3 · Q284 marksAO2=4Research methods
Mark scheme, including level descriptors and indicative content
Examiner's comment
Although many students seemed well prepared for the examination, there were some notable gaps in knowledge and understanding, particularly in relation to the question on distribution. This was without doubt the worst answered question on the whole paper, with a modal mark of 0. Most students failed to address the issue of distribution and instead gave lengthy interpretations of the data in the table, comparing the measures of central tendency for the two groups and attempting to draw conclusions in relation to the study. The poor performance on this question illustrates the importance of reading questions carefully and thinking carefully about what the question means. It is likely that, having seen many examples of data interpretation questions presented in tables on previous papers, students automatically thought that this was a similar question and responded according. It is also likely that many students left the examination hall believing that they had answered this question well. A lucky minority of students who were not actually answering the question at all nevertheless managed to gain 1 mark by incidentally noting that the measures of central tendency for Group A were all about the same. An even smaller minority who understood the point of the question gained 4 marks very swiftly, often in a single sentence. A handful of students illustrated their answers with sketches of a bell-shaped curve and a positive skew.
Notes from the mark scheme and report
stem compares two diets (dieting removed in v1.4) but marks need only distributions
Group A normal vs Group B positively skewed
worst answered on paper, modal mark 0
June 2018 · Paper 3 · Q324 marksAO2=4Research methods
Mark scheme, including level descriptors and indicative content
Examiner's comment
Although many students seemed well prepared for the examination, there were some notable gaps in knowledge and understanding, particularly in relation to the question on distribution. This was without doubt the worst answered question on the whole paper, with a modal mark of 0. Most students failed to address the issue of distribution and instead gave lengthy interpretations of the data in the table, comparing the measures of central tendency for the two groups and attempting to draw conclusions in relation to the study. The poor performance on this question illustrates the importance of reading questions carefully and thinking carefully about what the question means. It is likely that, having seen many examples of data interpretation questions presented in tables on previous papers, students automatically thought that this was a similar question and responded according. It is also likely that many students left the examination hall believing that they had answered this question well. A lucky minority of students who were not actually answering the question at all nevertheless managed to gain 1 mark by incidentally noting that the measures of central tendency for Group A were all about the same. An even smaller minority who understood the point of the question gained 4 marks very swiftly, often in a single sentence. A handful of students illustrated their answers with sketches of a bell-shaped curve and a positive skew.
Notes from the mark scheme and report
workplace stress stem
Group A normal vs Group B positively skewed
worst answered on paper, modal mark 0
June 2017 · Paper 1 · Q12 marksAO2=2Research methods
Mark scheme, including level descriptors and indicative content
Examiner's comment
This question was done reasonably well. Students could refer to quantitative, primary, or nominal/categorical data, and while some students could not then explain their answer, most provided enough information to earn the second mark. The use of questionnaires led some students to assume that this led to qualitative data, emphasising the need to read the stem material carefully.
Notes from the mark scheme and report
quantitative, primary or nominal/categorical each accepted with matching explanation
first type identified is marked
wrong identification = 0
some assumed questionnaires give qualitative data
June 2017 · AS Paper 1 · Q132 marksAO2=2Calculation
Mark scheme, including level descriptors and indicative content
Examiner's comment
A straightforward question with many students getting both marks (more than 60%). Those that didn’t tended to not appreciate that their two numbers must total 100, while others got the boys and girls the wrong way round.
Notes from the mark scheme and report
estimate from Figure 1: boys 26-37%, girls 63-74%
max 1 mark if they do not sum to 100
some reversed boys and girls
June 2017 · AS Paper 1 · Q142 marksAO2=2CalculationEasy
Mark scheme, including level descriptors and indicative content
Examiner's comment
The majority of students (more than 90%) gained both marks.
Notes from the mark scheme and report
answer 90 (150 x 0.6)
1 mark for correct working if answer wrong
over 90% full marks
June 2017 · AS Paper 1 · Q154 marksAO2=4Research methods
Mark scheme, including level descriptors and indicative content
Examiner's comment
Most students understood what is meant by quantitative data and what is meant by qualitative data. The difficulty they appeared to have was being able to describe a difference between them. A strategy for answering such questions could be to select an attribute and then describe how it differs. For example, ease of analysis; quantitative data is easily analysed and can be put into graphs, whereas qualitative data is much more difficult to analyse and has to be converted into quantitative data before it can be easily analysed. Reference to methods used to collect the data was not relevant.
Notes from the mark scheme and report
differences must be expressed as comparisons (numbers vs words, objective vs subjective, ease of analysis)
reference to collection methods not relevant
June 2017 · Paper 2 · Q72 marksAO2=2Research methods
Mark scheme, including level descriptors and indicative content
Examiner's comment
Most students were able to give a disadvantage of quantitative data, but some failed to provide appropriate application. Some common incorrect answers included disadvantages of qualitative data, advantages of quantitative data and advantages/disadvantages of questionnaires.
Notes from the mark scheme and report
1 mark disadvantage (lacks detail/validity) + 1 mark application (e.g. rating patient improvement)
common errors: disadvantages of qualitative data or of questionnaires
June 2017 · Paper 2 · Q82 marksAO2=2Research methods
Mark scheme, including level descriptors and indicative content
Examiner's comment
Nearly all students managed to gain at least one mark and many gained full credit. The quantitative question suggested was generally effective, but the qualitative question suggested could have produced a quantitative response, so did not gain credit. Some students got qualitative and quantitative the wrong way round and consequently gained no marks. The most popular method of answering the quantitative part was either to give a rating scale or to pose a question followed by the words ”Yes/No”. Although giving a closed answer response that is not officially quantitative, it was credited for this series. However, schools and colleges should ensure students are able to distinguish between quantitative and closed questions for future series.
Notes from the mark scheme and report
1 mark quantitative question + 1 mark qualitative question
qualitative item that could produce quantitative answer not credited
yes/no closed question accepted this series only
June 2017 · Paper 2 · Q122 marksAO2=2Research methodsHard
Mark scheme, including level descriptors and indicative content
Examiner's comment
This question was generally poorly answered, with 57% of students failing to achieve any marks and 3% not attempting it. There was an occasional reference to ‘”the need for continuous data”, but very few students gained the second mark. Overall, there was a lack of understanding about what a histogram is or when they should be used and schools/colleges need to address this. A common incorrect answer was to assume a histogram is used for a correlation.
Notes from the mark scheme and report
1 mark histogram needs continuous data/individual scores + 1 mark data are two separate conditions (categorical)
57% scored 0
misconception that histograms show correlations
June 2017 · Paper 2 · Q133 marksAO3=3Research methods
Mark scheme, including level descriptors and indicative content
Examiner's comment
This question was reasonably well answered. Unfortunately, a number provided a full title instead of naming the type of graph, although when these included reference to a bar chart they received appropriate credit. A number of the axis labels were vague, omitting ”seconds” or ”mean/average”, or just writing ”conditions”. There was also some confusion regarding the type of graph with ”scattergram” being the most common incorrect response.
Notes from the mark scheme and report
1 mark each: bar chart, X axis (music condition), Y axis (mean 400m time in seconds), awarded independently
vague labels and 'scattergram' common errors
June 2017 · Paper 2 · Q144 marksAO2=2, AO3=2Research methods
Mark scheme, including level descriptors and indicative content
Examiner's comment
Although there were some strong responses, generally students found this harder than anticipated. A number failed to receive any credit due to simply defining the mean and the standard deviation. It was also far too common for students not to understand and answer the ‘justify’ component of the question. Many students simply restated information from the table or provided possible explanations or conclusions, as opposed to justifications. Although students generally saw the mean as showing a difference, there was often the claim that music hindered performance, with confusion regarding time being a higher score, meaning slower. Worryingly, some students still have little understanding of standard deviation.
Notes from the mark scheme and report
mean: faster with music + justification (lower mean time in B)
SD: more consistent without music + justification (smaller SD in A)
restating data = 0
confusion that higher time = better
June 2017 · AS Paper 2 · Q152 marksAO2=2Calculation
Mark scheme, including level descriptors and indicative content
Examiner's comment
The overwhelming majority of students clearly knew how to calculate a percentage and most were awarded two marks. Virtually all also provided their workings to support their answer. Those students who gave an incorrect answer but included correct workings were awarded one mark.
Notes from the mark scheme and report
22/40 x 100 = 55%
correct workings only = 1 mark
June 2017 · Paper 2 · Q154 marksAO2=4Calculation
Mark scheme, including level descriptors and indicative content
Examiner's comment
Despite 36% of students not having the mathematical skills to answer this question appropriately and 3% not even attempting it, those who did have the knowledge answered it well. Some missed or did not understand the requirement for three significant figures.
Notes from the mark scheme and report
(123 - 117)/123 x 100 = 4.88 to 3 s.f.
3 marks if not 3 s.f.
wrong answer given to 3 s.f. = 0
36% lacked the maths skills
June 2017 · Paper 2 · Q165 marksAO2=5Research methodsEasy
Mark scheme, including level descriptors and indicative content
Examiner's comment
Questions that discriminated the best were 03, 04, 09, 16, 17 and 21. This question was generally answered very well, with the majority of students achieving all five marks. Impressively, nearly all students identified the points in mark scheme for choice of test and most could justify why the result was not significant, although a few picked the wrong critical value from the table.
Notes from the mark scheme and report
3 reasons (difference, interval data, repeated measures) + not significant because 1.4377 < critical value 1.833 (one-tailed, df 9)
some picked wrong critical value
June 2017 · AS Paper 2 · Q172 marksAO1=2Research methods
Mark scheme, including level descriptors and indicative content
Examiner's comment
The vast majority of students scored one mark for this question with their understanding that primary data is first hand data. Very few referred to it as being ‘original’ data. Even fewer students referred to primary data as data collected specifically for the research being carried out and thus few were awarded two marks. There was significant confusion in responses illustrating a lack of understanding surrounding primary data as many students were incorrectly focusing on who was collecting the data.
Notes from the mark scheme and report
original data collected specifically for the research being carried out
'collected by the researcher' alone not credited
most only said 'first-hand' (1 mark)
June 2017 · AS Paper 2 · Q182 marksAO2=2Research methods
Mark scheme, including level descriptors and indicative content
Examiner's comment
Some good responses were provided by the minority of students who understood why the mean was the most appropriate value and could refer to it as being more representative. Of these correct responses, only around half went on to clearly explain why it was the most appropriate and thus few students achieved full marks. It was evident that the vast majority did not understand why the mean would be the most appropriate measure and stated incorrect reasons, such as ‘the mean is the most appropriate as it shows the overall average’ and so scored no marks.
Notes from the mark scheme and report
mean uses all values so most representative/sensitive
'shows the overall average' = 0
June 2017 · AS Paper 2 · Q194 marksAO2=4CalculationEasy
Mark scheme, including level descriptors and indicative content
Examiner's comment
This question was answered very well with the vast majority of students producing correct mean values for both tasks and thus being awarded full marks. A small minority were awarded partial credit for stating an incorrect answer but with correct workings.
Notes from the mark scheme and report
Task A 63 (630/10), Task B 77.4 (774/10)
2 marks each, workings only = 1
June 2017 · Paper 3 · Q354 marksAO2=4Research methods
Mark scheme, including level descriptors and indicative content
Examiner's comment
Most students could happily identify the primary and secondary data in the stem material and gained marks for doing so. However, very few answers received full credit for properly explaining the difference between primary and secondary data. There was widespread misunderstanding that the distinction hinges on who collects the data, with many answers stating that primary data is that which is ‘collected by the researcher’ whilst secondary data is ‘collected by someone else’. Such answers failed to recognise the proper distinctions, ie that primary data comes directly from the source (the participants) and is collected for the purposes of the study, whereas secondary data does not come directly from the source and is not specific to the purpose of the study. Various ways of making either of these points were accepted, for example, reference to primary as original data and secondary as not original.
Notes from the mark scheme and report
primary = first-hand from participants for this aim (interviews)
secondary = pre-existing, not collected for this aim (school reports)
misconception that the distinction is who collects the data
June 2017 · Paper 3 · Q362 marksAO3=2Research methodsOld spec only
Not on the 2025 specification: thematic analysis, removed in v1.4
Mark scheme, including level descriptors and indicative content
Examiner's comment
Many students left this question blank and most of those who did attempt an answer based their response on some form of quantitative analysis, referring to categories being established prior to analysis and tallying or counting frequencies. Very rarely did students refer to transcription of the recordings, coding or emergent themes.
Notes from the mark scheme and report
Off-spec: thematic analysis, removed in v1.4
transcribe, code, look for emergent themes
no credit for pre-determined categories or counting frequencies (i.e. content analysis)
often left blank
June 2017 · Paper 3 · Q394 marksAO2=4Research methods
Mark scheme, including level descriptors and indicative content
Examiner's comment
Most students could happily identify the primary and secondary data in the stem material and gained marks for doing so. However, very few answers received full credit for properly explaining the difference between primary and secondary data. There was widespread misunderstanding that the distinction hinges on who collects the data, with many answers stating that primary data is that which is ‘collected by the researcher’ whilst secondary data is ‘collected by someone else’. Such answers failed to recognise the proper distinctions, ie that primary data comes directly from the source (the participants) and is collected for the purposes of the study, whereas secondary data does not come directly from the source and is not specific to the purpose of the study. Various ways of making either of these points were accepted, for example, reference to primary as original data and secondary as not original.
Notes from the mark scheme and report
primary = interview recordings collected for this aim
secondary = court/prison reports not collected for this aim
misconception that the distinction is who collects the data
June 2017 · Paper 3 · Q402 marksAO3=2Research methodsOld spec only
Not on the 2025 specification: thematic analysis, removed in v1.4
Mark scheme, including level descriptors and indicative content
Examiner's comment
Many students left this question blank and most of those who did attempt an answer based their response on some form of quantitative analysis, referring to categories being established prior to analysis and tallying or counting frequencies. Very rarely did students refer to transcription of the recordings, coding or emergent themes.
Notes from the mark scheme and report
Off-spec: thematic analysis, removed in v1.4
transcribe, code, emergent themes
no credit for pre-determined categories or counting frequencies
often left blank
June 2017 · Paper 3 · Q434 marksAO2=4Research methods
Mark scheme, including level descriptors and indicative content
Examiner's comment
Most students could happily identify the primary and secondary data in the stem material and gained marks for doing so. However, very few answers received full credit for properly explaining the difference between primary and secondary data. There was widespread misunderstanding that the distinction hinges on who collects the data, with many answers stating that primary data is that which is ‘collected by the researcher’ whilst secondary data is ‘collected by someone else’. Such answers failed to recognise the proper distinctions, ie that primary data comes directly from the source (the participants) and is collected for the purposes of the study, whereas secondary data does not come directly from the source and is not specific to the purpose of the study. Various ways of making either of these points were accepted, for example, reference to primary as original data and secondary as not original.
Notes from the mark scheme and report
primary = interview recordings collected for this aim
secondary = debt counsellor reports not collected for this aim
misconception that the distinction is who collects the data
June 2017 · Paper 3 · Q442 marksAO3=2Research methodsOld spec only
Not on the 2025 specification: thematic analysis, removed in v1.4
Mark scheme, including level descriptors and indicative content
Examiner's comment
Many students left this question blank and most of those who did attempt an answer based their response on some form of quantitative analysis, referring to categories being established prior to analysis and tallying or counting frequencies. Very rarely did students refer to transcription of the recordings, coding or emergent themes.
Notes from the mark scheme and report
Off-spec: thematic analysis, removed in v1.4
transcribe, code, emergent themes
no credit for pre-determined categories or counting frequencies
often left blank
June 2016 · AS Paper 1 · Q2.11 markAO2=1Multiple choiceHard
Answer
A
Mark scheme, including level descriptors and indicative content
Examiner's comment
Question 02.1 Just under a third of the responses were incorrect.
Notes from the mark scheme and report
reading the < symbol against Table 1
correct answer A (2 students)
about a third answered incorrectly
June 2016 · AS Paper 1 · Q2.22 marksAO2=2Calculation
Mark scheme, including level descriptors and indicative content
Examiner's comment
Question 02.2 The majority of answers were correct, but a number of students suggested incorrect modes. A few students calculated means here.
Notes from the mark scheme and report
value of research = 6, ethical concern = 7
some calculated means instead
June 2016 · AS Paper 1 · Q2.34 marksAO3=4Research methods
Mark scheme, including level descriptors and indicative content
Examiner's comment
Question 02.3 Many students gained full marks for this question by offering the mean and median as alternatives. Some explanations suggested that it is necessary to arrange scores in chronological (rather than numerical) order to work out the median. Of those using the range, several mistakenly asserted that the range should be calculated by taking the highest number from the lowest. Very few students referred to the standard deviation or graphical representations. Where students showed explicit calculations these were used to credit the mark for explaining how the statistics should be calculated in the absence of any verbal explanation. Those few students who did not answer were presumably confused by the term ‘descriptive statistics’.
Notes from the mark scheme and report
1 mark each for naming (median, mean, range, SD), 1 mark each for how calculated
median needs scores in numerical (not chronological) order
range is lowest from highest, not reverse
Specimen set 2 · Paper 1 · Q124 marksAO2=4Research methods
Mark scheme, including level descriptors and indicative content
Notes from the mark scheme and report
2 marks for factors (nominal data, test of difference, related/repeated measures design) + 2 for application to the absence-record study
Specimen set 2 · Paper 1 · Q153 marksAO3=3Research methods
Mark scheme, including level descriptors and indicative content
Notes from the mark scheme and report
must refer to the investigation (1 mark max otherwise): first-hand insight into treatment, absences may not validly measure depression, data tailored to aims
Specimen set 2 · Paper 2 · Q112 marksAO2=2Research methods
Mark scheme, including level descriptors and indicative content
Notes from the mark scheme and report
1 mark scattergram + 1 mark shows relationship between two co-variables
June 2016 · AS Paper 2 · Q11.43 marksAO3=3Research methods
Mark scheme, including level descriptors and indicative content
Examiner's comment
Question 11.4 Many students failed to write enough about the data. Instead, they seemed to be providing answers to a question that required justification of one chosen suggestion, often just referring to the greater reduction in Group 2/Therapy B indicating that it was more effective. There were many points that could have been extrapolated from the data in Figure 1.
Notes from the mark scheme and report
1 mark per point: both therapies effective, Group 1 angrier pre and post, Group 1 fell 20 vs Group 2 fell 25
many gave only one point
June 2016 · AS Paper 2 · Q11.71 markAO2=1Research methods
Mark scheme, including level descriptors and indicative content
Examiner's comment
Question 11.7 Answers were often disappointing as students seemed unaware that median values are a form of average and stated that a problem was the median is not an average. Others made vague statements about how the median doesn’t use all the values, but it would be difficult to find a median without the other values.
Notes from the mark scheme and report
ignores extreme values, less sensitive than the mean
many wrongly said the median is not an average
Specimen set 2 · Paper 2 · Q123 marksAO2=3Research methods
Mark scheme, including level descriptors and indicative content
Notes from the mark scheme and report
high map reading scores go with high driver ratings
positive correlation between the spatial abilities
Specimen set 2 · Paper 2 · Q143 marksAO2=3Research methods
Mark scheme, including level descriptors and indicative content
Notes from the mark scheme and report
test of relationship/correlation, related pairs of data, ordinal (ratings) data
Specimen set 2 · Paper 2 · Q154 marksAO2=2, AO3=2Research methods
Mark scheme, including level descriptors and indicative content
Notes from the mark scheme and report
reject null, significant positive relationship
justify: rs 0.808 exceeds critical value 0.700 for two-tailed p=0.05, N=9 (non-directional hypothesis)
Specimen set 2 · Paper 2 · Q174 marksAO2=2, AO3=2Research methods
Mark scheme, including level descriptors and indicative content
Notes from the mark scheme and report
2 marks means (males almost 3x higher, better at map reading) + 2 marks SDs (similar spread within each group)
Specimen set 2 · Paper 2 · Q184 marksAO2=4Calculation
Mark scheme, including level descriptors and indicative content
Notes from the mark scheme and report
males 13/20 = 65%, females 5/20 = 25%
correct procedure but wrong answer = 1 mark each, max 2
Specimen set 2 · Paper 2 · Q192 marksAO2=2Research methods
Mark scheme, including level descriptors and indicative content
Notes from the mark scheme and report
percentages confirm men much better at map reading than women
Specimen set 2 · Paper 3 · Q3.21 markAO2=1Research methods
Mark scheme, including level descriptors and indicative content
Notes from the mark scheme and report
nominal (categorical)
Specimen set 2 · Paper 3 · Q3.32 marksAO3=2Research methods
Mark scheme, including level descriptors and indicative content
Notes from the mark scheme and report
1 mark crude/does not allow sensitive analysis + 1 mark no numerical score for each participant
Specimen set 2 · Paper 3 · Q304 marksAO2=4Calculation
Mark scheme, including level descriptors and indicative content
Notes from the mark scheme and report
median Group A 11, Group B 8.5 (1 mark each) + 2 marks median chosen because extreme scores (35, 24) would distort the mean
level-of-measurement answers accepted
Specimen set 2 · Paper 3 · Q354 marksAO2=4Calculation
Mark scheme, including level descriptors and indicative content
Notes from the mark scheme and report
median cognitive group 34.5, discussion group 50.5 (1 mark each, show working) + 2 marks median used because ratings are not interval data (units of variable size)
Specimen set 2 · Paper 3 · Q394 marksAO2=4Calculation
Mark scheme, including level descriptors and indicative content
Notes from the mark scheme and report
median Group A 29.5, Group B 24.5 (1 mark each) + 2 marks for extreme scores (65, 59)
question asks median rather than MODE but MS answer refers to the mean
MS gives no marks for the range despite the question asking for it
Specimen set 1 · Paper 1 · Q4.12 marksAO2=2Research methods
Mark scheme, including level descriptors and indicative content
Notes from the mark scheme and report
mean + justification (uses all scores/no outliers to distort it)
Specimen set 1 · Paper 1 · Q4.24 marksAO2=4Calculation
Mark scheme, including level descriptors and indicative content
Notes from the mark scheme and report
mean A = 5.6, B = 12.5 with calculations
median (5.5, 12.5) also full credit
mode max 2 (A = 4, B = 11 and 14)
Specimen set 1 · AS Paper 1 · Q6.16 marksAO2=6Research methods
Mark scheme, including level descriptors and indicative content
Notes from the mark scheme and report
1 mark each: bar chart, both axes labelled, informative title with IV and DV, appropriate y-axis scale, bars separate, bars plotted correctly
Specimen set 1 · Paper 1 · Q15.12 marksAO3=2Research methods
Mark scheme, including level descriptors and indicative content
Notes from the mark scheme and report
positive correlation + correlation shows relationship not cause
Specimen set 1 · Paper 1 · Q15.34 marksAO3=4Research methods
Mark scheme, including level descriptors and indicative content
Notes from the mark scheme and report
same participants complete questionnaire twice
correlate scores (scattergram)
Spearman's rho/Pearson's r
compare with critical value, strong positive correlation needed
Specimen set 1 · AS Paper 2 · Q5.22 marksAO2=2Calculation
Mark scheme, including level descriptors and indicative content
Notes from the mark scheme and report
30.75 (246/8)
correct answer without workings = 1 mark
Specimen set 1 · AS Paper 2 · Q5.31 markAO3=1Multiple choice
Answer
D
Mark scheme, including level descriptors and indicative content
Notes from the mark scheme and report
correct answer D (63/3 = 21 times faster)
Specimen set 1 · AS Paper 2 · Q12.51 markAO2=1Calculation
Mark scheme, including level descriptors and indicative content
Notes from the mark scheme and report
15 participants / 5 groups = 3
Specimen set 1 · AS Paper 2 · Q12.61 markAO1=1Research methods
Mark scheme, including level descriptors and indicative content
Notes from the mark scheme and report
range or standard deviation
Specimen set 1 · AS Paper 2 · Q12.71 markAO2=1Research methods
Mark scheme, including level descriptors and indicative content
Notes from the mark scheme and report
statistic greater in Condition A than Condition B
Specimen set 1 · AS Paper 2 · Q12.92 marksAO3=2Research methods
Mark scheme, including level descriptors and indicative content
Notes from the mark scheme and report
divide each condition total by overall total 185, then multiply by 100
Specimen set 1 · Paper 2 · Q186 marksAO2=2, AO3=4Research methods
Mark scheme, including level descriptors and indicative content
Notes from the mark scheme and report
conclusions for both means (about 6 more errors with large audience) and SDs (Condition A less dispersed) with justification using the values
one done well = max Level 2
Specimen set 1 · Paper 2 · Q193 marksAO3=3Research methods
Mark scheme, including level descriptors and indicative content
Notes from the mark scheme and report
SD less distorted by a single extreme score
uses distance of all scores from the mean
not just highest minus lowest
Specimen set 1 · Paper 2 · Q204 marksAO2=4Research methods
Mark scheme, including level descriptors and indicative content
Notes from the mark scheme and report
1 mark unrelated t-test or Mann-Whitney + up to 3: interval (or ordinal) data, independent groups, test of difference
SDs quite different supports Mann-Whitney
Specimen set 1 · Paper 3 · Q6.24 marksAO2=4Research methods
Mark scheme, including level descriptors and indicative content
Notes from the mark scheme and report
correlate scores with an established maths reasoning test on the same people
Spearman's rho or Pearson's r
valid if significant positive correlation
must focus on concurrent validity for Level 2
Specimen set 1 · Paper 3 · Q8.13 marksAO2=3Research methods
Mark scheme, including level descriptors and indicative content
Notes from the mark scheme and report
negatively skewed (mean 8.6 < median 9.5 < mode 13): 1 mark tail to left, 1 mark axis labels (score / frequency), 1 mark mean, median, mode positioned correctly
Specimen set 1 · Paper 3 · Q8.21 markAO2=1Research methods
Mark scheme, including level descriptors and indicative content
Notes from the mark scheme and report
negative skew
follow-through credit if it matches the sketch in 08.1
Specimen set 1 · Paper 3 · Q13.13 marksAO2=3Research methods
Mark scheme, including level descriptors and indicative content
Notes from the mark scheme and report
positively skewed (mode 7 < median 9.5 < mean 10.3): 1 mark tail to right, 1 mark axis labels, 1 mark positions
stem is a sex-role inventory study of androgyny but marks need only distributions
Specimen set 1 · Paper 3 · Q13.21 markAO2=1Research methods
Mark scheme, including level descriptors and indicative content
Notes from the mark scheme and report
positive skew
follow-through credit if it matches the sketch in 13.1
Specimen set 1 · Paper 3 · Q18.13 marksAO2=3Research methods
Mark scheme, including level descriptors and indicative content
Notes from the mark scheme and report
negatively skewed (mean 4.8 < median 5 < mode 6): 1 mark tail to left, 1 mark axis labels, 1 mark positions
Specimen set 1 · Paper 3 · Q18.21 markAO2=1Research methods
Mark scheme, including level descriptors and indicative content
Notes from the mark scheme and report
negative skew
follow-through credit if it matches the sketch in 18.1
Work with an AQA psychology tutor
Essays not reaching the top band? Book a session with Andy, a former AQA examiner.